

Sources of variation in multicenter rectal MRI data and their effect on radiomics feature reproducibility
- PMID: 34655313
- PMCID: PMC8831294
- DOI: 10.1007/s00330-021-08251-8
Sources of variation in multicenter rectal MRI data and their effect on radiomics feature reproducibility
Abstract
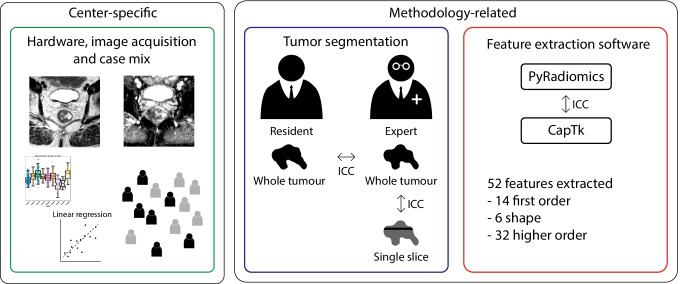
Objectives: To investigate sources of variation in a multicenter rectal cancer MRI dataset focusing on hardware and image acquisition, segmentation methodology, and radiomics feature extraction software.
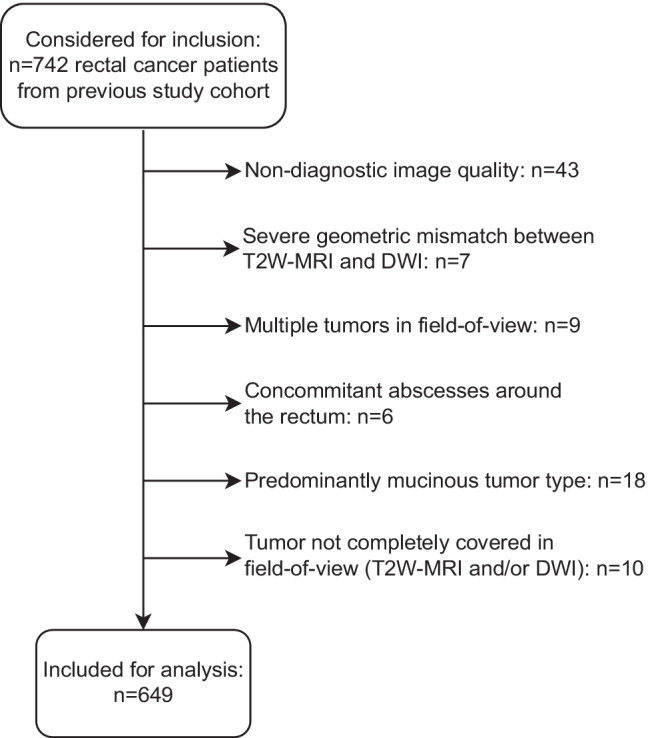
Methods: T2W and DWI/ADC MRIs from 649 rectal cancer patients were retrospectively acquired in 9 centers. Fifty-two imaging features (14 first-order/6 shape/32 higher-order) were extracted from each scan using whole-volume (expert/non-expert) and single-slice segmentations using two different software packages (PyRadiomics/CapTk). Influence of hardware, acquisition, and patient-intrinsic factors (age/gender/cTN-stage) on ADC was assessed using linear regression. Feature reproducibility was assessed between segmentation methods and software packages using the intraclass correlation coefficient.
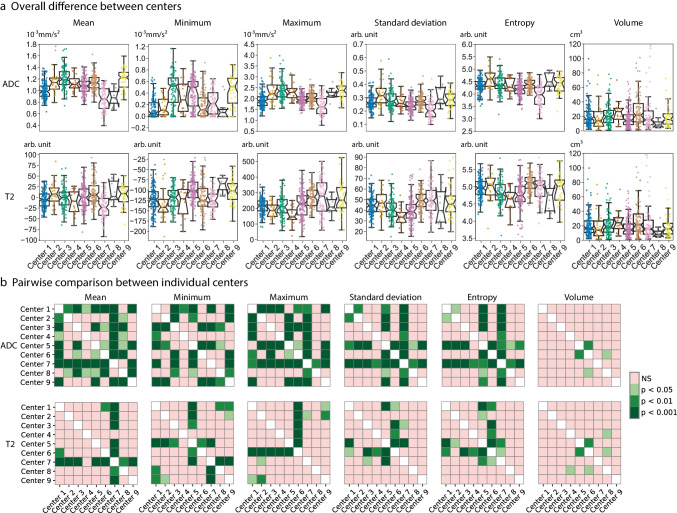
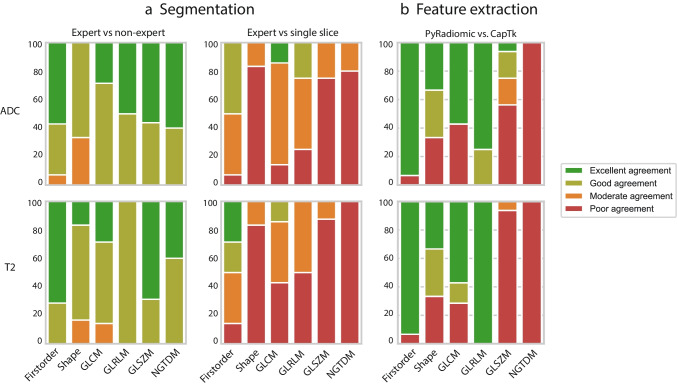
Results: Image features differed significantly (p < 0.001) between centers with more substantial variations in ADC compared to T2W-MRI. In total, 64.3% of the variation in mean ADC was explained by differences in hardware and acquisition, compared to 0.4% by patient-intrinsic factors. Feature reproducibility between expert and non-expert segmentations was good to excellent (median ICC 0.89-0.90). Reproducibility for single-slice versus whole-volume segmentations was substantially poorer (median ICC 0.40-0.58). Between software packages, reproducibility was good to excellent (median ICC 0.99) for most features (first-order/shape/GLCM/GLRLM) but poor for higher-order (GLSZM/NGTDM) features (median ICC 0.00-0.41).
Conclusions: Significant variations are present in multicenter MRI data, particularly related to differences in hardware and acquisition, which will likely negatively influence subsequent analysis if not corrected for. Segmentation variations had a minor impact when using whole volume segmentations. Between software packages, higher-order features were less reproducible and caution is warranted when implementing these in prediction models.
Key points: • Features derived from T2W-MRI and in particular ADC differ significantly between centers when performing multicenter data analysis. • Variations in ADC are mainly (> 60%) caused by hardware and image acquisition differences and less so (< 1%) by patient- or tumor-intrinsic variations. • Features derived using different image segmentations (expert/non-expert) were reproducible, provided that whole-volume segmentations were used. When using different feature extraction software packages with similar settings, higher-order features were less reproducible.
Keywords: Image processing, Computer-assisted; Magnetic resonance imaging; Multicenter study; Rectal neoplasms; Reproducibility of results.
© 2021. The Author(s).
Conflict of interest statement
The authors of this manuscript declare no relationships with any companies whose products or services may be related to the subject matter of the article.
Figures
References
Publication types
MeSH terms
Grants and funding
LinkOut - more resources
Full Text Sources
Medical
