

Dual energy window imaging for optimisation of P/V ratios in VP SPECT
- PMID: 34655369
- PMCID: PMC8520548
- DOI: 10.1186/s40658-021-00417-z
Dual energy window imaging for optimisation of P/V ratios in VP SPECT
Abstract
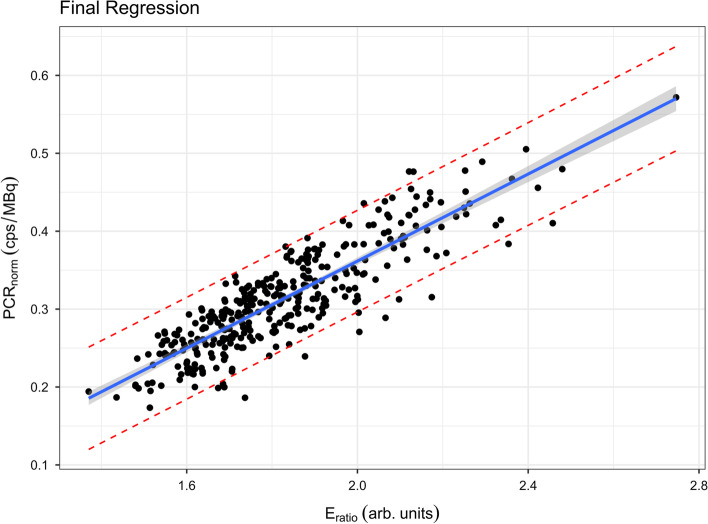
Purpose: Ventilation-perfusion single-photon emission computed tomography (VP SPECT) plays an important role in pulmonary embolism diagnosis. Rapid results may be obtained using same-day ventilation followed by perfusion imaging, but generally requires careful attention to achieving an optimal count rate ratio (P/V ratio) of ≥ 3:1. This study investigated whether the ratio of counts simultaneously acquired in adjacent primary and Compton scatter energy windows (Eratio) on V SPECT was predictive of final normalised perfusion count rate (PCRnorm) on P SPECT using [99mTc]Tc-macroaggregated albumin (MAA), thus allowing for optimisation of P/V ratios.
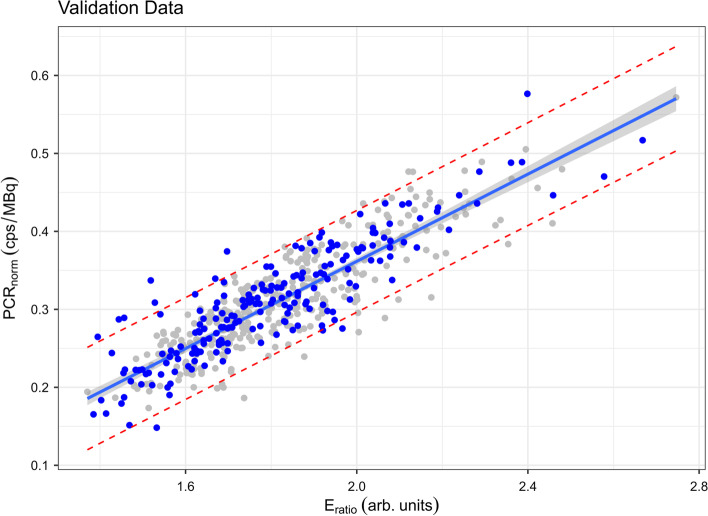
Methods: Same-day VP SPECT studies acquired using standard protocols in adult patients during a 2-year period (training dataset) were assessed. Studies were included provided they were acquired with correct imaging parameters, and injection site imaging and laboratory records were available for quality control and normalised count rate corrections. Extraction of DICOM information, and linear regression were performed using custom Python and R scripts. A predictive tool was developed in Microsoft Excel. This tool was then validated using a second (validation) dataset of same-day studies acquired over a subsequent 7-month period. Accuracy of the prediction tool was assessed by calculating the mean absolute percentage error (MAPE).
Results: Of 643 studies performed, the scans of 342 participants (median age 30.4 years, 318 female) were included in the training dataset, the analysis of which yielded a significant regression equation (F(1,340) = 1057.3, p < 0.0001), with an adjusted R2 of 0.756 and MSE of 0.001089. A prediction tool designed for routine clinical use was developed for predicting final P/V ratio. Of an additional 285 studies, 198 were included in the second (validation) dataset (median age 29.7 years, 188 female). The Excel-based tool was shown to be 91% accurate (MAPE: 9%) in predicting P/V ratio.
Conclusion: The relationship between the ratio of simultaneously acquired counts in adjacent energy windows on V SPECT and perfusion count rate after administration of a known activity of [99mTc]Tc-MAA can be linearly approximated. A predictive tool based on this work may assist in optimising the dose and timing of [99mTc]Tc-MAA administration in same-day studies to the benefit of patients and workflows.
Keywords: Count rate ratio; Lung SPECT; Perfusion; Pulmonary embolism; Ventilation.
© 2021. The Author(s).
Conflict of interest statement
The authors have no relevant financial or non-financial interests to disclose.
Figures


References
-
- Bajc M, Schümichen C, Grüning T, Lindqvist A, Le Roux P-Y, Alatri A, et al. EANM guideline for ventilation/perfusion single-photon emission computed tomography (SPECT) for diagnosis of pulmonary embolism and beyond. Eur J Nucl Med Mol Imaging. 2019;46:2429–2451. doi: 10.1007/s00259-019-04450-0. - DOI - PMC - PubMed
-
- Bajc M, Neilly JB, Miniati M, Schuemichen C, Meignan M, Jonson B, et al. EANM guidelines for ventilation/perfusion scintigraphy: part 1. Pulmonary imaging with ventilation/perfusion single photon emission tomography. Eur J Nucl Med Mol Imaging. 2009;36:1356–1370. doi: 10.1007/s00259-009-1170-5. - DOI - PubMed
-
- Palmer J, Bitzén U, Jonson B, Bajc M. Comprehensive ventilation/perfusion SPECT. J Nucl Med. 2001;42:1288–1294. - PubMed
-
- Cherry SR, Sorenson JA, Phelps ME. Physics in nuclear medicine. Elsevier Health Sciences; 2012.
Grants and funding
LinkOut - more resources
Full Text Sources
