. 2021 Dec 15;109(24):3962-3979.e6.
doi: 10.1016/j.neuron.2021.09.040. Epub 2021 Oct 15.

Genome instability independent of type I interferon signaling drives neuropathology caused by impaired ribonucleotide excision repair

Affiliations

Genome instability independent of type I interferon signaling drives neuropathology caused by impaired ribonucleotide excision repair

Aditi et al. Neuron. .

Abstract

Aicardi-Goutières syndrome (AGS) is a monogenic type I interferonopathy characterized by neurodevelopmental defects and upregulation of type I interferon signaling and neuroinflammation. Mutations in genes that function in nucleic acid metabolism, including RNASEH2, are linked to AGS. Ribonuclease H2 (RNASEH2) is a genome surveillance factor critical for DNA integrity by removing ribonucleotides incorporated into replicating DNA. Here we show that RNASEH2 is necessary for neurogenesis and to avoid activation of interferon-responsive genes and neuroinflammation. Cerebellar defects after RNASEH2B inactivation are rescued by p53 but not cGAS deletion, suggesting that DNA damage signaling, not neuroinflammation, accounts for neuropathology. Coincident inactivation of Atm and Rnaseh2 further affected cerebellar development causing ataxia, which was dependent upon aberrant activation of non-homologous end-joining (NHEJ). The loss of ATM also markedly exacerbates cGAS-dependent type I interferon signaling. Thus, DNA damage-dependent signaling rather than type I interferon signaling underlies neurodegeneration in this class of neurodevelopmental/neuroinflammatory disease.

Keywords: ATM; Aicardi-Goutières syndrome; Cerebellum; DNA damage; Microglia; Neurodegeneration; Neurodevelopment; Neuroinflammation; RNaseH2; cGAS/STING.


Conflict of interest statement

Declaration of interests The authors declare no competing interests.

Figures
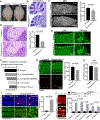
Figure 1:
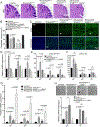
Figure 1:. RNASEH2 deficiency in the mouse nervous system recapitulates AGS.
(A) Comparative images of WT and Rnaseh2bNes-cre brain. (B) H&E shows loss of granule neurons in the Rnaseh2bNes-cre cerebellum, particularly in the anterior cerebellum (arrows). (C) MRI volumetric analysis shows a significant reduction in the size of the cerebellum occurs after RNASEH2B inactivation (white circle). (D) H&E staining reveals loss of granule cells and interneurons in the Rnaseh2bNes-cre cerebellum (arrows). Graph shows interneuron quantification; IGL is internal granule layer and ML is molecular layer. Boxed areas show comparative granule neuron density. (E) Purkinje cells and oligodendrocytes appear unaffected by RNASEH2B deficiency as shown by CA8 and CNPase immunostaining. (F) Gene Set Enrichment Analysis (GSEA) of RNA-seq from 9-week-old control and Rnaseh2bNes-cre cerebellum identifies underrepresentation of genes related to granule and interneuron cells in the mutant cerebellum. (G) In the Rnaseh2bNes-cre cortex, a thinning of the corpus callosum (CC) and reduction in oligodendrocytes is observed using CNPase and Olig2 immunostaining, respectively. Olig2 in the corpus callosum is significantly reduced in the Rnaseh2bNes-cre cortex. (H) MRI-diffusion tensor imaging of 5-month-old Rnaseh2bNes-cre brains display reduced white matter (corpus callosum) fractional anisotropy. (I) γH2AX immunostaining reveals DNA damage in the P5 cerebellar EGL (arrows); quantified in adjacent graph. PCNA marks proliferative cells. (J) TUNEL staining reveals RNASEH2B inactivation causes cell death in the P5 cerebellum (arrows). The number of TUNEL positive cells/mm2 varies between anterior and posterior cerebellar lobules in Rnaseh2bNes-cre mice indicating disproportionate cell loss. All graphical data are mean ± s.e.m. See also Figure S1 and Tables S1, S2.
Figure 2:
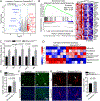
Figure 2:. Induction of type I interferon and inflammation in the Rnaseh2bNes-cre nervous system.
(A) Volcano plot of RNA-seq data shows genes with increased (red) and decreased (blue) expression in Rnaseh2bNes-cre cerebellum compared to control tissue. Representative genes are listed. Dashed vertical lines demarcate Log2FC >1 or −1. Dashed green line corresponds to p-value of 0.05. (B) GSEA analysis shows significant enrichment of hallmark type I interferon alpha pathway genes in adult Rnaseh2bNes-cre cerebellum compared to control. The adjacent heatmap shows gene expression changes that support the GSEA. (C) Transcript levels of several interferon-responsive genes are increased in Rnaseh2bNes-cre cerebellum as measured by qPCR; Gapdh was used to normalize expression. (D) Heatmap of GSVA cell type enrichment analysis of RNA-seq data indicates enrichment of astrocyte and microglia-enriched genes in the Rnaseh2bNes-cre cerebellum. (E) qPCR analysis shows increased Gfap mRNA in the 9-week-old Rnaseh2bNes-cre cerebellum compared to control. (F) GFAP immunostaining shows an enhanced activation of astrocytes (arrows) in the Rnaseh2bNes-cre cerebellum. (G) The microglia marker Iba1 is also elevated in the Rnaseh2bNes-cre cerebellum; data is ± s.e.m. of Iba1 positive cells. See also Figure S2 and Tables S1, S2, S3.
Figure 3:
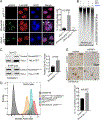
Figure 3:. Neural inactivation of RNASEH2B causes DNA damage accumulation.
A) Significant numbers of (Rnaseh2b;p53)Nes-cre cells are multi-nucleated compared to control or (Xrcc1;p53)Nes-cre astrocytes. Immunostaining with LaminB1 and γH2AX antibodies show that these multinucleated cells have lobular nuclear morphology, surrounded by LaminB1 and accumulated DNA damage (arrows). B) Gel electrophoresis reveals enhanced sensitivity of sodium hydroxide (NaOH)-treated genomic DNA from (Rnaseh2b;p53)Nes-cre cells compared to p53Nes-cre cells, consistent with incorporation of ribonucleotides into DNA. (C) RNASEH2B loss results in increased Top1cc in Rnaseh2bNes-cre cerebellum compared to controls, as quantified using an ICE assay. DNA loading is measured using SYBR Gold. HeLa cells treated with camptothecin (CPT) serve as a positive control for Top1cc formation. (D) Flow cytometry analysis of ssDNA immunostaining using ssDNA antibody shows an enhanced accumulation of cytoplasmic DNA in (Rnaseh2b;p53)Nes-cre compared with p53Nes-cre astrocytes. S1 nuclease abolishes the ssDNA staining indicating specificity. (E) ssDNA immunostaining shows increased ssDNA positive cells in the Rnaseh2bNes-cre cerebellum compared to control, while treatment of sections with S1 nuclease reduces ssDNA staining (arrows), indicated in the graph below (mean ± s.e.m.). See also Figure S3.
Figure 4:
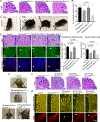
Figure 4:. ATM suppresses cerebellar atrophy in the Rnaseh2bNes-cre brain in a NHEJ-dependent manner.
(A) H&E staining of P28 (Rnaseh2b;Atm)Nes-cre shows marked exacerbation of the Rnaseh2bNes-cre cerebellar phenotype (arrows), while the (Rnaseh2b;p53)Nes-cre brain shows rescue of Rnaseh2bNes-cre cerebellar size. (B) MRI volumetric measurement of P28 mouse brains of respective genotypes indicate a significant reduction of cerebellar volume in the (Rnaseh2b;Atm)Nes-cre tissue. (C) Dual inactivation of Rnaseh2b and Atm in mice causes ataxia (arrows). (D) H&E and immunofluorescence staining using parvalbumin show that p53 deletion, but not ATM, rescues loss of interneurons in Rnaseh2bNes-cre cerebellum. Pax2 immunostaining for precursors at P5 shows a loss of cerebellar interneuron progenitors in Rnaseh2bNes-cre cerebellum, which is exacerbated after ATM loss; in contrast, p53 deletion rescues the numbers of Pax2 +ve cells. Quantification is on the adjacent bar graph; mean ± s.e.m. (E-G) Inactivation of the NHEJ pathway by Lig4 deletion recues neuropathology of (Rnaseh2b; Atm)Nes-cre mice. (E) (Rnaseh2b;Atm)Nes-cre mice are ataxic and display hindlimb clasping defects (arrow) that are rescued by inactivation of Lig4 or p53. (F) H&E staining shows rescue of cerebellar size and morphology of (Rnaseh2b;Atm)Nes-cre mice after Lig4 or p53 loss. (G) Immunostaining for calbindin/CA8 or MBP illustrates rescue of Purkinje cell organization and myelination defects upon Lig4 or p53 inactivation in (Rnaseh2b;Atm)Nes-cre mice. ns=not significant; ML=molecular layer. See also Figures S4 and S5.
Figure 5:
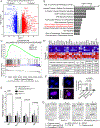
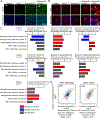
Figure 5:. ATM suppresses activation of type I interferon and neuroinflammation in the Rnaseh2bNes cre brain.
(A) A volcano plot of RNA-seq analysis shows differentially expressed genes in (Rnaseh2b;Atm)Nes-cre cerebellum compared to control. Representative genes are listed. Dashed vertical lines correspond to FC <−1 or >1. Dashed green line corresponds to p value <0.05, and genes above this line are defined as significant. (B) The top 10 most significantly enriched pathway analyzed by ingenuity pathway analysis. (C-D) GSEA analysis shows significant enrichment of hallmark type I interferon alpha pathway genes in adult (Rnaseh2b;Atm)Nes-cre cerebellum compared to control. Affected genes that drive enrichment are indicated in the adjacent heatmap. Enrichment scores for various genotype comparisons are shown in the table. (E) Transcript levels of several interferon-responsive genes are increased upon combined loss of ATM and RNASEH2B function as measured by qPCR. (F) Rnaseh2bNes-cre astrocytes exhibit increased micronuclei formation (arrows) compared to control cells, and this phenotype is amplified upon additional inactivation of ATM. Micronuclei also accumulates DNA damage as shown by γH2AX immunostaining. (G) Cytokine array analyses of secreted factors in the supernatant of astrocytes from the respective genotypes indicates enhanced release of inflammatory molecules upon combined inactivation of RNASEH2B and ATM. See also Figures S6, S7 and Tables S1, S2.
Figure 6:
Figure 6:. Distinct reactive microglia states occur after neural inactivation of RNASEH2 and ATM.
(A) GFAP immunostaining reveals activation of astrocytes in Rnaseh2bNes-cre, which is further increased in (Rnaseh2b;Atm)Nes-cre. In (Rnaseh2b;Atm)Nes-cre cerebellum, astrocyte morphology is characterized by thickening of cellular processes (arrow). (B) Iba1 immunostaining shows enhanced activation of microglia in (Rnaseh2b;Atm)Nes-cre compared to control (arrows). (C) GSEA at P5, P28 and 9 weeks reveal distinct reactive microglia phenotype in the Rnaseh2bNes-cre and (Rnaseh2b;Atm)Nes-cre cerebellum. The majority of IRF8-known consensus targets, but not IRF1, are enriched in the ‘late-response’ microglia reactive state in Rnaseh2bNes-cre and (Rnaseh2b;Atm)Nes-cre cerebellum compared to controls. FDR <0.05 is considered significant. (D) Correlation analyses between the Log2FC of Rnaseh2bNes-cre vs. Control and (Rnaseh2b;Atm)Nes-cre vs. Control for individual genes at P28 show the relationship between IRF1 or IRF8 genes vs. that of all genes. IRF8 targets show an increased enrichment in (Rnaseh2b;Atm)Nes-cre vs. Control. See also Table S2.
Figure 7:
Figure 7:. Type I interferon signaling does not mediate Rnaseh2bNes-cre neuropathology.
(A) H&E staining shows that cGAS deletion only modestly rescues cerebellar size of Rnaseh2bNes-cre mice, but not in the more affected (Rnaseh2b;Atm)Nes-cre. (B) MRI analyses of brains of respective genotypes indicate that cGAS inactivation does not rescue the smaller cerebellar size of (Rnaseh2b;Atm)Nes-cre. (C) GFAP immunostaining shows astrocytosis in Rnaseh2bNes-cre and (Rnaseh2b;Atm)Nes-cre cerebellum, which is not rescued by cGAS deletion. (D) In astrocytes, cGAS inactivation rescues enhanced type I IFN signaling observed after RNASEH2B loss. qPCR analysis shows induction of transcript levels of Ifit1,Ifit3 and Irf7 upon RNASEH2B depletion, which is rescued by cGAS deletion. (E-F) Stimulation of astrocytes with poly(dA:dT) or poly(I:C) agents results in heightened induction of interferon-stimulated genes, which is rescued by cGAS deletion for poly(dA:dT) (E), but not for poly(I:C) (F). (G) cGAS deletion, but not p53, rescues type I IFN signaling in (Rnaseh2b;Atm)Nes-cre astrocytes as evident by qPCR analysis of interferon -stimulated genes. (H) cGAS deletion does not rescue the senescent phenotype of Rnaseh2bNes-cre astrocytes. Rnaseh2bNes-cre;cGAS−/− astrocytes exhibit flat morphology (arrow), show growth similar to Rnaseh2bNes-cre cells and show increased expression of P16 and P21 transcripts. ns=not significant; ML=molecular layer.

Comment in

References

    1. Abdel-Salam GM, Zaki MS, Lebon P, and Meguid NA (2004). Aicardi-Goutieres syndrome: clinical and neuroradiological findings of 10 new cases. Acta Paediatr 93, 929–936. - PubMed
    1. Aicardi J, and Goutieres F (1984). A progressive familial encephalopathy in infancy with calcifications of the basal ganglia and chronic cerebrospinal fluid lymphocytosis. Ann Neurol 15, 49–54. - PubMed
    1. Akwa Y, Hassett DE, Eloranta ML, Sandberg K, Masliah E, Powell H, Whitton JL, Bloom FE, and Campbell IL (1998). Transgenic expression of IFN-alpha in the central nervous system of mice protects against lethal neurotropic viral infection but induces inflammation and neurodegeneration. J Immunol 161, 5016–5026. - PubMed
    1. Amon JD, and Koshland D (2016). RNase H enables efficient repair of R-loop induced DNA damage. Elife 5. - PMC - PubMed
    1. Anders S, Pyl PT, and Huber W (2015). HTSeq--a Python framework to work with high-throughput sequencing data. Bioinformatics 31, 166–169. - PMC - PubMed

Publication types