. 2022;13(2):459-482.
doi: 10.1016/j.jcmgh.2021.10.002. Epub 2021 Oct 14.

Hepatocyte-Specific Deletion of HIF2α Prevents NASH-Related Liver Carcinogenesis by Decreasing Cancer Cell Proliferation

Affiliations

Hepatocyte-Specific Deletion of HIF2α Prevents NASH-Related Liver Carcinogenesis by Decreasing Cancer Cell Proliferation

Beatrice Foglia et al. Cell Mol Gastroenterol Hepatol. 2022.

Abstract

Background & aims: Hypoxia and hypoxia-inducible factors (HIFs) are involved in chronic liver disease progression. We previously showed that hepatocyte HIF-2α activation contributed significantly to nonalcoholic fatty liver disease progression in experimental animals and human patients. In this study, using an appropriate genetic murine model, we mechanistically investigated the involvement of hepatocyte HIF-2α in experimental nonalcoholic steatohepatitis (NASH)-related carcinogenesis.

Methods: The role of HIF-2α was investigated by morphologic, cellular, and molecular biology approaches in the following: (1) mice carrying hepatocyte-specific deletion of HIF-2α (HIF-2α-/- mice) undergoing a NASH-related protocol of hepatocarcinogenesis; (2) HepG2 cells stably transfected to overexpress HIF-2α; and (3) liver specimens from NASH patients with hepatocellular carcinoma.

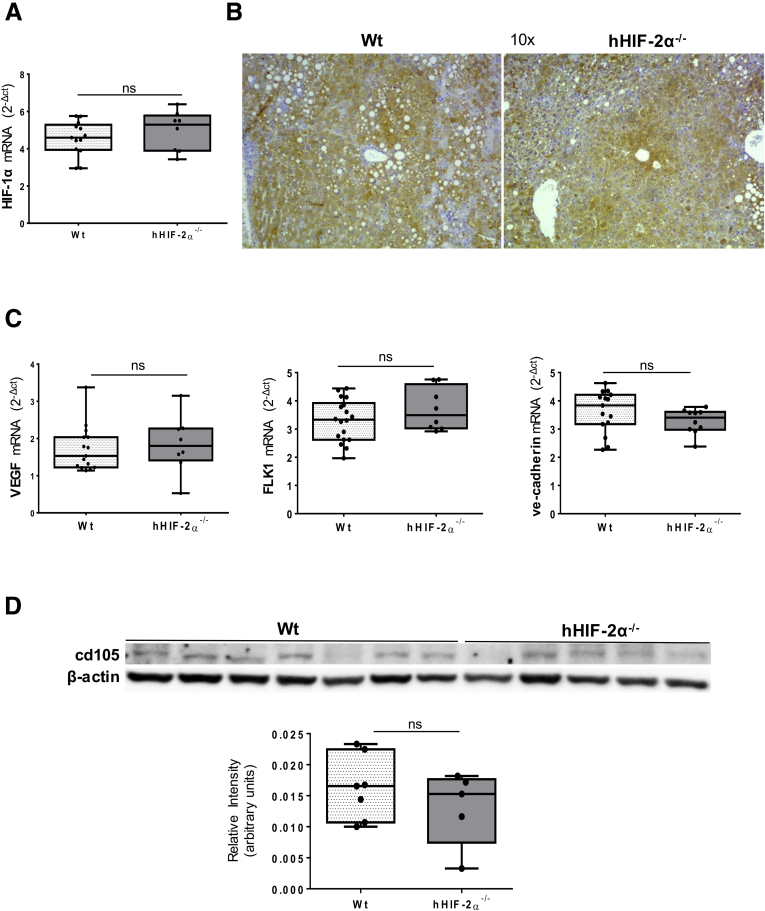
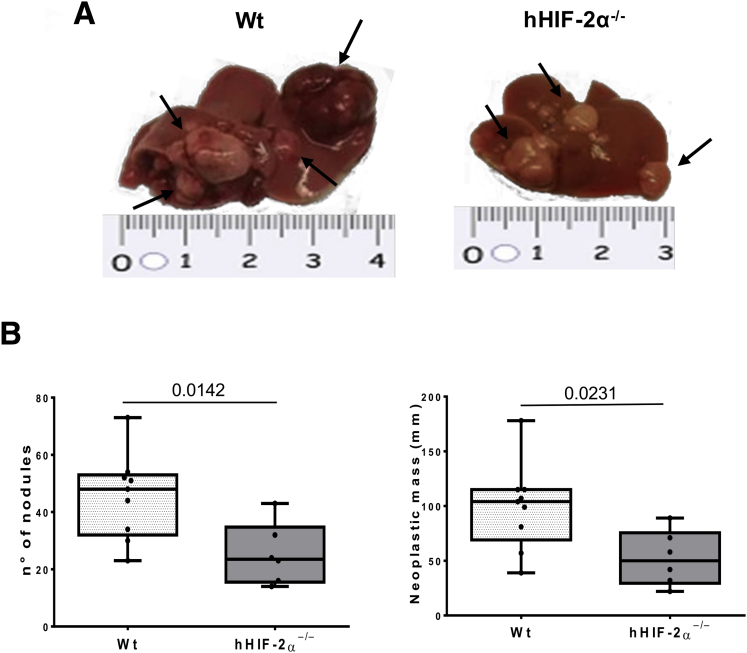
Results: Mice carrying hepatocyte-specific deletion of HIF-2α (hHIF-2α-/-) showed a significant decrease in the volume and number of liver tumors compared with wild-type littermates. These effects did not involve HIF-1α changes and were associated with a decrease of cell proliferation markers proliferating cell nuclear antigen and Ki67. In both human and rodent nonalcoholic fatty liver disease-related tumors, HIF-2α levels were strictly associated with hepatocyte production of SerpinB3, a mediator previously shown to stimulate liver cancer cell proliferation through the Hippo/Yes-associated protein (YAP)/c-Myc pathway. Consistently, we observed positive correlations between the transcripts of HIF-2α, YAP, and c-Myc in individual hepatocellular carcinoma tumor masses, while HIF-2α deletion down-modulated c-Myc and YAP expression without affecting extracellular signal-regulated kinase 1/2, c-Jun N-terminal kinase, and AKT-dependent signaling. In vitro data confirmed that HIF-2α overexpression induced HepG2 cell proliferation through YAP-mediated mechanisms.

Conclusions: These results indicate that the activation of HIF-2α in hepatocytes has a critical role in liver carcinogenesis during NASH progression, suggesting that HIF-2α-blocking agents may serve as novel putative therapeutic tools.

Keywords: HIF-2α; Hepatocellular Carcinoma; NAFLD; NASH.


Figures

None
Graphical abstract
Figure 1
Figure 1
Experimental NAFLD/NASH-related HCC: the DEN–CDAA murine model. (A) Graphic representation of the rodent model of NAFLD-associated hepatocarcinogenesis based on a single injection of DEN at 2 weeks of age and the subsequent induction of steatohepatitis by the administration of a CDAA diet for 25 weeks. (B and C) H&E staining was performed on paraffin-embedded HCC tumor masses from WT mice (n = 9) or from hHIF-2α–/– (n = 6). Original magnification is indicated. Alb, albumin.
Figure 2
Figure 2
Validation of the DEN–CDAA hepatocyte-specific deletion of HIF-2α murine model. (A) Western blot analysis of HIF-2α performed in healthy liver of 8 WT mice fed with the choline-sufficient control diet (WT CSAA) or in HCC tumor masses from 5 WT mice treated with the DEN–CDAA protocol (WT DEN-CDAA). HIF-2α expression analyzed by (B) Q-PCR or (C) Western blot analysis in HCC tumor masses from 9 WT mice or from 6 hHIF-2α–/–. Q-PCR analysis of (D) CXCR4 and (E) EPO transcripts performed in WT or in hHIF-2α–/–. The mRNA values are expressed as fold increase over control values after normalization to the TATA box binding protein gene expression. Results are expressed as means ± SD. Boxes include the values within the 25th and 75th percentiles, whereas the horizontal bars represent the medians. The extremities of the vertical bars (10th–90th percentile) comprise 80% of the values. (B, D, and E) Statistical differences were assessed by the Student t test or Mann–Whitney test for nonparametric values. For the Western blot analysis, Bio-Rad (Hercules, CA) Quantity One software was used to perform the densitometric analysis. Equal loading was evaluated by reprobing membranes for Vinculin or β-actin. (A and C) Statistical differences were assessed by the Student t test or the Mann–Whitney test for nonparametric values.
Figure 3
Figure 3
Hepatocyte-specific deletion of HIF-2α does not affect HIF-1α expression. Liver expression of HIF-1α evaluated by (A) Q-PCR and (B) immunohistochemical analysis in HCCs from 9 WT or from 6 hHIF-2α–/–. Original magnification is indicated. (C) Gene expression of vascular endothelial growth factor (VEGF), FLK1, and vascular endothelialcadherin evaluated by Q-PCR in HCC tumor masses from 9 WT mice or from 6 hHIF-2α–/– mice (C). The mRNA values are expressed as the fold increase over control values after normalization to the TATA box binding protein gene expression. Results are expressed as means ± SD. Boxes include the values within the 25th and 75th percentiles, whereas the horizontal bars represent the medians. The extremities of the vertical bars (10th–90th percentile) comprise 80% of the values. Statistical differences were assessed by the Student t test or the Mann–Whitney test for nonparametric values. (D) WB analysis of cd105 protein levels in HCCs from 7 WT mice or from 5 hHIF-2α–/– mice. For the Western blot analysis, Bio-Rad Quantity One software was used to perform the densitometric analysis. Equal loading was evaluated by reprobing membranes for β-actin. Statistical differences were assessed by the Student t test or the Mann–Whitney test for nonparametric values.
Figure 4
Figure 4
Hepatocyte-specific deletion of HIF-2α significantly affects the development of experimental liver tumors. (A and B) Reduction in number and neoplastic mass measured in HCC tumors (indicated by arrows) from 9 WT mice or 6 hHIF-2α–/–. Results are expressed as means ± SD. Boxes include the values within the 25th and 75th percentiles, whereas the horizontal bars represent the medians. The extremities of the vertical bars (10th–90th percentile) comprise 80% of the values. (B) Statistical differences were assessed by the Student t test.
Figure 5
Figure 5
Hepatocyte-specific deletion of HIF-2α significantly affects liver fibrosis. Liver fibrosis was evaluated morphologically in HCC tumor masses from 9 WT mice or from 6 hHIF-2α–/– mice, by (A) IHC analysis of α-SMA and by (D) Sirius Red staining. ImageJ software analysis was performed to evaluate the amount of fibrosis. Data in graphs are expressed as means ± SEM. Statistical differences were assessed by the Student t test or the Mann–Whitney test for nonparametric values. (A and D) Original magnification is indicated. Q-PCR analysis of (B) α-SMA and (C) matrix metalloprotease 9 transcripts performed in HCC tumor masses from 9 WT mice or from 6 hHIF-2α–/– mice. The mRNA values are expressed as the fold increase over control values after normalization to the TATA box binding protein gene expression. Results are expressed as means ± SD. Boxes include the values within the 25th and 75th percentiles, whereas the horizontal bars represent the medians. The extremities of the vertical bars (10th–90th percentile) comprise 80% of the values. (B and C) Statistical differences were assessed by the Student t test or the Mann–Whitney test for nonparametric values.
Figure 6
Figure 6
Hepatocyte-specific deletion of HIF-2α significantly affects the inflammatory response. (A) IHC analysis of F4/80 performed on paraffin-embedded HCC tumor masses from 9 WT mice or from 6 hHIF-2α–/– mice (A). ImageJ software analysis was performed to evaluate the amount of F4-/80-positive areas. Data in graphs are expressed as means ± SEM. Statistical differences were assessed by the Student t test or the Mann–Whitney test for nonparametric values. Original magnification is indicated. (B–D) Q-PCR analysis of (B) F4/80, (C) programmed death-ligand 1, (D) IRF-4 transcripts performed in HCCs from 9 WT mice or from 6 hHIF-2α–/– mice. The mRNA values are expressed as the fold increase over control values after normalization to the TATA box binding protein gene expression. Results are expressed as means ± SD. Boxes include the values within the 25th and 75th percentile, whereas horizontal bars represent the medians. The extremities of the vertical bars (10th–90th percentiles) comprise 80% of the values. Statistical differences were assessed by the Student t test or the Mann–Whitney test for nonparametric values.
Figure 7
Figure 7
HIF-2α expression positively correlates with markers of HCC proliferative capacity. (A and C) qPCR analysis of (A) PCNA and (C) Ki67 transcripts performed in peritumoral tissue or HCC tumor masses from 9 WT mice or from 6 hHIF-2α–/– mice. The mRNA values are expressed as fold increase over control values after normalization to the TATA box binding protein gene expression. Results are expressed as means ± SD. Boxes include the values within the 25th and 75th percentiles, whereas the horizontal bars represent the medians. The extremities of the vertical bars (10th–90th percentiles) comprise 80% of the values. Statistical differences were assessed by a 1-way analysis of variance test with the Tukey correction for multiple comparisons or the Student t test. (B and D) Relationship between HIF-2α and (B) PCNA or (D) Ki67 mRNA in HCCs from 9 WT mice. The values represent the relative mRNA content. The correlation analysis was performed with the Pearson r test.
Figure 8
Figure 8
Hepatocyte-specific HIF-2α deletion impact on HCC proliferative capacity. (A) IHC analysis of PCNA performed on paraffin-embedded HCC tumor masses from 9 WT mice or from 6 hHIF-2α–/– mice (A). ImageJ software analysis was performed to evaluate the number of PCNA-positive nuclei per microscopic field. Data in graphs are expressed as means ± SEM. Statistical differences were assessed by the Student t test. Original magnification is indicated. (B) qPCR analysis of CCNE1 and CCNE2 transcripts performed in HCCs from 9 WT mice or from 6 hHIF-2α–/– mice. The mRNA values are expressed as the fold increase over control values after normalization to the TATA box binding protein gene expression. Results are expressed as means ± SD. Boxes include the values within the 25th and 75th percentiles, whereas the horizontal bars represent the medians. The extremities of the vertical bars (10th–90th percentiles) comprise 80% of the values. Statistical differences were assessed by the Student t test or the Mann–Whitney test for nonparametric values.
Figure 9
Figure 9
Hepatocyte-specific HIF-2α deletion impact on HCC proliferative capacity. (A–C and F) WB analysis for (A) PCNA, (B) p21, (C) p53, and (F) c-Myc performed in HCCs from 6 WT mice or from 5 hHIF-2α–/– mice. Bio-Rad Quantity One software was used to perform the densitometric analysis (data are expressed as the fold change relative to the normalized WT expression). Equal loading was evaluated by reprobing membranes for β-actin. Statistical differences were assessed by the Student t test or the Mann–Whitney test for nonparametric values. (D) Relationship between HIF-2α and c-Myc mRNA in HCCs from 9 WT mice. The values represent the relative mRNA content. The correlation analysis was performed with the Pearson r test. (E) Q-PCR analysis of the c-MYC transcript performed in HCCs from 9 WT mice or from 6 hHIF-2α–/– mice. The mRNA values are expressed as the fold increase over control values after normalization to the TATA box binding protein gene expression. Results are expressed as means ± SD. Boxes include the values within the 25th and 75th percentiles, whereas the horizontal bars represent the medians. The extremities of the vertical bars (10th–90th percentiles) comprise 80% of the values. Statistical differences were assessed by the Student t test or the Mann–Whitney test for nonparametric values.
Figure 10
Figure 10
Hepatocyte-specific HIF-2α deletion affects HCC proliferative capacity without the involvement of the ERK, JNK, and AKT signal pathways. Western blot analysis of (A) P-AKT, (B) phospho-ERK (extracellular regulated kinase), and (C) phospho-JNK (c-Jun-aminoterminal kinase) in HCC tumor masses from 9 WT mice or from 6 hHIF-2α–/– mice. Bio-Rad Quantity One software was used to perform the densitometric analysis. Equal loading was evaluated by reprobing membranes for the relative nonphosphorylated protein AKT, ERK, JNK, and β-actin or vinculin. Results are expressed as means ± SD. Boxes include the values within the 25th and 75th percentiles, whereas horizontal bars represent the medians. The extremities of the vertical bars (10th–90th percentiles) comprise 80% of the values. Statistical differences were assessed by the Student t test or the Mann–Whitney test for nonparametric values.
Figure 11
Figure 11
HIF-2α overexpression supports HepG2 cell growth in vitro. (A) Western blot analysis of HIF-2α, c-Myc, PCNA, p53, and p21 levels performed on HepG2 stably transfected to overexpress HIF-2α (H/2α) or in control HepG2 cells transfected with empty vector (H/V6) at different time points. Equal loading was evaluated by reprobing membranes for β-actin. Bio-Rad Quantity One software was use to perform the densitometric analysis (data are expressed as the fold change relative to the normalized H/V6 expression). (B) Q-PCR analysis of CXCR4 and EPO transcripts in H/2α or in H/V6 cells at different time points. Data in graphs are expressed as means ± SEM. Statistical differences were assessed by 1-way analysis of variance test with the Tukey correction for multiple comparisons or the Kruskal–Wallis test for nonparametric values. (C–E) Cell count was performed with the (C) bromodeoxyuridine (BrdU) incorporation assay, (D) Burker chamber, and (E) crystal violet techniques performed on H/2α or H/V6 at different time points. (F) Bar graph chart shows the relative quantity of the G1, G2, and S ratio in H/2α cells compared with the H/V6 control cells as means ± SD, resulting from cell-cycle analysis by flow cytometry with FCS Express 4 Flow Research Edition software. These experiments were repeated 3 separate times, and similar results were obtained.
Figure 12
Figure 12
Expression of HIF-2α in human NAFLD/NASH-related HCC patients. (A) IHC analysis of HIF-2α was performed on paraffin-embedded human liver specimens from NAFLD/NASH-related HCC patients (n = 27; grades G2–G3). Original magnification is indicated. HIF-2α expression was semiquantitatively scored blinded by a pathologist. (B) The odds ratio (OR) meta-analysis was calculated by the Fisher exact test to evaluate the strength of the association between HIF-2α expression and the HCC cirrhotic setting. (C and D) Kaplan–Meier curves of (C) survival and (D) time to recurrence according to HIF-2α expression. Statistical analysis was performed using the log-rank (Mantel–Cox) test.
Figure 13
Figure 13
SB3 expression correlates with HIF-2α expression in NAFLD/NASH-related HCC patients. (A) IHC analysis of HIF-2α (left) or SB3 (right) performed on paraffin-embedded human liver specimens from NAFLD/NASH-related HCC patients (n = 27; grades G2–G3). Original magnification is indicated. SB3 expression was semiquantitatively scored blinded by a pathologist (Mann–Whitney U test). (B) Relationship between HIF-2α and SB3 mRNA in HCC tumor masses from 9 WT mice. The values represent the relative mRNA content. The correlation analysis was performed with the Pearson r test. (C) qPCR and (D) Western blot analysis for SB3 performed in HCC tumor masses from 9 WT mice or from 6 hHIF-2α–/– mice. (D) For the Western blot analysis, Bio-Rad Quantity One software was used to perform the densitometric analysis. Equal loading was evaluated by reprobing membranes for β-actin. Statistical differences were assessed by the Student t test or the Mann–Whitney test for nonparametric values. The mRNA values are expressed as the fold increase over control values after normalization to the TATA box binding protein gene expression. Results are expressed as means ± SD. Boxes include the values within the 25th and 75th percentiles, whereas the horizontal bars represent the medians. The extremities of the vertical bars (10th–90th percentiles) comprise 80% of the values. (C) Statistical differences were assessed by the Student t test or the Mann–Whitney test for nonparametric values.
Figure 14
Figure 14
HIF-2α expression directly correlates with YAP. (A) Relationship between HIF-2α and YAP mRNA in HCCs from 9 WT mice. The values represent the relative mRNA content. The correlation analysis was performed with the Pearson r test. (B) Western blot analysis for YAP performed in HCCs from 9 WT mice or from 6 hHIF-2α–/– mice. For the Western blot analysis, Bio-Rad Quantity One software was used to perform the densitometric analysis. Equal loading was evaluated by reprobing membranes for β-actin. Statistical differences were assessed by the Student t test or the Mann–Whitney test for nonparametric values. (C) Western blot analysis of YAP protein levels performed on HepG2 stably transfected to overexpress HIF-2α (H/2α) or in control HepG2 cells transfected with empty vector (H/V6) at different time points. Equal loading was evaluated by reprobing membranes for vinculin. (C and D) Western blot analysis of YAP and c-Myc protein levels performed on H/2α or in control H/V6, treated or not (scramble) with a specific YAP siRNA (siYAP). Equal loading was evaluated by reprobing membranes for β-actin. Bio-Rad Quantity One software was used to perform the densitometric analysis (data are expressed as the fold change relative to the normalized H/V6 expression).

Comment in

  • HIF2α Activation in NASH: A New Force Pushing Toward HCC.
    Clavería-Cabello A, Avila MA. Clavería-Cabello A, et al. Cell Mol Gastroenterol Hepatol. 2022;13(2):678-680. doi: 10.1016/j.jcmgh.2021.11.005. Epub 2021 Nov 27. Cell Mol Gastroenterol Hepatol. 2022. PMID: 34848185 Free PMC article. No abstract available.

References

    1. Younossi Z., Tacke F., Arrese M., Chander Sharma B., Mostafa I., Bugianesi E., Wong V.W.-S., Yilmaz Y., George J., Fan J., Vos M. Global perspectives on nonalcoholic fatty liver disease and nonalcoholic steatohepatitis. Hepatology. 2019;69:2672–2682. - PubMed
    1. McPherson S., Hardy T., Henderson E., Burt A.D., Day C.P., Anstee Q.M. Evidence of NAFLD progression from steatosis to fibrosing-steatohepatitis using paired biopsies: implications for prognosis and clinical management. J Hepatol. 2015;62:1148–1155. - PubMed
    1. Younossi Z.M., Golabi P., de Avila L., Minhui Paik J., Srishord M., Fukui N., Qiu Y., Burns L., Afendy A., Nader F. The global epidemiology of NAFLD and NASH in patients with type 2 diabetes: a systematic review and meta-analysis. J Hepatol. 2019;71:793–801. - PubMed
    1. Torres D.M., Harrison S.A. Nonalcoholic steatohepatitis and noncirrhotic hepatocellular carcinoma: fertile soil. Semin Liver Dis. 2012;32:30–38. - PubMed
    1. Younes R., Bugianesi E. Should we undertake surveillance for HCC in patients with NAFLD? J Hepatol. 2018;68:326–334. - PubMed

Publication types

MeSH terms

Substances