. 2021 Oct 16;22(1):501.
doi: 10.1186/s12859-021-04423-x.

ClineHelpR: an R package for genomic cline outlier detection and visualization

Affiliations

ClineHelpR: an R package for genomic cline outlier detection and visualization

Bradley T Martin et al. BMC Bioinformatics. .

Abstract

Background: Patterns of multi-locus differentiation (i.e., genomic clines) often extend broadly across hybrid zones and their quantification can help diagnose how species boundaries are shaped by adaptive processes, both intrinsic and extrinsic. In this sense, the transitioning of loci across admixed individuals can be contrasted as a function of the genome-wide trend, in turn allowing an expansion of clinal theory across a much wider array of biodiversity. However, computational tools that serve to interpret and consequently visualize 'genomic clines' are limited, and users must often write custom, relatively complex code to do so.

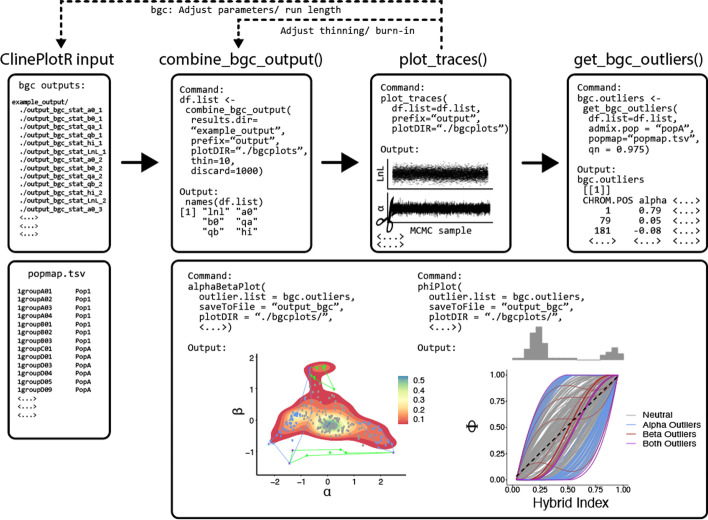
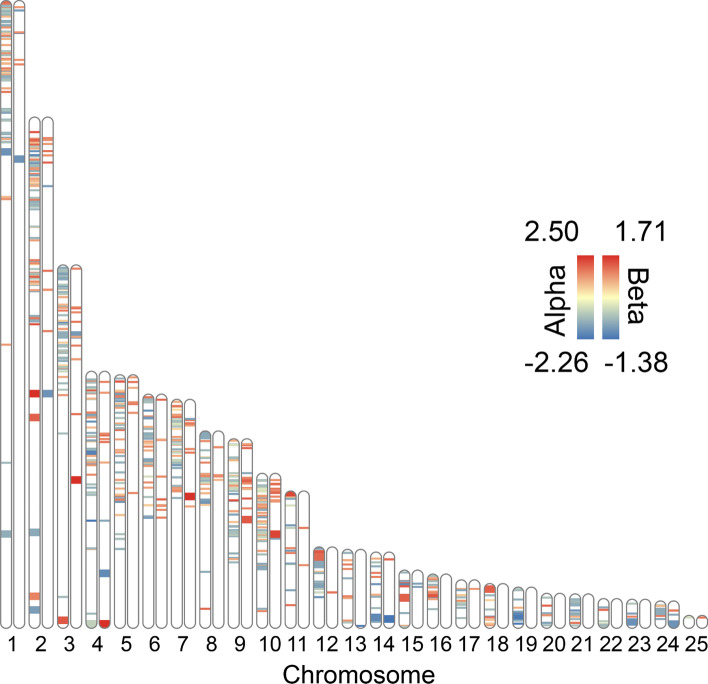
Results: Here, we introduce the ClineHelpR R-package for visualizing genomic clines and detecting outlier loci using output generated by two popular software packages, bgc and Introgress. ClineHelpR bundles both input generation (i.e., filtering datasets and creating specialized file formats) and output processing (e.g., MCMC thinning and burn-in) with functions that directly facilitate interpretation and hypothesis testing. Tools are also provided for post-hoc analyses that interface with external packages such as ENMeval and RIdeogram.

Conclusions: Our package increases the reproducibility and accessibility of genomic cline methods, thus allowing an expanded user base and promoting these methods as mechanisms to address diverse evolutionary questions in both model and non-model organisms. Furthermore, the ClineHelpR extended functionality can evaluate genomic clines in the context of spatial and environmental features, allowing users to explore underlying processes potentially contributing to the observed patterns and helping facilitate effective conservation management strategies.

Keywords: Genomic cline; Hybrid zones; Introgression; Outlier detection; Population genetics; Selection; bgc.


Conflict of interest statement

The authors declare that they have no competing interests.

Figures

Fig. 1
Fig. 1
Simplified example workflow listing all available ClineHelpR functions. Yellow boxes group inter-dependent functions working towards producing one or two particular plots (terminal plotting steps depicted as flags). Connecting arrows indicate a pipeline where each step is dependent on the returned R objects. The green ‘Run BGC’ diamond identifies bgc as an external a priori step for the bgcPlotter and chromosome plot functions. The dotted lines indicate optional steps
Fig. 2
Fig. 2
Example workflow for parsing Bayesian genomic cline (bgc) output, visualizing MCMC traces, detecting outliers, and plotting results. The ‘phiPlot’ (right-side, lower right box) shows hybrid indices (x-axis) and probability of parental population1 alleles (y-axis), plus a histogram of hybrid indices in the admixed population. The ‘alphaBetaPlot’ (left-side, lower right box) shows 2D density of cline width/rate representing the cline center (i.e., bias in SNP ancestry; α; x-axis) and steepness of clines (ß; y-axis). Outliers are additionally encapsulated using polygon hulls
Fig. 3
Fig. 3
Example ideogram plot using Bayesian genomic cline (bgc) outliers for Terrapene ddRAD SNPs (y-axis), plotted onto Trachemys scripta chromosomes (x-axis). Chromosomes are duplicated, with alternative heatmaps for cline center (α; left) and rate (ß; right). Larger heatmap bands correspond to SNPs located within known genes, whereas smaller bands were found in unknown scaffolds
Fig. 4
Fig. 4
Example plots that can be made using the Introgress pipeline in ClineHelpR. The included climatic variable on the X-axis corresponds to BioClim raster layer 5 (https://worldclim.org). The gray shading indicates confidence intervals for each regression line. A Genomic clines for six outlier SNPs mapped to the Terrapene mexicana triunguis transcriptome. Transcript IDs correspond to GenBank accession numbers and the position of each SNP (in base pairs) on the locus. B Hybrid index output from Introgress versus an environmental variable

References

    1. Barton NH. Multilocus clines. Evolution (N Y) 1983;37:454–471. - PubMed
    1. Gompert Z, Mandeville EG, Buerkle CA. Analysis of population genomic data from hybrid zones. Annu Rev Ecol Evol Syst. 2017;48:207–229. doi: 10.1146/annurev-ecolsys-110316-022652. - DOI
    1. Martin BT, Douglas MR, Chafin TK, Placyk JS, Birkhead RD, Phillips CA, et al. Contrasting signatures of introgression in North American box turtle (Terrapene spp.) contact zones. Mol Ecol. 2020;29:4186–4202. doi: 10.1111/mec.15622. - DOI - PubMed
    1. Buerkle CA, Lexer C. Admixture as the basis for genetic mapping. Trends Ecol Evol. 2008;23:686–694. doi: 10.1016/j.tree.2008.07.008. - DOI - PubMed
    1. Chafin TK, Douglas MR, Martin BT, Douglas ME. Hybridization drives genetic erosion in sympatric desert fishes of western North America. Heredity (Edinb) 2019;123:759–773. doi: 10.1038/s41437-019-0259-2. - DOI - PMC - PubMed

LinkOut - more resources