. 2021 Oct 16;18(1):237.
doi: 10.1186/s12974-021-02277-x.

A novel phosphoproteomic landscape evoked in response to type I interferon in the brain and in glial cells

Affiliations

A novel phosphoproteomic landscape evoked in response to type I interferon in the brain and in glial cells

Barney Viengkhou et al. J Neuroinflammation. .

Abstract

Background: Type I interferons (IFN-I) are key responders to central nervous system infection and injury and are also increased in common neurodegenerative diseases. Their effects are primarily mediated via transcriptional regulation of several hundred interferon-regulated genes. In addition, IFN-I activate several kinases including members of the MAPK and PI3K families. Yet, how changes to the global protein phosphoproteome contribute to the cellular response to IFN-I is unknown.

Methods: The cerebral phosphoproteome of mice with brain-targeted chronic production of the IFN-I, IFN-α, was obtained. Changes in phosphorylation were analyzed by ontology and pathway analysis and kinase enrichment predictions. These were verified by phenotypic analysis, immunohistochemistry and immunoblots. In addition, primary murine microglia and astrocytes, the brain's primary IFN-I-responding cells, were acutely treated with IFN-α and the global phosphoproteome was similarly analyzed.

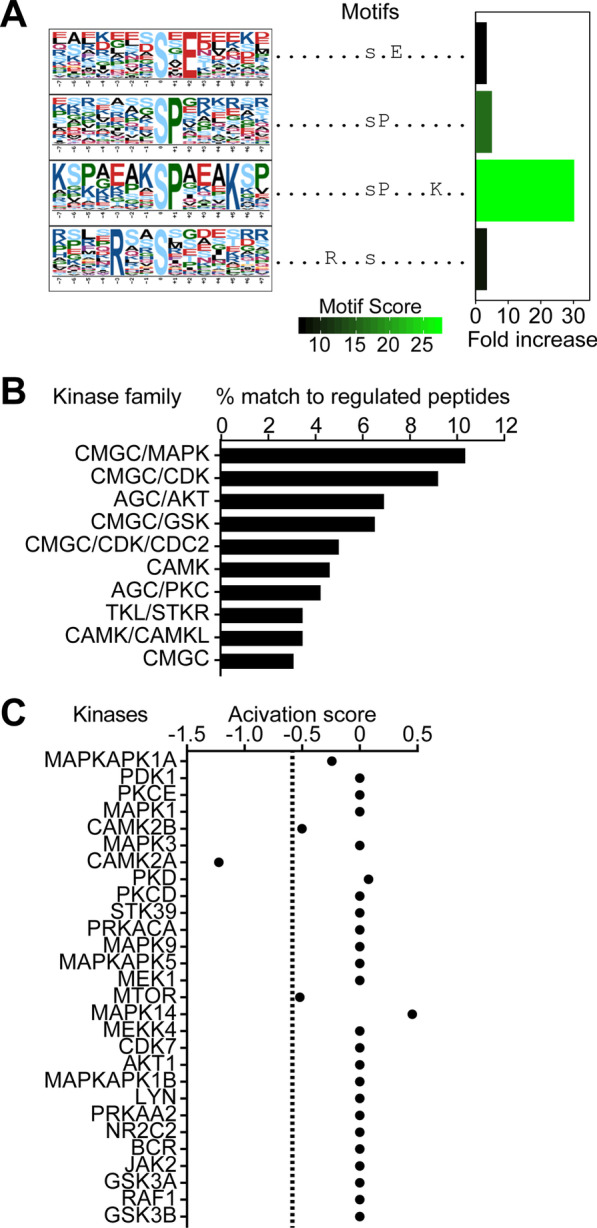
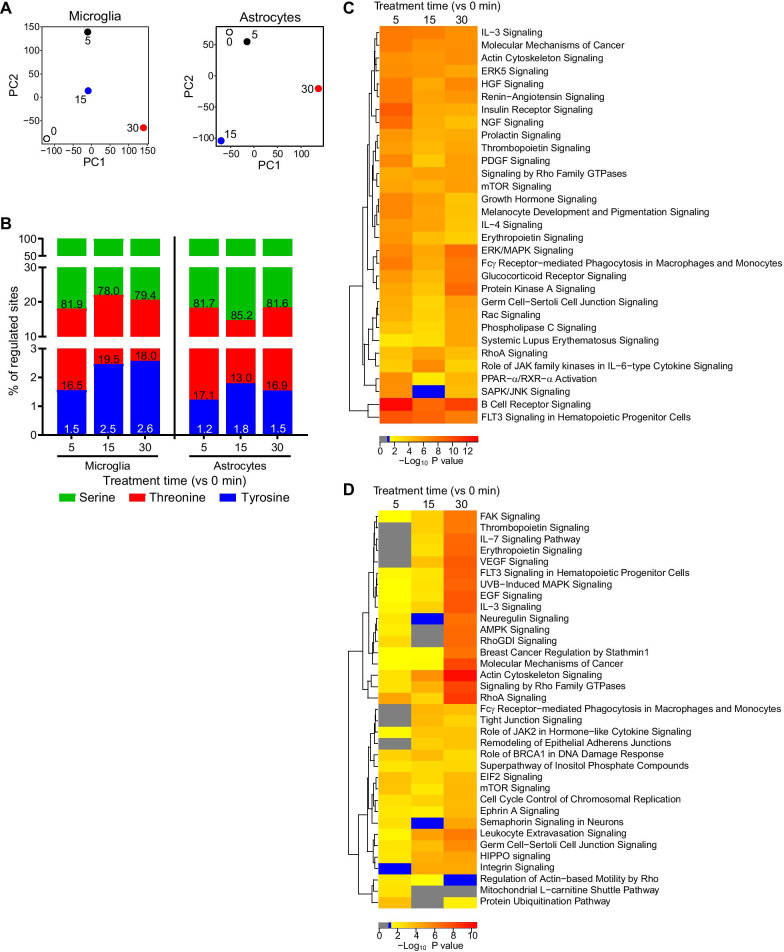
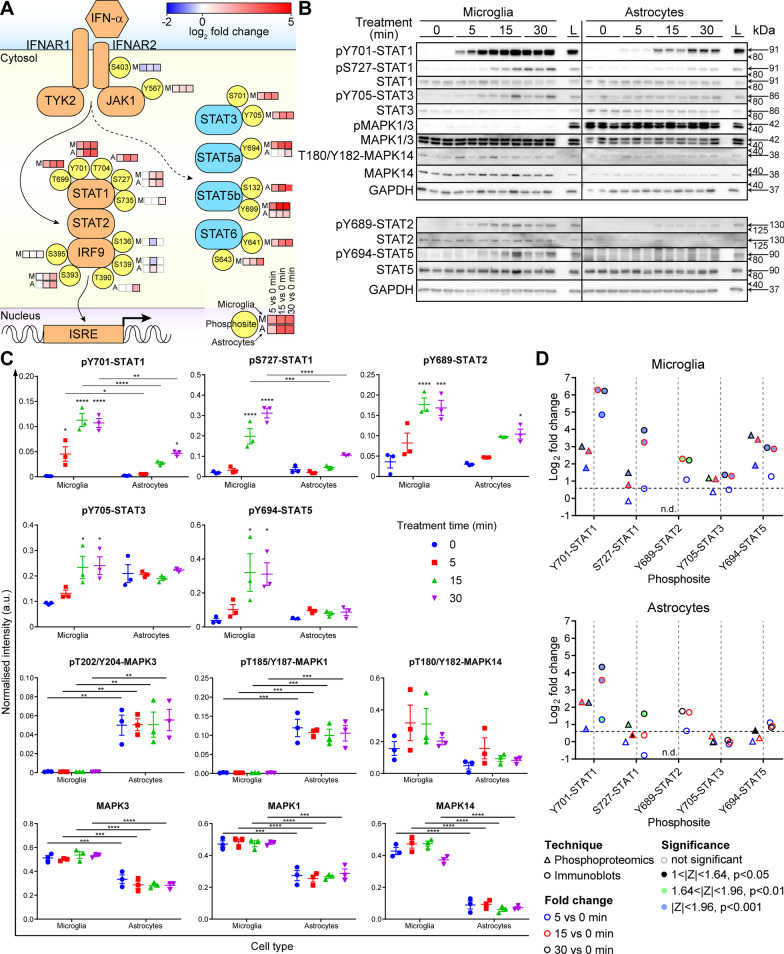
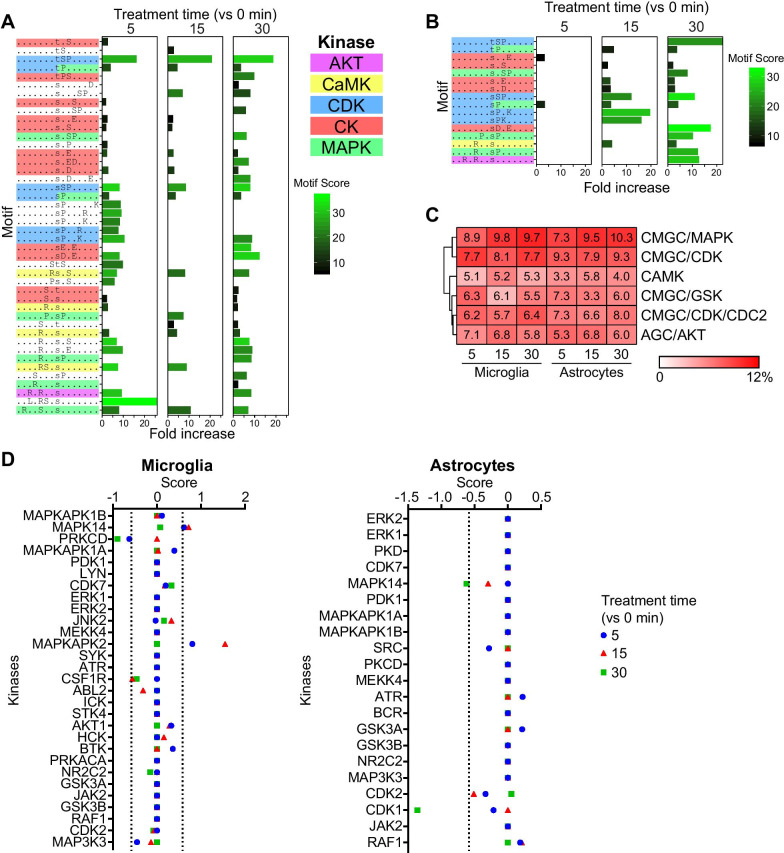
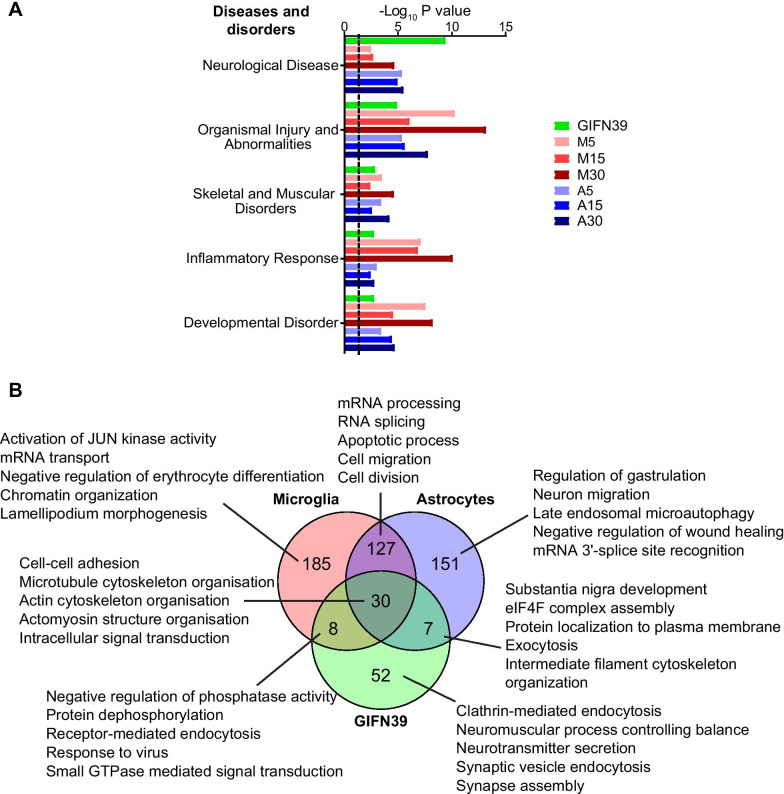
Results: We identified widespread protein phosphorylation as a novel mechanism by which IFN-I mediate their effects. In our mouse model for IFN-I-induced neurodegeneration, protein phosphorylation, rather than the proteome, aligned with the clinical hallmarks and pathological outcome, including impaired development, motor dysfunction and seizures. In vitro experiments revealed extensive and rapid IFN-I-induced protein phosphorylation in microglia and astrocytes. Response to acute IFN-I stimulation was independent of gene expression and mediated by a small number of kinase families. The changes in the phosphoproteome affected a diverse range of cellular processes and functional analysis suggested that this response induced an immediate reactive state and prepared cells for subsequent transcriptional responses.

Conclusions: Our studies reveal a hitherto unappreciated role for changes in the protein phosphorylation landscape in cellular responses to IFN-I and thus provide insights for novel diagnostic and therapeutic strategies for neurological diseases caused by IFN-I.

Keywords: Astrocyte; Cerebral type I interferonopathy; Interferon; Microglia; Neurodegenerative disease; Phosphoproteomics.


Conflict of interest statement

The authors declare that they have no competing interests.

Figures

Fig. 1
Fig. 1
Regulated protein in the cerebellum of GIFN39 mice are characteristic of an interferon-induced immune response. A Distribution of protein abundances (nonphosphopeptides; blue: reduced and red: increased; number of significantly altered proteins is indicated at the top) in GIFN39 vs WT cerebella and their relative abundance estimated by NSAF (grey: protein abundance below threshold). Data of cerebella from WT (n = 4) and GIFN39 (n = 4) mice were analyzed from two runs with n = 2 per genotype in each. B Top 20 pathways associated with the regulated proteins in the cerebellum of GIFN39 mice compared with WT mice, determined by IPA. The dashed line: P = 0.05
Fig. 2
Fig. 2
Phosphoproteome in the cerebellum of GIFN39 mice is highly regulated. A Several hundred sites had increased (red) or reduced (blue) phosphorylation in the cerebellum of GIFN39 mice compared with WT mice. Total number of detected phosphosites (bottom) and significantly regulated phosphosites (top) are indicated. Phosphosite abundance indicated by PSMs. B Comparison between significant biological processes, determined by DAVID, associated with increased or decreased phosphorylation with C the top processes shown. Dotted line: P = 0.05
Fig. 3
Fig. 3
Predicted diseases from the CNS-phosphoproteome of GIFN39 mice and associated clinical and pathology outcomes. A Activation state of diseases and disordered enriched from the regulated phosphoproteome of GIFN39 mice. Positive score (red) indicates increased activity and negative score (blue) indicates decreased activity of the clinical and pathological signs of disease. B Progressive reduction in survival of GIFN39 mice (total n = 317) compared to WT littermates (total n = 376), P < 0.001 by log-rank test. Data presented as mean ± 95% confidence interval (shaded). C Body weight, D length of mice from nose to tail base and E wet brain weight was reduced in male GIFN39 mice compared with WT mice and with age (n = 413 per genotype per age). Data presented with mean ± SEM. * P < 0.05, ** P < 0.01 and **** P < 0.0001 between indicated samples as determined by two-way ANOVA with Tukey’s post-test. n.s.: not significant. Neuropathology was investigated in the cerebellum of 8 and > 16-week-old GIFN39 mice and WT littermates. (F) Dual Iba1 (brown/black) and Alizarin Red S (ARS; red; indicated by arrowheads) stain for microglia and calcium deposits. (G) GFAP stain for astrocytes. (H) CD3 stain for T cells, indicated by arrowheads. (I) Neurofilament stain to reveal neurons. (J) Cleaved caspase-3 stain for apoptotic cells indicated by black arrowheads. Red arrowhead indicates an aneurysm. Representative immunohistochemical and histological stains of cerebella of WT and GIFN39 of 8-week-old and 16-week-old mice (n = 4 mice per genotype per age). ML: molecular layer, GCL: granule cell layer and WM: white matter
Fig. 4
Fig. 4
Few kinase families regulate the phosphoproteome in GIFN39 mice. A Sequence logos and fold increase of enriched motifs of the upregulated phosphopeptides calculated by motif-X. Kinase family and matched consensus substrate motif: MAPK/CDK (sP and sP…K), CK (s.E) and CaMK (R..s). B Top 10 kinase families predicted based on substrate motif matches and proteinprotein interaction. Percentages of the upregulated phosphopeptides associated with a kinase compared with the total number of phosphopeptides associated with a kinase family are shown. C Kinase activity score of kinases calculated from the abundance, fold change (GIFN39 vs WT) and role, extracted from PhosphoSitePlus, of each phosphosite on the kinase. Dashed line: threshold score equivalent to a 1.5-fold reduced activity
Fig. 5
Fig. 5
IFN-α extensively modulates phosphorylation profiles of microglia and astrocytes in a cell-type-specific manner. A PCA of untreated and IFN-α-treated microglia and astrocytes indicate distinct phosphorylation changes with treatment times (indicated by the number adjacent to each point). B Percentage of regulated phospho-serine, -threonine and -tyrosine residues in treated microglia and astrocytes compared with untreated cells. Numbers indicate percentages. Hierarchically clustered heatmap of the top 15 significant canonical pathways at each timepoint (vs 0 min) in C microglia and D astrocytes determined by IPA. Grey: non-enriched, blue: non-significantly enriched and yellow to red bars are significantly enriched pathways
Fig. 6
Fig. 6
IFN-α induces cell type-specific phosphorylation of JAK/STAT pathway components in treated microglia and astrocytes. A IFN-α-associated JAK/STAT signaling pathway depicting phosphosites and their log2 fold change at 5, 15 and 30 min compared with 0 min. Phosphosites were included if they were significantly regulated at one timepoint. Grey boxes: did not reach significance. B Immunoblot of whole protein lysates from IFN-α-treated microglia and astrocytes (n = 3 per cell type per timepoint). Sample “L” was a cross-membrane loading control of a pooled protein from all 30 min IFN-α-treated microglia and astrocyte samples. C Densitometric quantifications of immunoblots. Mean ± SEM are shown. * P < 0.05, ** P < 0.01, *** P < 0.001 and **** P < 0.0001 compared to the respective 0 min of the cell type or between indicated samples as determined by two-way ANOVA with Tukey’s post-test. D Similar trends in fold change between phosphoproteomics and immunoblots. Fold changes calculated from immunoblots are based on the mean intensities at 0 min of treatment and significance determined by two-way ANOVA with Tukey’s post-test. Significance set at |z-score|≥ 1 for phosphoproteomics and P < 0.05 for immunoblots. Dashed horizontal line indicates log2 of a 1.5-fold change. n.d.: not detected
Fig. 7
Fig. 7
Only few predicted kinase families drive IFN-α-induced phosphorylation in both microglia and astrocytes. Fold enrichment of motifs extracted from phosphopeptides with increased phosphorylation using motif-X in A microglia and B astrocytes. Kinase families were predicted by matching the enriched motif with their consensus substrate motif and are color coded. C Top kinase families from treated microglia and astrocytes based on substrate motif matches and proteinprotein interaction. Percentages of the upregulated phosphopeptides associated with a kinase compared with the total number of phosphopeptides associated with a kinase family per treatment and cell type are shown. D IFN-α-regulated activity score of kinases calculated from the abundance, fold change and role, extracted from PhosphoSitePlus, of each phosphosite on the kinase. Dashed line: threshold score equivalent to a 1.5-fold change in activity
Fig. 8
Fig. 8
Contribution of acute IFN-α signaling to the regulated cerebellar phosphoproteome in GIFN39 mice. A Top five enriched diseases and disorders categories determined by IPA between the regulated phosphosites of the GIFN39 cerebellum and IFN-α-treated microglia (“M”) and astrocytes (“A”). Treatment times indicated next to the cell type. Dotted lines: P = 0.05. B Comparison of the biological processes from GIFN39 cerebellum and IFN-α-treated microglia and astrocytes as determined by DAVID. Shown are total number of significant biological processes with the top five biological processes of each segment being listed

Similar articles

Cited by

References

    1. Paul S, Ricour C, Sommereyns C, Sorgeloos F, Michiels T. Type I interferon response in the central nervous system. Biochimie. 2007;89(6–7):770–778. doi: 10.1016/j.biochi.2007.02.009. - DOI - PubMed
    1. Baruch K, Deczkowska A, David E, Castellano JM, Miller O, Kertser A, et al. Aging. Aging-induced type I interferon response at the choroid plexus negatively affects brain function. Science. 2014; 346(6205): 89–93. Doi: 10.1126/science.1252945 - PMC - PubMed
    1. Roy ER, Wang B, Wan YW, Chiu G, Cole A, Yin Z, et al. Type I interferon response drives neuroinflammation and synapse loss in Alzheimer disease. J Clin Investig. 2020;130(4):1912–1930. doi: 10.1172/jci133737. - DOI - PMC - PubMed
    1. Taylor JM, Minter MR, Newman AG, Zhang M, Adlard PA, Crack PJ. Type-1 interferon signaling mediates neuro-inflammatory events in models of Alzheimer's disease. Neurobiol Aging. 2014;35(5):1012–1023. doi: 10.1016/j.neurobiolaging.2013.10.089. - DOI - PubMed
    1. Crow YJ. Type I interferonopathies: mendelian type I interferon up-regulation. Curr Opin Immunol. 2015;32:7–12. doi: 10.1016/j.coi.2014.10.005. - DOI - PubMed

LinkOut - more resources