. 2021 Oct 16;12(11):953.
doi: 10.1038/s41419-021-04242-1.

Cofilin1 oxidation links oxidative distress to mitochondrial demise and neuronal cell death

Affiliations

Cofilin1 oxidation links oxidative distress to mitochondrial demise and neuronal cell death

Lena Hoffmann et al. Cell Death Dis. .

Abstract

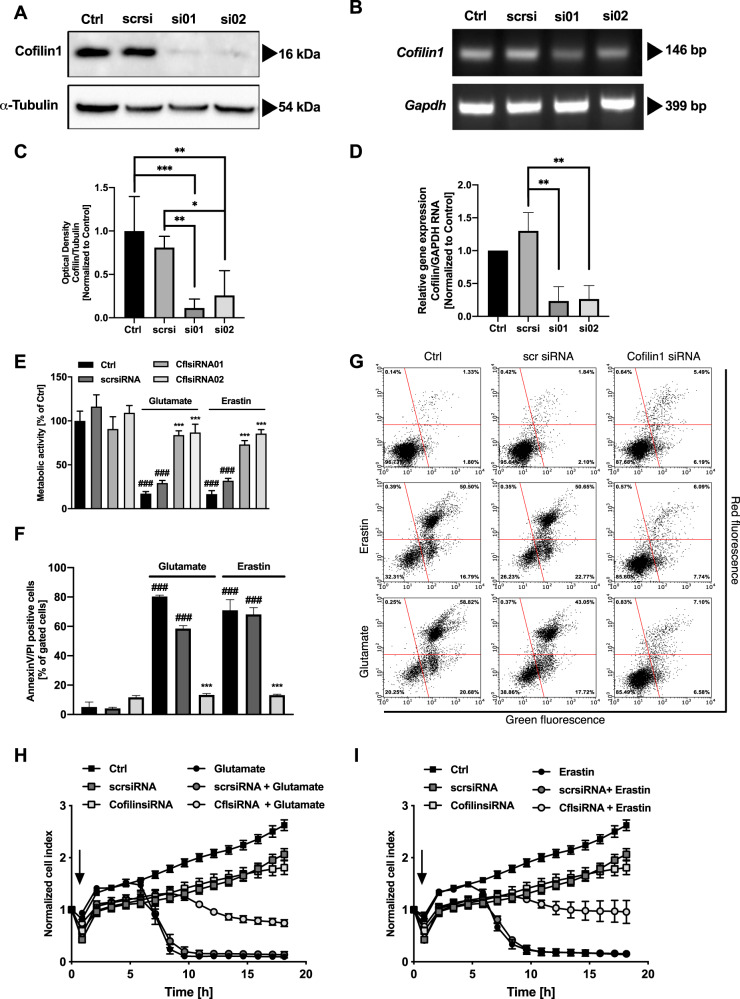
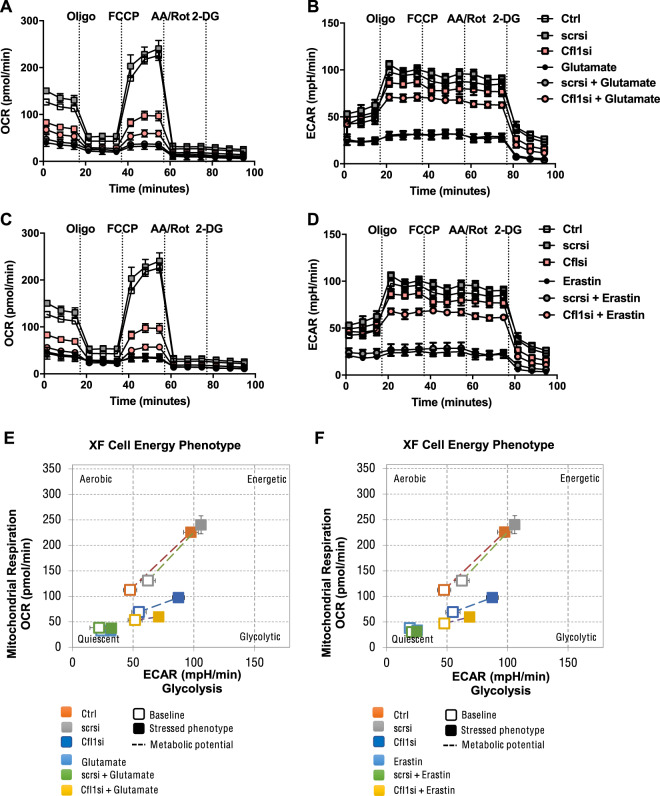
Many cell death pathways, including apoptosis, regulated necrosis, and ferroptosis, are relevant for neuronal cell death and share common mechanisms such as the formation of reactive oxygen species (ROS) and mitochondrial damage. Here, we present the role of the actin-regulating protein cofilin1 in regulating mitochondrial pathways in oxidative neuronal death. Cofilin1 deletion in neuronal HT22 cells exerted increased mitochondrial resilience, assessed by quantification of mitochondrial ROS production, mitochondrial membrane potential, and ATP levels. Further, cofilin1-deficient cells met their energy demand through enhanced glycolysis, whereas control cells were metabolically impaired when challenged by ferroptosis. Further, cofilin1 was confirmed as a key player in glutamate-mediated excitotoxicity and associated mitochondrial damage in primary cortical neurons. Using isolated mitochondria and recombinant cofilin1, we provide a further link to toxicity-related mitochondrial impairment mediated by oxidized cofilin1. Our data revealed that the detrimental impact of cofilin1 on mitochondria depends on the oxidation of cysteine residues at positions 139 and 147. Overall, our findings show that cofilin1 acts as a redox sensor in oxidative cell death pathways of ferroptosis, and also promotes glutamate excitotoxicity. Protective effects by cofilin1 inhibition are particularly attributed to preserved mitochondrial integrity and function. Thus, interfering with the oxidation and pathological activation of cofilin1 may offer an effective therapeutic strategy in neurodegenerative diseases.


Conflict of interest statement

The authors declare no competing interests.

Figures

Fig. 1
Fig. 1. Cofilin phosphorylation status is not altered by glutamate or erastin challenge.
AD HT22 cells were treated with 1 µM erastin and the respective amount of DMSO for the indicated time points for Western blot analysis. Six to eight independent blots of phosphorylated cofilin-Ser3 (1:1000) (A) as well as total cofilin1 (1:1000) (C) were normalized to respective vinculin loading controls (1:20,000) and quantified (mean + standard deviation, SD). Respective representative blots are shown for phosphorylated Cofilin-Ser3 (B) and total cofilin1 (D). E The quantification of the activation of cofilin1 in HT22 cells challenged with 1 µM erastin to the indicated time points are evaluated (mean + SD). Ns non-significant to control (one-way ANOVA, Bonferroni’s post hoc test).
Fig. 2
Fig. 2. Cofilin1 depletion reveals sustained protection after glutamate or erastin exposure which occurs independently of lipid peroxidation and ROS accumulation.
HT22 cells were transfected with two specific siRNAs against cofilin1 showing comparable effects. Unspecific scrambled siRNA (scrsi) was used as control. Transfection efficiency was analyzed after 48 h on (A, C) protein and (B, D) mRNA level. Protein levels were determined by western blot using specific antibodies against cofilin1 and α-tubulin as a loading control, shown as mean + SD (n = 4 replicates). ***P < 0.001; **P < 0.01; *P < 0.05 (one-way ANOVA, Bonferroni’s post hoc test). Transfection efficiency was also analyzed on mRNA level by (B) RT-PCR and (D) RT-qPCR. Gapdh was used as an internal control. Bands are cropped at the indicated size for better comprehension with ImageLab software (Bio-Rad, California, USA). D mRNA expression levels of RT-qPCR are shown as mean + SD (n = 3 replicates); **P < 0.01 (one-way ANOVA, Bonferroni’s post hoc test). E Cells were treated with 0.2 µM erastin or 2 mM glutamate for 16 h and were analyzed for proliferation/viability using MTT reagent. Both siRNA sequences conveyed comparable effects, therefore subsequent experiments were performed with siRNA1. Values are shown as mean + SD (n = 8 replicates). F, G Annexin V and PI staining was conducted after 30 h of siRNA incubation and following 16 h of erastin (0.5 µM) or glutamate (2 mM) treatment (mean + SD; 5000 cells per replicate of n = 3 replicates). H, I xCELLigence measurement was performed after siRNA incubation for 30 h. The arrow indicates the time of erastin (0.75 µM) or glutamate (8 mM) application. Data are given as mean ± SD (n = 8 replicates). ###P < 0.001 compared to untreated ctrl; ***P < 0.001 compared to erastin- or glutamate-treated ctrl (ANOVA, Scheffé’s test).
Fig. 3
Fig. 3. Cofilin1 silencing is effectively averting mitochondrial impairment in terms of glutamate or erastin toxicity.
Prior to the described measurement, cofilin1 siRNA was incubated for 30 h. A Lipid peroxidation was determined 9 h after challenging the cells with 0.5 µM erastin or 5 mM glutamate with BODIPY fluorescent dye and subsequent FACS measurement. Data are given as mean + SD; 5000 cells per replicate of n = 3 replicates. B The amount of ROS was measured after 0.8 µM erastin or 7 mM glutamate treatment for 10 h following H2DCF-DA staining and FACS analysis. Data are given as mean + SD; 5000 cells per replicate of n = 3 replicates. C Mitochondrial superoxide accumulation was measured by MitoSOX staining and FACS analysis after 16 h treatment with 0.5 µM erastin or 4 mM glutamate. Data are presented as mean + SD; 5000 cells per replicate of n = 3 replicates. D The mitochondrial membrane potential was evaluated by an appropriate cell-permeant, positively charged TMRE dye and following FACS analysis after treatment for 16 h with 1 µM erastin or 10 mM glutamate. Data are given as mean + SD; 5000 cells per replicate of n = 3 replicates. E Cells were challenged for 8 h with 0.7 µM erastin or 7 mM glutamate. ATP content was measured by luminescence-based measurement. Values are shown as mean + SD (n = 8 replicates. F Rhod-2 acetoxymethyl ester (Rhod-2 AM) was used to specifically measure mitochondrial calcium level after 16-h treatment with 0.8 µM erastin or 8 mM glutamate. Values are displayed as mean + SD; 5000 cells per replicate of n = 3 replicates. Ctrl (control); scrsi (scrambled siRNA); Cfl1si (cofilin1 siRNA), #P < 0.05 and ###P < 0.001 compared to untreated ctrl, *P < 0.05 compared to erastin- or glutamate-treated ctrl, ***P < 0.001 compared to erastin- or glutamate-treated ctrl, ns not significant (ANOVA, Scheffé’s test).
Fig. 4
Fig. 4. Cofilin1-deficient HT22 cells turn their energy production towards glycolysis after glutamate or erastin exposure.
Cofilin1 siRNA was transfected for 48 h. Afterward, cells were damaged for 9 h with 0.5 µM erastin or 7 mM glutamate. A, C Afterward, the oxygen consumption rate (OCR) and B, D the extracellular acidification rate (ECAR) were determined by a Seahorse XFe96 Analyzer. Data of 3–6 replicates per condition are shown as mean ± SD. Oligo (oligomycin); FCCP (carbonyl cyanide 4-(trifluoromethoxy)phenylhydrazone); AA (antimycin A) Rot (rotenone); 2-DG (2-deoxy-d-glucose). Ctrl (untransfected control); scrsi (scrambled siRNA); Cfl1si (cofilin1 siRNA). E, F The cell energy phenotype correlates the OCR and the ECAR of the cells at basal conditions (open dot) measured before the first compound was injected by the system and after FCCP injection, representing a stressed phenotype (filled dot). The displayed metabolic potential (dashed line) represents the capacity to meet the required energy demand under conditions of stress. Ctrl control, scrsi scrambled siRNA, Cfl1si cofilin1 siRNA.
Fig. 5
Fig. 5. Cofilin1 knockout in primary cortical neurons reveals protection against glutamate-induced excitotoxicity.
A, B Western blot analysis was conducted after 30 days in vitro (DIV30) of control (Ctrl) neurons and cofilin1flx/flx, CaMKIIα-Cre neurons (CRE). Protein levels were determined by western blot using specific antibodies against cofilin1 and α-tubulin as a loading control, shown as mean + SEM (n = 3 replicates). Bands are cropped at the indicated size for better comprehension with ImageLab software (Bio-Rad, California, USA). C Metabolic activity of DIV30 Ctrl and cofilin1−/− neurons was determined by MTT assay after glutamate exposure for 24 h. MK801 co-treatment served as a protected control by NMDA-receptor inhibition. Mean values + SD of n = 5 replicates are shown. D OCR of Ctrl and E cofilin1−/− neurons was measured at 30 days in vitro after 25 µM glutamate challenge for 24 h. 20 µM MK801 was applied simultaneously and served as a control for protective NMDA-R inhibition. F Quantification of the basal OCR of Ctrl and cofilin1−/− neurons, measured before the first compound was injected and G maximal OCR after FCCP injection of n = 3–5 replicates. Mean values ± SD are given. ns (not significant) compared to glutamate-treated cofilin1−/− cells; ##P < 0.01 and ###P < 0.0001 compared to untreated ctrl, *P < 0.05; **P < 0.01 and ***P < 0.001 compared to glutamate-treated ctrl (ANOVA, Scheffé’s test).
Fig. 6
Fig. 6. Enhancing cofilin1 phosphorylation reveals neuronal survival after glutamate exposure.
A Western blot analysis of phosphorylated Ser3-cofilin1 was performed after 3 h pretreatment with 1 µg/mL CN03 and an additional 24 h treatment with 25 µM glutamate. Quantification of the resulting signal was realized by densitometric analysis from n = 4 blots. The intensities of pCofilin1 (Ser3) were compared to the cofilin1 signal and to α-tubulin as a loading control and presented as mean + SD. Ctrl (control); Glut (glutamate). Bands are cropped at the indicated size for better comprehension with ImageLab software (Bio-Rad, California, USA). B Primary cortical neurons from wild-type E18 pubs were exposed to the indicated concentration of CN03 3 h prior to 25 µM glutamate treatment for 24 h at DIV9. Data from n = 6 are shown as mean + SD. ###P < 0.001 compared to control; ***P < 0.001 compared to glutamate-treated control (ANOVA, Scheffé’s test). C Micromolar concentrations of glutamate stimulated excessive Ca2+ entry into neurons, a pathologic condition known as excitotoxicity. By application of CN03 protein, a known Rho activator, cofilin1 is deactivated via ROCK-LIMK pathways thereby promoting neuronal protection by circumventing cofilin1 activation and mitochondrial demise. NMDA-R N-methyl-d-aspartate receptor, ER endoplasmic reticulum, [Ca2+] intracellular calcium concentration, P Ser3-phosphorylation, ROCK Rho-associated serine/threonine kinase, LIMK LIM kinase, DNA deoxyribonucleic acid, roman numerals representing complex I–V of the respiratory chain.
Fig. 7
Fig. 7. Direct effects of recombinant, oxidized cofilin1 impairs the mitochondrial membrane potential and respiration.
A Recombinant cofilin1 protein was applied in the non-treated, the oxidized (100 µM H2O2) or in the reduced form (10 mM DTT). 75 µg mitochondria were incubated with 10 µg protein for 20 min at 37 °C and finally stained with TMRE (1:1000). 50 µM CCCP served as a positive control. 10,000 total events were measured and shown as mean + SD (n = 3 replicates). WT (wild-type cofilin1 protein); 2Cys (Cys139/Cys147 → serine mutation); 4Cys (39, 80, 139, 147 → serine mutation) ***P < 0.001 compared to ctrl (ANOVA, Scheffé’s test). B 75 µg mitochondria were incubated with 10 µg protein for 20 min at 37 °C and finally stained with MitoSOX red fluorescent dye (1:1000). 10 µM Antimycin A (AA) served as a positive control. In total, 10,000 total events were measured and shown as mean + SD (n = 3 replicates). WT (wild-type cofilin1 protein); 2Cys (Cys139/Cys147 → serine mutation); ***P < 0.001 compared to ctrl (ANOVA, Scheffé’s test). C In all, 10 µg mitochondria per well were incubated with the WT protein or D with the 2Cys mutant either in the native form, the oxidized form (100 µM H2O2) or in the reduced form (10 mM DTT) for 30 min at 37 °C and were administered to the Seahorse Analyzer. Mean + SD (n = 5–9 replicates). E Quantification of mitochondrial activity was conducted with the values delivered after the injection of ADP as a substrate for the OXPHOS phosphorylating capacity. F FCCP uncouples the oxygen consumption from ATP production and is used to assess maximal respiratory activity. ns not significant, WT wild-type cofilin1 protein, 2Cys Cys139/Cys147 → serine mutation. P values were calculated by ANOVA, Scheffé’s test.

References

    1. Sies H, Berndt C, Jones DP. Oxidative stress. Annu Rev Biochem. 2017;86:715–48. doi: 10.1146/annurev-biochem-061516-045037. - DOI - PubMed
    1. Jones DP. Redefining oxidative stress. Antioxid Redox Signal. 2006;8:1865–79. doi: 10.1089/ars.2006.8.1865. - DOI - PubMed
    1. Halliwell B. Reactive oxygen species and the central nervous system. J Neurochemistry. 1992;59:1609–23. doi: 10.1111/j.1471-4159.1992.tb10990.x. - DOI - PubMed
    1. Kim GH, Kim JE, Rhie SJ, Yoon S. The role of oxidative stress in neurodegenerative diseases. Exp Neurobiol. 2015;24:325–40. doi: 10.5607/en.2015.24.4.325. - DOI - PMC - PubMed
    1. Vila M, Przedborski S. Targeting programmed cell death in neurodegenerative diseases. Nat Rev Neurosci. 2003;4:365–75. doi: 10.1038/nrn1100. - DOI - PubMed

Publication types

MeSH terms

LinkOut - more resources