. 2021 Dec;40(50):6720-6735.
doi: 10.1038/s41388-021-02062-3. Epub 2021 Oct 16.

MCPIP1 inhibits Wnt/β-catenin signaling pathway activity and modulates epithelial-mesenchymal transition during clear cell renal cell carcinoma progression by targeting miRNAs

Affiliations

MCPIP1 inhibits Wnt/β-catenin signaling pathway activity and modulates epithelial-mesenchymal transition during clear cell renal cell carcinoma progression by targeting miRNAs

Judyta Gorka et al. Oncogene. 2021 Dec.

Abstract

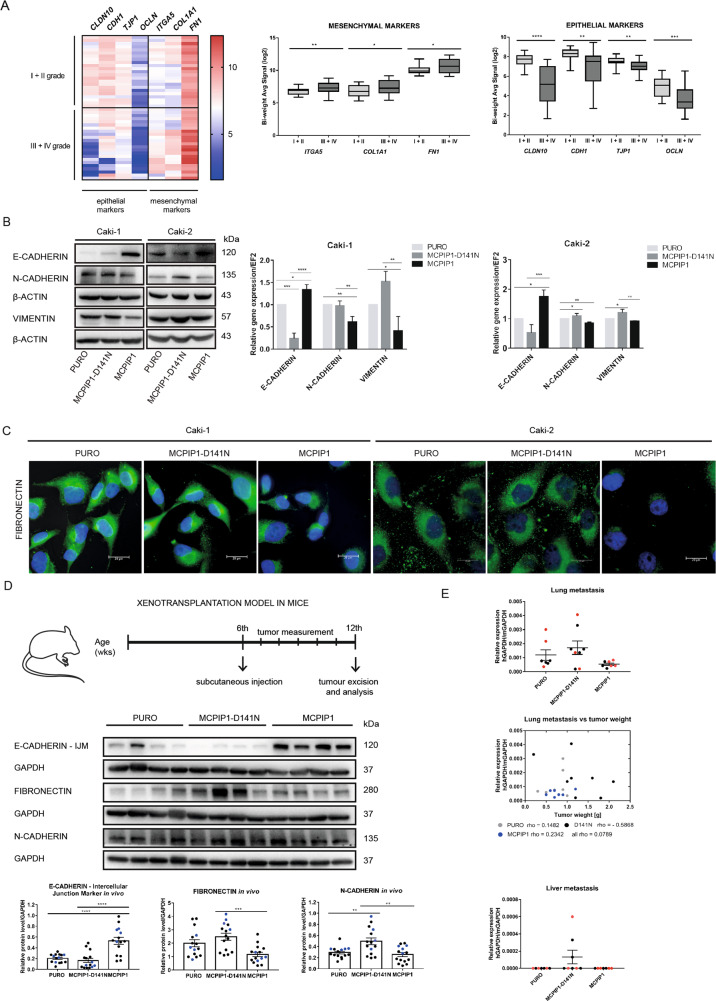
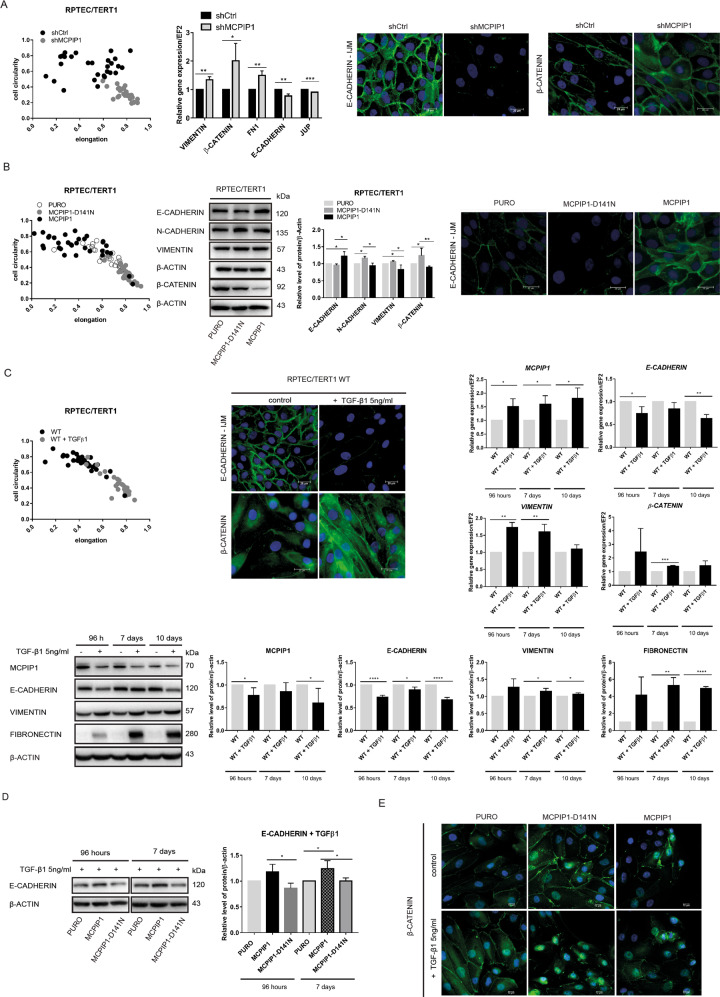
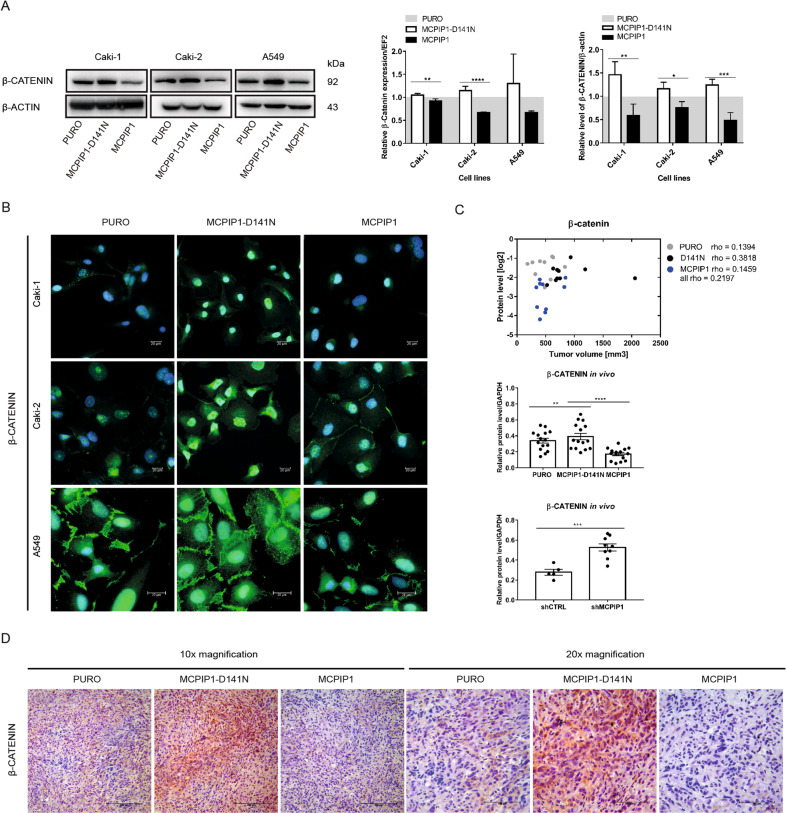
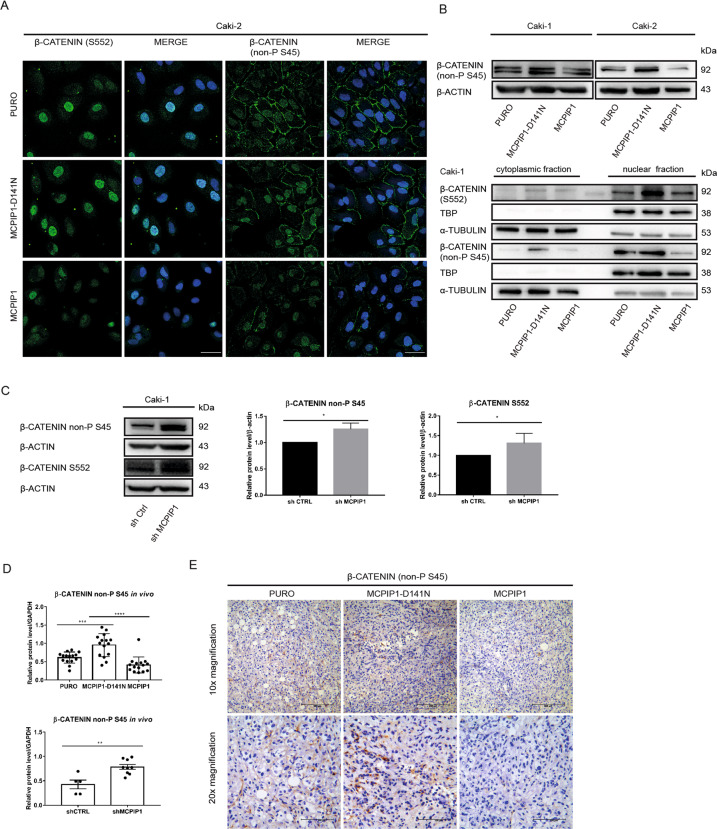
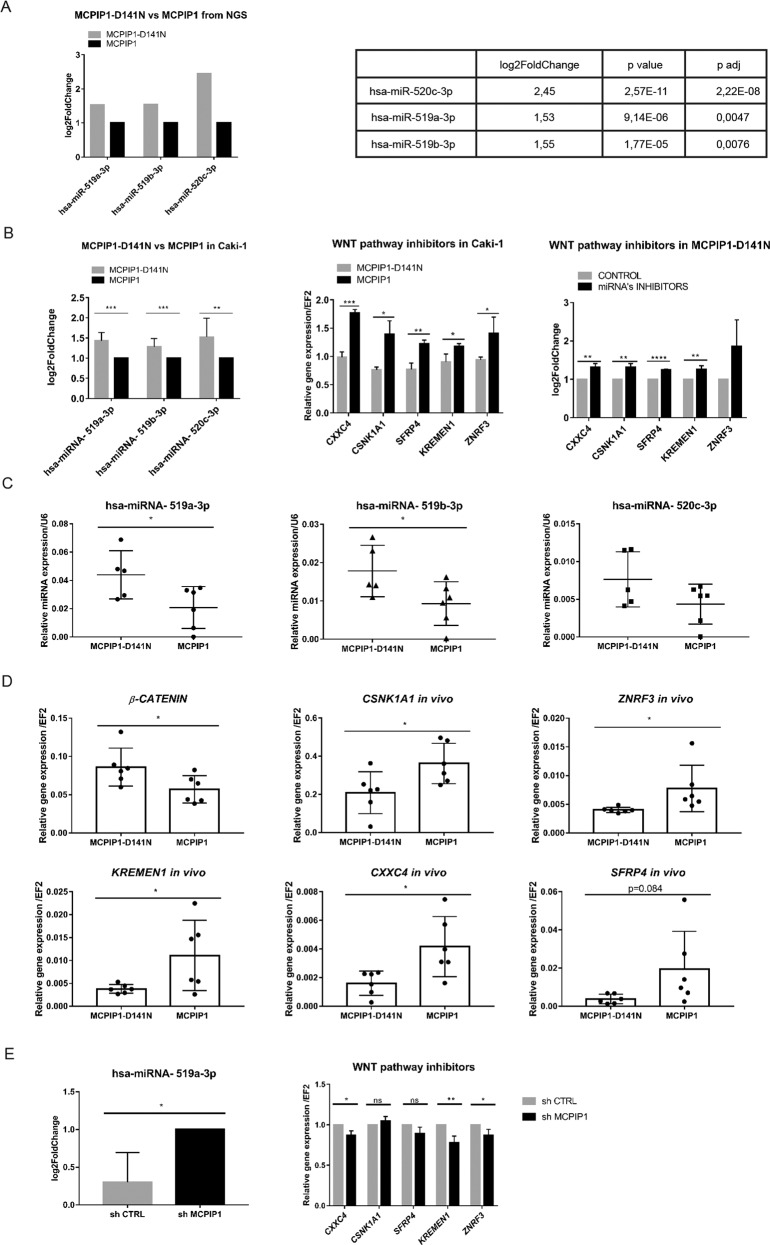
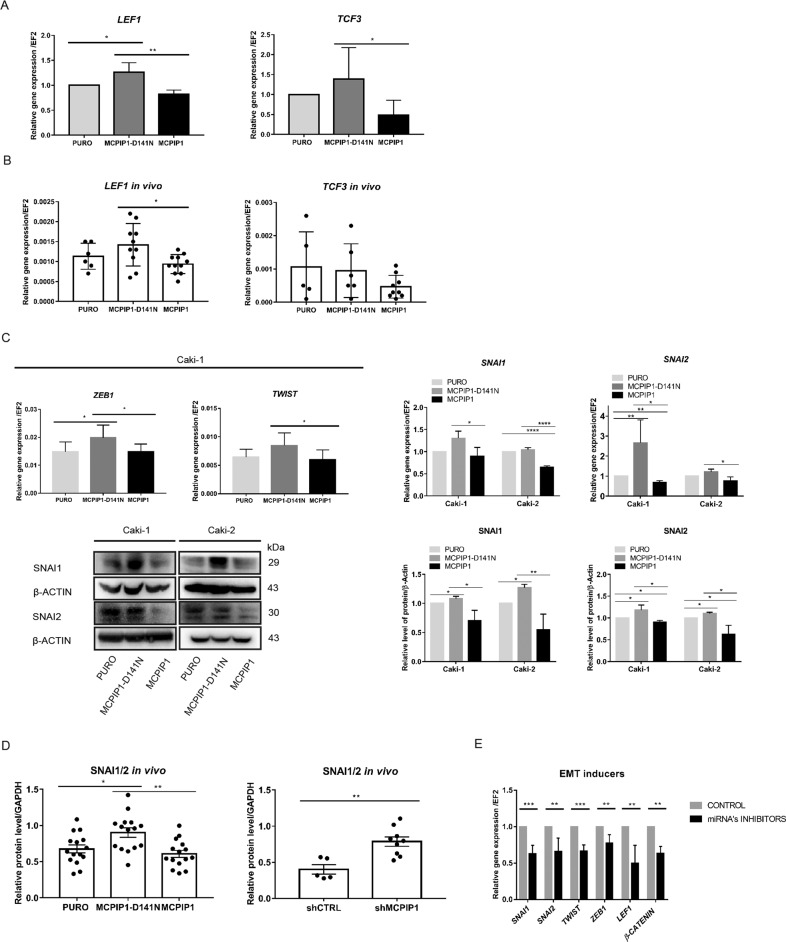
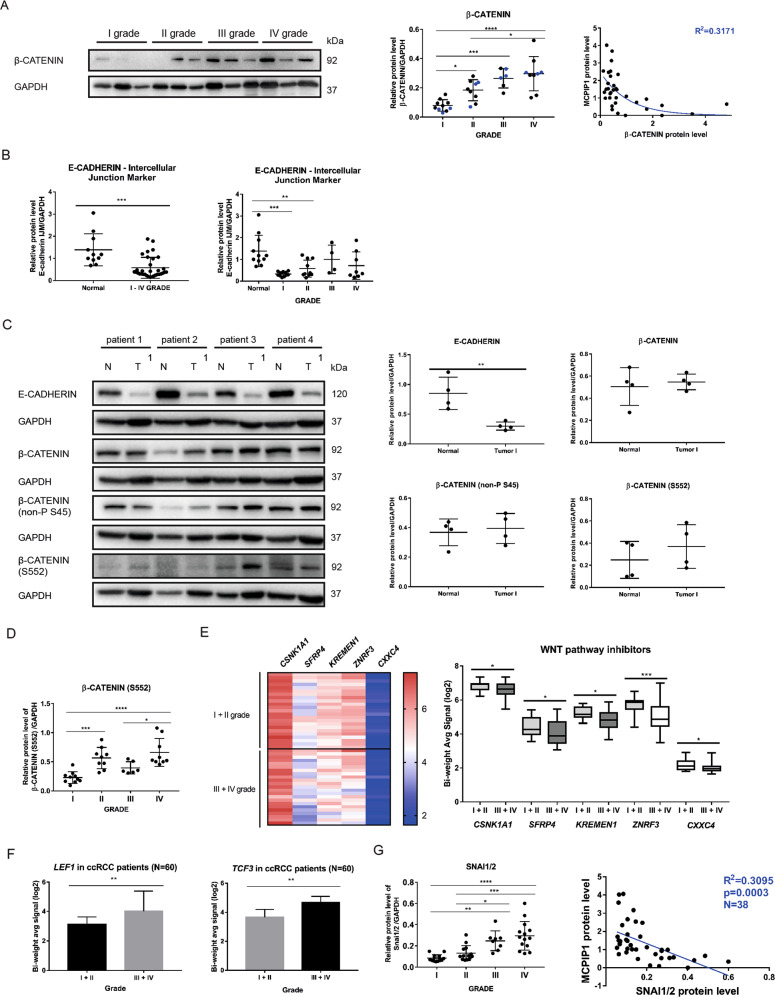
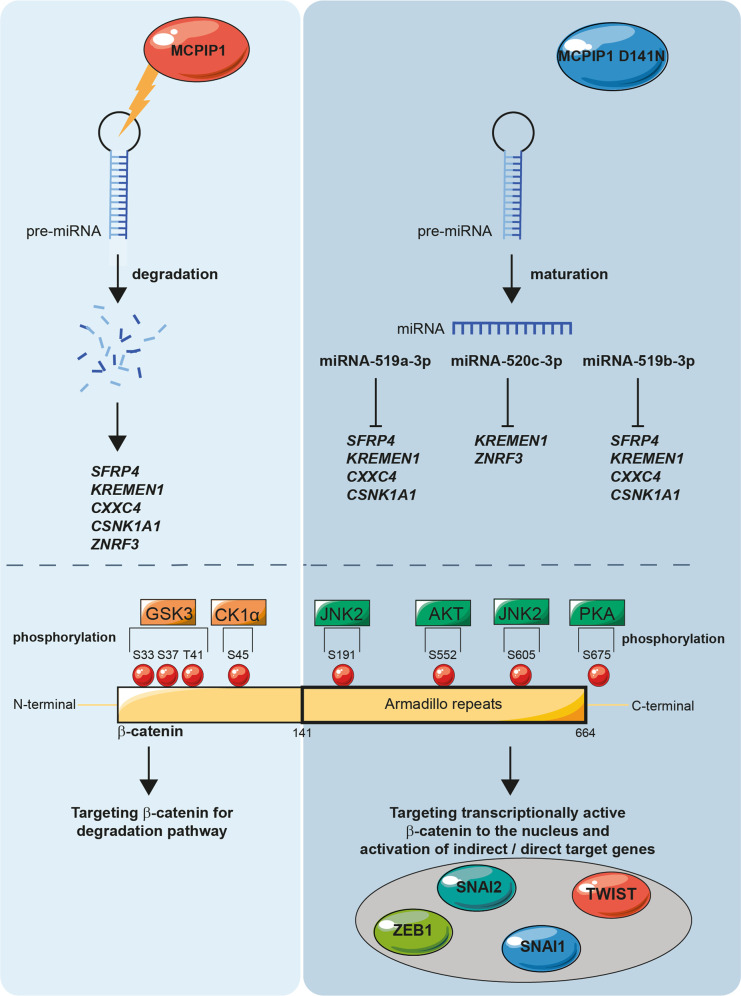
Epithelial-mesenchymal transition (EMT) refers to the acquisition of mesenchymal properties in cells participating in tumor progression. One hallmark of EMT is the increased level of active β-catenin, which can trigger the transcription of Wnt-specific genes responsible for the control of cell fate. We investigated how Monocyte Chemotactic Protein-1-Induced Protein-1 (MCPIP1), a negative regulator of inflammatory processes, affects EMT in a clear cell renal cell carcinoma (ccRCC) cell line, patient tumor tissues and a xenotransplant model. We showed that MCPIP1 degrades miRNAs via its RNase activity and thus protects the mRNA transcripts of negative regulators of the Wnt/β-catenin pathway from degradation, which in turn prevents EMT. Mechanistically, the loss of MCPIP1 RNase activity led to the upregulation of miRNA-519a-3p, miRNA-519b-3p, and miRNA-520c-3p, which inhibited the expression of Wnt pathway inhibitors (SFRP4, KREMEN1, CXXC4, CSNK1A1 and ZNFR3). Thus, the level of active nuclear β-catenin was increased, leading to increased levels of EMT inducers (SNAI1, SNAI2, ZEB1 and TWIST) and, consequently, decreased expression of E-cadherin, increased expression of mesenchymal markers, and acquisition of the mesenchymal phenotype. This study revealed that MCPIP1 may act as a tumor suppressor that prevents EMT by stabilizing Wnt inhibitors and decreasing the levels of active β-catenin and EMT inducers.


Conflict of interest statement

The authors declare no competing interests.

Figures

Fig. 1
Fig. 1. Influence of MCPIP1 on EMT markers.
A Hierarchical clustering of 7 genes that are significantly associated with ccRCC tumor progression and epithelial-mesenchymal transition. Each row represents an individual tissue sample. The scale represents gene expression levels in log2 scale. On the right, quantification of the signal from microarray; n (I + II) = 23, n (III + IV) = 23. Statistics was performed using one-way ANOVA between subjects (unpaired). B Effect of MCPIP1 overexpression (MCPIP1) or mutation (D141N) on EMT markers. Left panel, representative western blot with β-actin as a loading control for the Caki-1 and Caki-2 cell line; right panel, mRNA levels of EMT markers in Caki-1 and Caki-2 cells, quantified with real-time PCR, EF2 was used as the reference gene. The results are presented as the mean ± SD of three independent experiments. P values were estimated using one-way ANOVA, *P < 0.05, **P < 0.01, ***P < 0.001, ****P < 0.0001. C Immunofluorescence staining of fibronectin in Caki-1 and Caki-2 cells after overexpression of MCPIP1 (MCPIP1), mutation of MCPIP1 (MCPIP1-D141N) and in control cells (PURO). DAPI for nuclei; fibronectin antibody labeled with fluorescent dye AlexaFluor 488, scale bar = 20 µm. D Effect of MCPIP1 overexpression and mutation on EMT markers in xenotransplantation model in mice. Tumors were collected 6 weeks after subcutaneous injection of Caki-1 cell line with MCPIP1 overexpression (MCPIP1), mutation (D141N) and control (PURO). Representative western blot analysis of EMT markers in tumors with overexpression, mutation of MCPIP1 and control (PURO). Middle panel, densitometric quantification of protein levels in tumors. GAPDH as a loading control. Animal studies involved 45 NOD-SCID mice: PURO N = 15, MCPIP1-D141N N = 15, MCPIP1 N = 15. The results are presented as means ± SD. P values were estimated using one-way ANOVA, *P < 0.05, **P < 0.01, ***P < 0.001. E mRNA analysis of lung and liver metastasis using real-time PCR in NOD-SCID mice after 6 weeks of subcutaneous injection with Caki-1 GFP with MCPIP1 overexpression (MCPIP1), mutation (D141N) and control. The study involved 8 NOD-SCID mice: PURO N = 7, MCPIP1-D141N N = 8, MCPIP1 N = 7. Gapdh was used as the reference gene. The results are presented as means ± SEM. P values were estimated using one-way ANOVA. Below, graph showing the dependence of the lung metastasis and tumor weight after 6 weeks of subcutaneous injection of Caki-1 cell line with MCPIP1 overexpression (MCPIP1), mutation (D141) or control (PURO); coefficient of correlation (rho) of Spearman Correlation test is shown as well.
Fig. 2
Fig. 2. Effect of the MCPIP1 level in normal RPTEC/TERT1 cells on EMT.
A Effect of MCPIP1 downregulation (shMCPIP1) in RPTEC/TERT1 cell line. Morphological analysis shows the relationship between cell circularity and elongation (left panel). Effect of MCPIP1 downregulation on mRNA expression of E-cadherin, JUP, Vimentin, β-catenin, and FN1 in RPTEC/TERT1 cell line (middle panel). The results are presented as the mean ± SD of three independent experiments. P values were estimated using two-tailed unpaired Student’s t test, *p < 0.05, **p < 0.01, ***p < 0.001. Right panel, immunofluorescence staining to visualize cell morphology by E-cadherin – IJM and β-catenin in RPTEC/TERT1 cells after downregulation of MCPIP1 (shMCPIP1). DAPI for nuclei; E-cadherin - IJM antibody labeled with fluorescent dye AlexaFluor 488; β-catenin antibody labeled with fluorescent dye AlexaFluor 546, scale bar = 20 µm. B Effect of MCPIP1 overexpression (MCPIP1) or mutation (MCPIP1-D141N) in RPTEC/TERT1 cell line. Morphological analysis shows the relationship between cell circularity and elongation (left panel). Western blot analysis of EMT markers in RPTEC/TERT1 cells: E-cadherin, N-cadherin, Vimentin, and β-catenin after overexpression of MCPIP1, MCPIP1-D141N and PURO (middle panel). Representative western blot with β-actin as a loading control. Right panel, immunofluorescence staining to visualize cell morphology by E-cadherin – IJM in RPTEC/TERT1 cells after overexpression of MCPIP1, MCPIP1-D141N and PURO. DAPI for nuclei; scale bar = 20 µm. C Morphological analysis shows the relationship between cell circularity and elongation (left panel) after 24 h TGF-β1 stimulation in RPTEC/TERT1 cells. Staining for E-cadherin – IJM, main epithelial marker after 24 h TGF-β1 stimulation in RPTEC/TERT1 cells. DAPI for nuclei; scale bar = 20 µm. On the right, mRNA expression of MCPIP1, E-cadherin, Vimentin, and β-catenin after TGF-β1 stimulation in RPTEC/TERT1 cells at various time points: 96 h and 7, 10 days. EF2 was used as the reference gene. Below, western blot and densitometric quantification showing the level of MCPIP1, E-cadherin, Vimentin, and fibronectin after TGF-β1 stimulation in RPTEC/TERT1 cells. The results are presented as the mean ± SD of three independent experiments. P values were estimated using one-way ANOVA, *P < 0.05, **P < 0.01, ***P < 0.001. D Western blot analysis and densitometric quantification of the level of E-cadherin in RPTEC/TERT1 after overexpression of MCPIP1 (MCPIP1), mutation (MCPIP1-D141N) and in control cells (PURO) stimulated with TGF-β1 after 96 h and 7 days. The results are presented as the mean ± SD of three independent experiments. P values were estimated using one-way ANOVA, *P < 0.05. E Immunofluorescence staining of fibronectin in RPTEC/TERT1 cell line after overexpression of MCPIP1, MCPIP1-D141N and PURO. DAPI for nuclei; fibronectin antibody labeled with fluorescent dye AlexaFluor 546, scale bar = 10 µm.
Fig. 3
Fig. 3. Influence of MCPIP1 on β-catenin.
A Representative western blot of β-catenin from ccRCC and A549 cell lines with β-actin as the loading control and densitometric quantification. mRNA expression of β-catenin in cell lines, quantified with real-time PCR, EF2 was used as the reference gene. The results are presented as the mean ± SD of three independent experiments. P values were estimated using one-way ANOVA, *P < 0.05, **P < 0.01, ***P < 0.001. B Immunofluorescence staining on β-catenin in Caki-1, Caki-2 and A549 cells after overexpression of MCPIP1 (MCPIP1) and mutation (MCPIP1-D141N) with control (PURO). DAPI for nuclei; β-catenin antibody labeled with fluorescent dye AlexaFluor 546, scale bar = 20 µm. C Effect of MCPIP1 overexpression, mutation and downregulation on β-catenin in xenotransplantation model in mice. Graph showing the dependence of the level of β-catenin and tumor volume after 6 weeks of subcutaneous injection of Caki-1 cell line with MCPIP1 overexpression (MCPIP1), mutation (D141) or control (PURO); coefficient of correlation (rho) of Spearman Correlation test is shown as well. Below densitometric quantification of β-catenin in tumors. GAPDH as the loading control. Tumors were collected 6 weeks after subcutaneous injection of Caki-1 cell line with MCPIP1 overexpression (MCPIP1), mutation (D141) or downregulation (shMCPIP1). Animal studies involved 45 NOD-SCID mice: PURO N = 15, MCPIP1-D141N N = 15, MCPIP1 N = 15 and 9 Foxn1nu/Foxn1nu mice: shCTRL N = 5, shMCPIP1 N = 9. The results are presented as means ± SD. P values were estimated using one-way ANOVA and two-tailed unpaired Student’s t test, *P < 0.05, **P < 0.01, ***P < 0.001, ****P < 0.0001. D β-catenin IHC staining of tumor sections. Immunohistochemical evaluation was performed using primary β-catenin antibody and EnVision Detection Systems Peroxidase/DAB ((3,30-Diaminobenzidine) Rabbit/Mouse (Dako), scale bar, 100 and 200 µm.
Fig. 4
Fig. 4. MCPIP1 affects the β-catenin activity.
A Confocal analysis of the nuclear location of phospho-β-catenin (S552) and active β-catenin in the Caki-2 cell line with MCPIP1 overexpression (MCPIP1), the mutated form of MCPIP1 (MCPIP1-D141N) and control cells (PURO). DAPI for nuclei; phospho-β-catenin (S552) antibody and anti-non-phospho (Active) β-Catenin antibody labeled with fluorescent dye AlexaFluor 488, scale bar = 20 µm. B Western blot analysis of active (non-P S45) β-catenin from ccRCC cell line from total lysate with β-actin as a loading control. Below, representative western blot of phospho β-catenin (S552) and active (non-P S45) β-catenin from Caki-1 divided to cytoplasmic and nuclear fraction with TBP as a loading control for nuclear fraction and α-tubulin as a loading control for cytoplasmic fraction. C Western blot analysis and densitometric quantification of the level of phospho β-catenin (S552) and active (non-P S45) β-catenin from Caki-1 after downregulation of MCPIP1 (shMCPIP1) and control (shCtrl) with β-actin as the loading control. The results are presented as the mean ± SD of three independent experiments. P values were estimated using two-tailed unpaired Student’s t test, *P < 0.05. D Effect of MCPIP1 overexpression, mutation, and downregulation on active (non-P S45) β-catenin in xenotransplantation model in mice. Densitometric quantification of active (non-P S45) β-catenin in tumors. GAPDH as the loading control. Tumors were collected 6 weeks after subcutaneous injection of Caki-1 cell line with MCPIP1 overexpression (MCPIP1), mutation (D141) or downregulation (shMCPIP1) with control (PURO) and (shCTRL). Animal studies involved 45 NOD-SCID mice: PURO N = 15, MCPIP1-D141N N = 15, MCPIP1 N = 15 and 9 Foxn1nu/Foxn1nu mice: shCTRL N = 5, shMCPIP1 N = 9. The results are presented as means ± SD. P values were estimated using one-way ANOVA and two-tailed unpaired Student’s t test, *P < 0.05, **P < 0.01, ***P < 0.001, ****P < 0.0001. E Active (non-P S45) β-catenin IHC staining of tumor sections. Immunohistochemical evaluation was performed using primary active (non-P S45) β-catenin antibody and EnVision Detection Systems Peroxidase/DAB ((3,30-Diaminobenzidine) Rabbit/Mouse (Dako), scale bar, 100 and 200 µm.
Fig. 5
Fig. 5. Influence of MCPIP1 on negative regulators of the Wnt pathway.
A The Next-Generation Sequencing results of miRNA-519a-3p, miRNA-519b-3p, and miRNA-520c-3p in the Caki-1 cells overexpressing MCPIP1 and MCPIP1-D141N. P values for differentially expressed miRNAs were corrected for multiple comparisons using Benjamini–Hochberg approach and the results with the corrected P values < 0.05 were considered significant. B Analysis of miRNA’s level using real-time PCR method was performed in the Caki-1 cell line with overexpression of MCPIP1 and mutation of MCPIP1 (MCPIP1-D141N). U6 was used as the reference gene. The results are presented as the mean ± SD of three independent experiments. P values were estimated using two-tailed unpaired Student’s t test, **P < 0.01, ***P < 0.001. Middle graph, analysis of mRNA level for inhibitors of the Wnt pathway: SRFP4, KREMEN1, ZNRF3, CSNK1A1 and CXXC4 in the Caki-1 cell line with overexpression of MCPIP1 (MCPIP1) and mutation (MCPIP1-D141N) using real-time PCR. EF2 was used as the reference gene. The results are presented as the mean ± SD of three independent experiments. Right graph presents the influence of miRNA’s inhibitors. Analysis of mRNA levels of genes: SRFP4, KREMEN1, ZNRF3, CSNK1A1 and CXXC4 using real-time PCR. The experiment was performed on Caki-1 cells with the D141N mutation after treatment with miRNA’s inhibitors relative to control inhibitors. 24 h after seeding, to induce overexpression, doxycycline was added. After another 24 h, miRNA Power Inhibitors targeting miRNA-519a-3p, miRNA-519b-3p and miRNA-520c-3p were added at a total concentration of 3 µM (each 1 µM). Negative Control A was used at a concentration of 3 µM. EF2 was used as the reference gene. The results are presented as the mean ± SD of three independent experiments. P values were estimated using two-tailed unpaired Student’s t test, *P < 0.05, **P < 0.01, ***P < 0.001, ****P < 0.0001. C Expression level of miRNA-519a-3p, miRNA-519b-3p, and miRNA-520c-3p in a xenotransplantation model in NOD-SCID mice with overexpression (MCPIP1) and mutation of MCPIP1 (MCPIP1-D141N). MCPIP1-D141N N = 5 mice, MCPIP1 N = 6. U6 was used as the reference gene. The results are presented as means ± SD. P values were estimated using two-tailed unpaired Student’s t test, *P < 0.05. D Expression level of inhibitors of the Wnt pathway: SRFP4, KREMEN1, ZNRF3, CSNK1A1 and CXXC4 in a xenotransplantation model in NOD-SCID mice with overexpression (MCPIP1) and mutation of MCPIP1 (MCPIP1-D141N). MCPIP1-D141N N = 6 mice, MCPIP1 N = 6. EF2 was used as the reference gene. The results are presented as means ± SD. P values were estimated using two-tailed unpaired Student’s t test, *P < 0.05. E Analysis of miRNA-519a-3p level using real-time PCR method was performed in the Caki-1 cell line with downregulation of MCPIP1 (shMCPIP1). U6 was used as the reference gene. Right panel, expression level of inhibitors of the Wnt pathway: SRFP4, KREMEN1, ZNRF3, CSNK1A1 and CXXC4 in the Caki-1 cell line with downregulation of MCPIP1. EF2 was used as the reference gene. The results are presented as the mean ± SD of three independent experiments. P values were estimated using two-tailed unpaired Student’s t test, *P < 0.05, **P < 0.01.
Fig. 6
Fig. 6. The RNase activity of MCPIP1 affects EMT inducers.
A Analysis of mRNA level of LEF1 and TCF3 in the Caki-1 cell line after overexpression of MCPIP1 (MCPIP1), mutation (MCPIP1-D141N) and control (PURO). The results are presented as the mean ± SD of three independent experiments. P values were estimated using one-way ANOVA, *P < 0.05, **P < 0.01, ***P < 0.001, ****P < 0.0001. B Effect of MCPIP1 overexpression, mutation, and control on LEF1 and TCF3 in xenotransplantation model in mice. Tumors were collected 6 weeks after subcutaneous injection of Caki-1 cell line with MCPIP1 overexpression (MCPIP1) and mutation (D141N). Analysis of mRNA level of LEF1 and TCF3 in tumors. Animal studies involved 45 NOD-SCID mice of LEF1 for 27 mice a specific product was obtained in the real-time PCR reaction: PURO N = 6, MCPIP1-D141N N = 10, MCPIP1 N = 11. Animal studies involved 45 NOD-SCID mice of TCF3, for 20 mice a specific product was obtained in the real-time PCR reaction: PURO N = 5, MCPIP1-D141N N = 6, MCPIP1 N = 9. EF2 was used as the reference gene. The results are presented as means ± SD. P values were estimated using one-way ANOVA, *P < 0.05, **P < 0.01, ***P < 0.001. C Analysis of mRNA level of ZEB1 and TWIST in the Caki-1 cell line after overexpression of MCPIP1 (MCPIP1), mutation (MCPIP1-D141N) and control (PURO). On the right, analysis of mRNA level of SNAI1 and SNAI2 in both ccRCC cell lines. EF2 was used as the reference gene. Below representative western blot of SNAI1 and SNAI2 in Caki-1 and Caki-2 cell lines with overexpression mutation and control with β-actin as the loading control. On the right, densitometric quantification, PURO was set to 1. The results are presented as the mean ± SD of three independent experiments. P values were estimated using one-way ANOVA, *P < 0.05, **P < 0.01, ***P < 0.001, ****P < 0.0001. D Effect of MCPIP1 overexpression, mutation and downregulation on EMT regulators in xenotransplantation model in mice. Tumors were collected 6 weeks after subcutaneous injection of Caki-1 cell line with MCPIP1 overexpression (MCPIP1), mutation (D141) or downregulation (shMCPIP1) with control (PURO) and (shCTRL). Densitometric quantification of protein level of SNAI1/2 with GAPDH as the loading control. Animal studies involved 45 NOD-SCID mice: PURO N = 15, MCPIP1-D141N N = 15, MCPIP1 N = 15 and 9 Foxn1nu/Foxn1nu mice: shCTRL N = 5, shMCPIP1 N = 9. The results are presented as means ± SD. P values were estimated using one-way ANOVA and two-tailed unpaired Student’s t test, *P < 0.05, **P < 0.01. E Analysis the influence of miRNA’s inhibitors on EMT inducers. Analysis of mRNA levels of genes: SNAI1, SNAI2, TWIST, ZEB1, LEF1 and β-catenin using real-time PCR. The experiment was performed on Caki-1 cells with the D141N mutation after treatment with miRNA’s inhibitors relative to control inhibitors. 24 h after seeding, to induce overexpression, doxycycline was added. After another 24 h, miRNA Power Inhibitors targeting miRNA-519a-3p, miRNA-519b-3p and miRNA-520c-3p were added at a total concentration of 3 µM (each 1 µM). Negative Control A was used at a concentration of 3 µM. EF2 was used as the reference gene. The results are presented as the mean ± SD of three independent experiments. P values were estimated using two-tailed unpaired Student’s t test, *P < 0.05, **P < 0.01, ***P < 0.001, ****P < 0.0001.
Fig. 7
Fig. 7. MCPIP1 inhibits the Wnt/β-catenin pathway during ccRCC progression.
A Analysis of β-catenin levels in tumor tissue specimens from patients. Representative western blot of 12 samples with GAPDH as the loading control. Quantification of total β-catenin level in tumor samples, divided into four groups according to tumor grade (I–IV), N = 34. Blue samples were taken for representative western blots. Right panel, correlation of protein level between MCPIP1 and β-catenin in all patients used in the experiment, the R-square value is given. P values were estimated using one-way ANOVA. *P < 0.05, **P < 0.01, ***P < 0.001, ****P < 0.0001. B Quantification of E-cadherin intercellular junction marker level in normal and tumor samples, N = 44. Quantification of E-cadherin intercellular junction marker level in normal and tumor samples, divided into four groups according to tumor grade (I–IV) with GAPDH as the loading control. N = 44. P values were estimated using one-way ANOVA. *P < 0.05, **P < 0.01, ***P < 0.001, ****P < 0.0001. C Analysis of E-cadherin and β-catenin levels in ccRCC samples in comparison with non-tumor tissues. Western blot and densitometric quantification of 4 patients of E-cadherin, total β-catenin, phospho β-catenin (S552) and active (non-P S45) β-catenin with GAPDH as the loading control. P values were estimated using two-tailed unpaired Student’s t test, *P < 0.05, **P < 0.01, ***P < 0.001, ****P < 0.0001. D Quantification of phospho β-catenin (S552) level in patient tumor samples, divided into four groups according to tumor grade (I–IV) with GAPDH as the loading control, N = 34. The results are presented as means ± SD. P values were estimated using two-tailed unpaired Student’s t test, *P < 0.05, **P < 0.01, ***P < 0.001, ****P < 0.0001. E Hierarchical clustering of genes inhibiting the Wnt pathway: SRFP4, KREMEN1, ZNRF3, CSNK1A1 and CXXC4. Each row represents an individual tissue sample. The scale represents gene expression levels in log2 scale. Quantification of the signal from microarray. N (I + II) = 23, N (III + IV) = 23. Statistics was performed using one-way ANOVA between subjects (unpaired), *P < 0.05, **P < 0.01. F Quantification of the LEF1 and TCF3 signals in a microarray analysis. The scale represents gene expression levels in log2 scale. N (I + II) = 30, N (III + IV) = 30. P values were estimated using a two-tailed, unpaired Student’s t test; *P < 0.05, **P < 0.01. G Analysis of SNAI1/2 protein level in tumor tissue specimens from patients. Quantification of total SNAI1/2 level in tumor samples, divided into four groups according to tumor grade (I–IV), N = 38; with GAPDH as the loading control. The results are presented as means ± SD. Correlation of protein level between MCPIP1 and SNAI1/2 in patients used in the experiment, the R-square and P value were given. P values were estimated using one-way ANOVA. *P < 0.05, **P < 0.01, ***P < 0.001, ****P < 0.0001.
Fig. 8
Fig. 8. The possible mechanism by which MCPIP1 regulates the EMT process and the β-catenin level.
(Left panel) MCPIP1 regulates the levels of miRNA thereby actively influencing the levels of SFRP4, KREMEN1, ZNRF3, CXXC4 and CSNK1A1 and inhibiting the Wnt pathway by inactivating β-catenin and consequently inhibiting the EMT process. (Right panel) The loss of MCPIP1 RNase activity protects miRNA-519a-3p, miRNA-519b-3p, and miRNA-520c-3p from degradation; these miRNAs mature and inhibit the expression of negative regulators of the Wnt/β-catenin pathway, thus regulating the level of active β-catenin and the EMT process.

Similar articles

Cited by

References

    1. Valenta T, Hausmann G, Basler K. The many faces and functions of β-catenin. EMBO J. 2012;31:2714–36. - PMC - PubMed
    1. Behrens J, Jerchow BA, Würtele M, Grimm J, Asbrand C, Wirtz R, et al. Functional interaction of an axin homolog, conductin, with beta-catenin, APC, and GSK3beta. Science. 1998;280:596–9. - PubMed
    1. MacDonald BT, Tamai K, He X. Wnt/beta-catenin signaling: components, mechanisms, and diseases. Dev Cell. 2009;17:9–26. - PMC - PubMed
    1. Stamos JL, Weis WI. The β-catenin destruction complex. Cold Spring Harb Perspect Biol. 2013;5:a007898. - PMC - PubMed
    1. Kurose K, Sakaguchi M, Nasu Y, Ebara S, Kaku H, Kariyama R, et al. Decreased expression of REIC/Dkk-3 in human renal clear cell carcinoma. J Urol. 2004;171:1314–8. - PubMed

Publication types

MeSH terms