. 2022 Feb 3;139(5):690-703.
doi: 10.1182/blood.2021011775.

Autophagy in mesenchymal progenitors protects mice against bone marrow failure after severe intermittent stress

Affiliations

Autophagy in mesenchymal progenitors protects mice against bone marrow failure after severe intermittent stress

Theresa Landspersky et al. Blood. .

Abstract

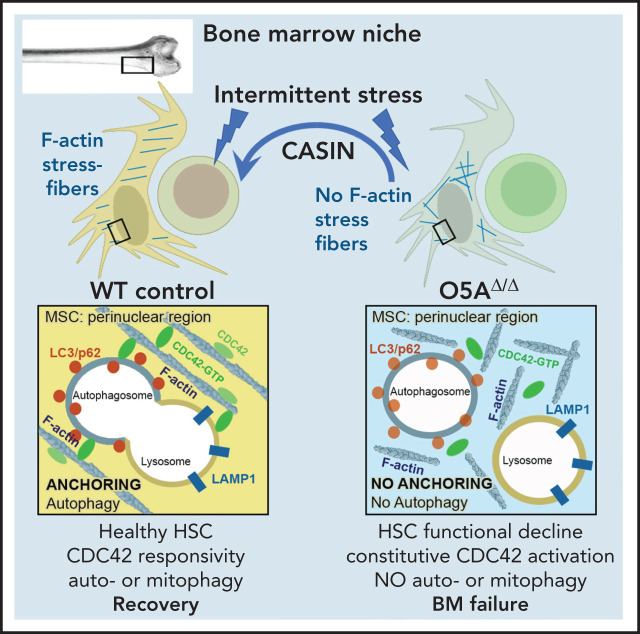
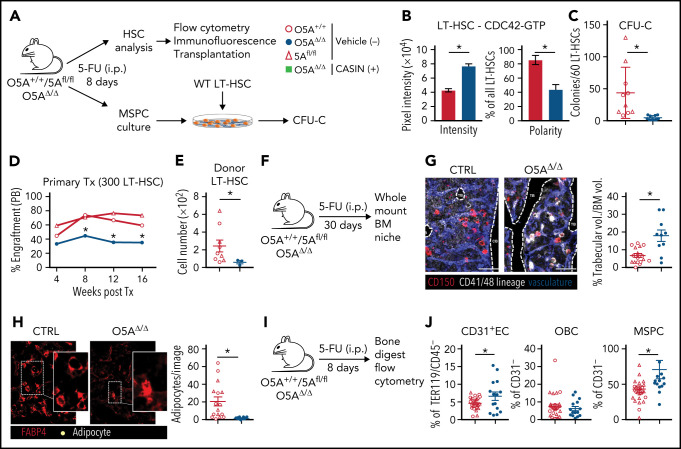
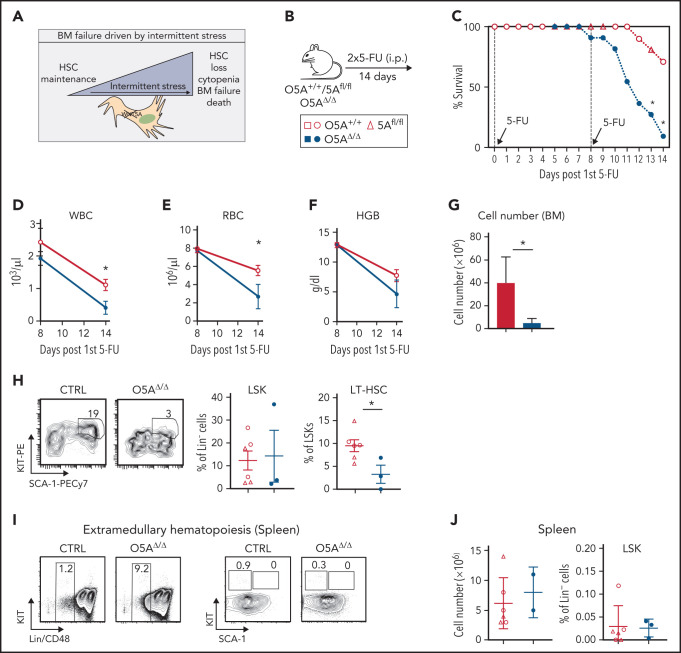
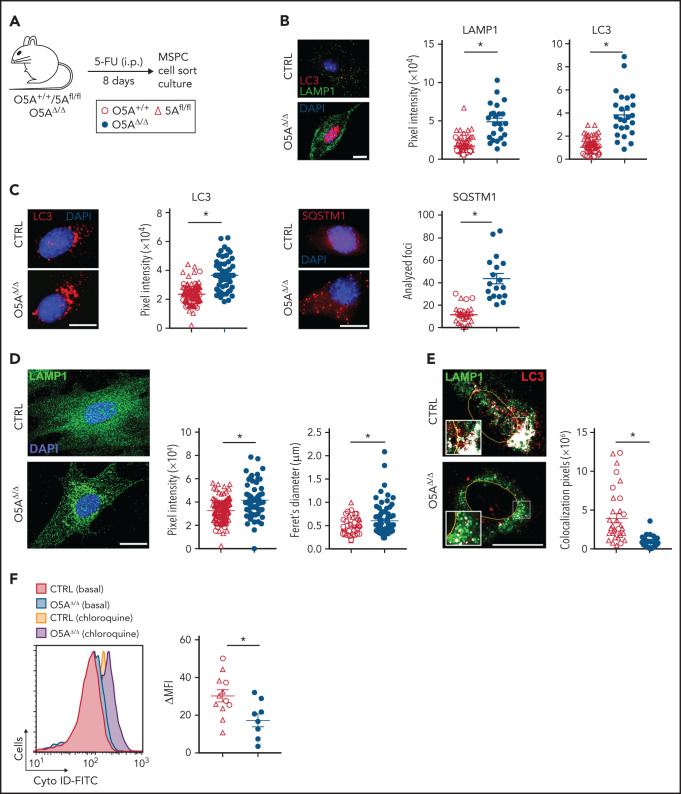
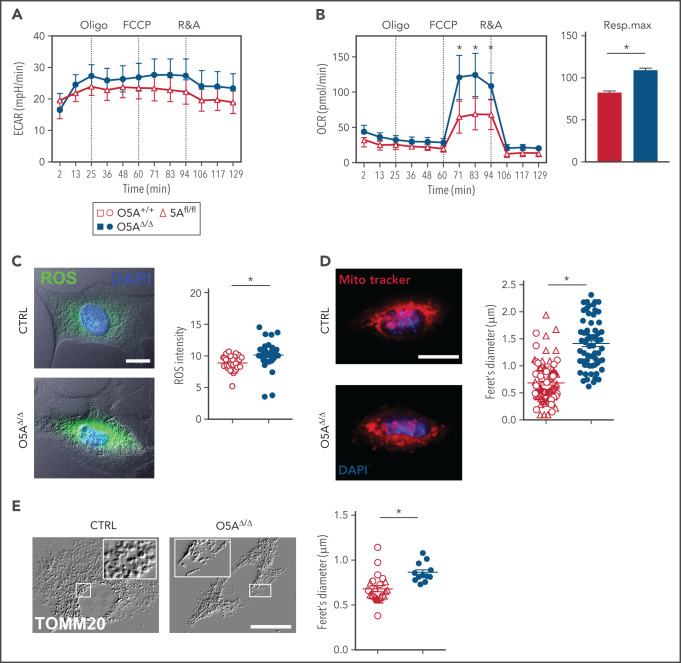
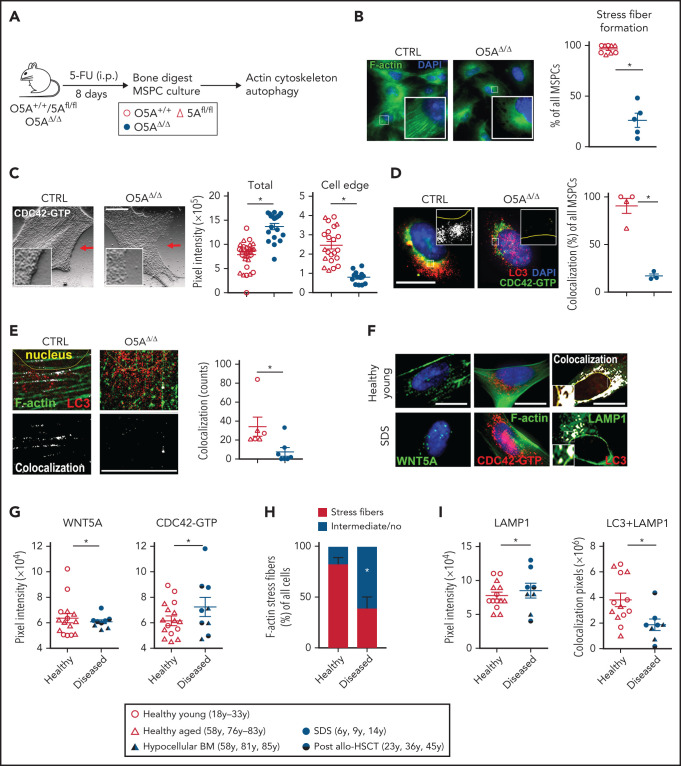
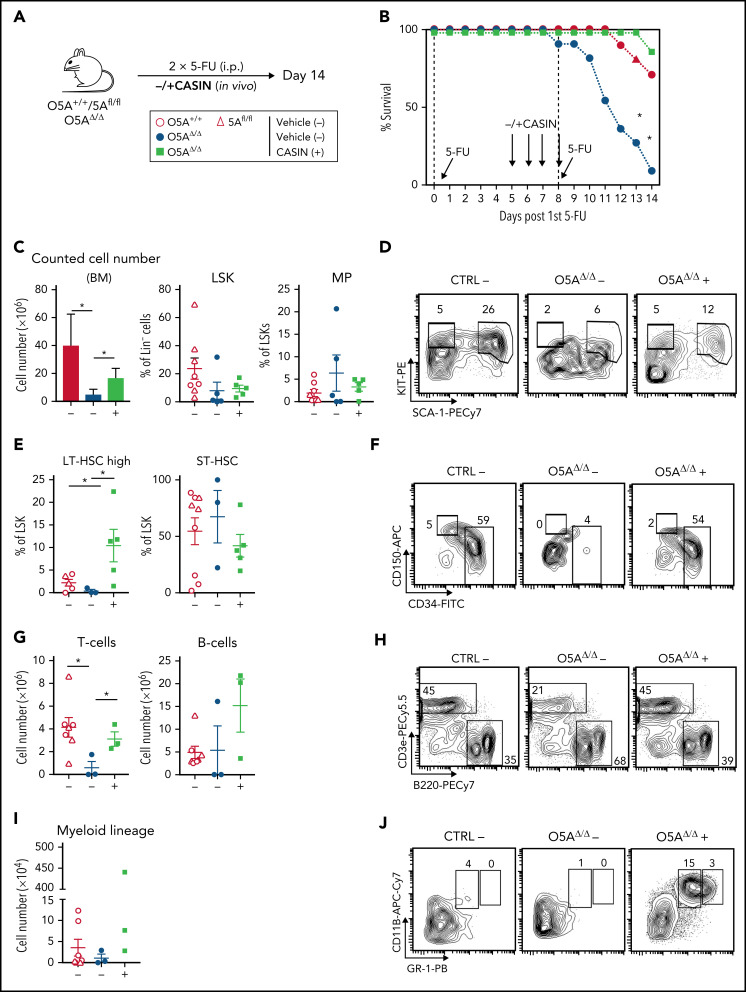
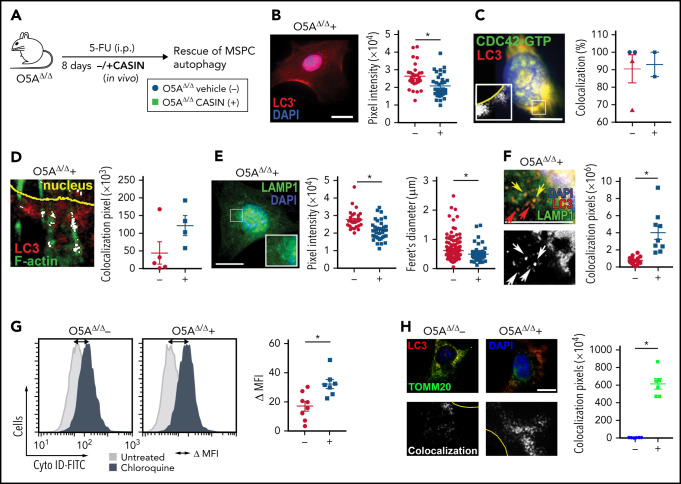
The cellular mechanisms required to ensure homeostasis of the hematopoietic niche and the ability of this niche to support hematopoiesis upon stress remain elusive. We here identify Wnt5a in Osterix+ mesenchymal progenitor and stem cells (MSPCs) as a critical factor for niche-dependent hematopoiesis. Mice lacking Wnt5a in MSPCs suffer from stress-related bone marrow (BM) failure and increased mortality. Niche cells devoid of Wnt5a show defective actin stress fiber orientation due to an elevated activity of the small GTPase CDC42. This results in incorrect positioning of autophagosomes and lysosomes, thus reducing autophagy and increasing oxidative stress. In MSPCs from patients from BM failure states which share features of peripheral cytopenia and hypocellular BM, we find similar defects in actin stress fiber orientation, reduced and incorrect colocalization of autophagosomes and lysosomes, and CDC42 activation. Strikingly, a short pharmacological intervention to attenuate elevated CDC42 activation in vivo in mice prevents defective actin-anchored autophagy in MSPCs, salvages hematopoiesis and protects against lethal cytopenia upon stress. In summary, our study identifies Wnt5a as a restriction factor for niche homeostasis by affecting CDC42-regulated actin stress-fiber orientation and autophagy upon stress. Our data further imply a critical role for autophagy in MSPCs for adequate support of hematopoiesis by the niche upon stress and in human diseases characterized by peripheral cytopenias and hypocellular BM.


Figures

None
Graphical abstract
Figure 1.
Figure 1.
Stress-induced niche remodeling in O5AΔ/Δ mice. (A) Experimental design for IP injection of 5-Fluorouracil (5-FU) in coculture assay of MSPCs and LT-HSC. The following genotypes were analyzed by flow cytometry and IF 8 days after treatment: Control (CTRL): O5A+/+, n = 5, 5Afl/fl, n = 7 and O5AΔ/Δ, n = 10. (B) Protein content and polarity of LT-HSCs stained for CDC42-GTP (n = 30), measured by ImageJ software. (C) Number of colonies from 60 LT-HSCs after coculture for 6 days on MSPCs isolated from 5-FU injected mice with the following genotype: (CTRL): O5A+/+, n = 5, 5Afl/fl, n = 5 and O5AΔ/Δ, n = 10. (D) Primary transplantation (Tx) of 300 sorted LT-HSCs 8 days after 5-FU injection into lethally irradiated 129*Ly5.1 WT recipients. Experimental groups: CTRL: O5A+/+, n = 5 and 5Afl/fl, n = 4 and O5AΔ/Δ, n = 7. Graph showing the donor engraftment in PB. (E) Absolute numbers of donor-type LT-HSCs in the BM, 16 weeks after Tx. For flow cytometry gating strategy, see supplemental Figure 1. (F) Experimental design for IP injection of 5-FU in 8- to 10-week-old mice of following genotypes: CTRL: O5A+/+ n = 2, 5Afl/fl n = 2 and O5AΔ/Δ, n = 2. BM analysis 30 days after treatment. (G) Stacked whole-mount images from epiphyseal/metaphyseal BM. FABP4+ vasculature is shown in blue. CD150 is shown in red, other hematopoietic markers (CD41, CD48, and lineage) are shown in gray. The dashed lines denote the endosteum. Scale bar, 100 µm; n = 10 images (n = 6 images 5Afl/fl PBS) from 2 mice each group. The results represent 2 independent experiments. The graph showing the % of trabecular volume per BM volume. (H) Stacked whole-mount images from epiphyseal/metaphyseal BM. FABP4+ adipocytes are shown in red. Adipocytes are additionally marked by a yellow circle. Extended focus projection images. Scale bar, 100 µm; n = 10 images from 2 mice each group, femora. The graph on the right shows the number of adipocytes per image. (I) Experimental design for analysis of bone-digested stromal cells, isolated from compact bones, 8 days post 5-FU treatment. (J) Relative numbers of CD31+ ECs, OBCs, and immature MSPCs; flow cytometry gating strategy in supplemental Figure 1. *P < .05 (nonparametric Mann-Whitney test: B-G,J). The results represent 2 to 3 independent experiments. Data are represented as dots per mouse or cell and the mean ± SEM. Symbol legends as shown in Figure 1A.
Figure 2.
Figure 2.
Peripheral and BM cytopenia in O5AΔ/Δ mice treated twice with 5-FU. (A) Graphical illustration of our hypothesis of how cytopenia is driven by declining niche homeostasis during consecutive periods of stress. (B) Experimental design for analysis of mice after 2 5-FU treatments (DAYS 0 AND 8). Control (CTRL): O5A+/+, n = 7, 5Afl/fl, n = 11 and O5AΔ/Δ, n = 11. (C) Survival of WT (open symbols, combined results of 5Afl/fl and O5A+/+ mice) and O5AΔ/Δ mice. (D-F) Graphs showing WBC, RBC, and hemoglobin (HGB) measured in PB, respectively, at DAYS 8 AND 14 from WT mice (open symbol, combined results of 5Afl/fl and O5A+/+ mice) and O5AΔ/Δ mice (closed symbols). (G) Total BM cell number 14 days after the first 5-FU treatment in CTRL (n = 9) and O5AΔ/Δ (n = 5) mice. Analysis of BM from 4 flushed long bones. (H) Representative contour plots of the BM after 2 consecutive 5-FU treatments at day 14. Graphs showing the percentage of LSKs (left) and LT-HSCs (right) in CTRL and O5AΔ/Δ mice. (I) Representative contour plots of spleen cells from mice treated twice with 5-FU. (J) Graphs showing the absolute cell number of spleen cells (left) and relative number of LSK cells in spleen (right). *P < .05 (2-sided parametric Student’s t test: [C-F]; Mann-Whitney test: [G-H]). The results represent 2 to 3 independent experiments. Data are represented as dots per mouse or cell and the mean ± SEM. Symbol legend shown in Figure 2B.
Figure 3.
Figure 3.
Defective autophagic vesicle delivery in MSPCs from O5AΔ/Δ mice. (A) Experimental design for IP injection of 5-FU in the following genotypes: CTRL: O5A+/+, n = 5, 5Afl/fl, n = 7 and O5AΔ/Δ, n = 10. Analysis of autophagy relevant mechanisms in compact bone-derived MSPCs 8 days after in vivo treatment. All experiments were performed either with sorted ([B], o/n culture) or compact bone-derived MSPCs ([C-F], passage 4). (B) Fluorescent staining of LC3 (red) and LAMP1 (green) in sorted primary MSPCs from the BM of 5-FU-treated mice, cultured overnight on 0.1%-gelatin-coated coverslips. (C) Fluorescent microscopy images of LC3 (red/left), SQSTM1 (=p62; red/right) and DAPI (blue) staining in compact bone-derived MSPCs (p4). The left graph shows the perinuclear distribution of LC3 measured with ImageJ software. SQSTM1 foci were counted with ImageJ software (graph, right). (D) Confocal images of perinuclear LAMP1 (green) and DAPI (blue) staining. The graphs show the perinuclear distribution of LAMP1 and the diameter of the lysosomes designated as feret's diameter measured with ImageJ software. (E) Confocal images of perinuclear colocalization of LAMP1 (green) and LC3 (red) measured by ImageJ software. Colocalization was measured by ImageJ software (PLUGIN: colocalization) and visualized in white. (F) Representative flow cytometry histogram of basal autophagy and quantification of Cyto-ID dye levels (DMFI: Cyto-ID dye level chloroquine treated-Cyto-ID dye level WITHOUT treatment). Data were measured by ImageJ software. Scale bars, 10 µm. *P < .05 (nonparametric Mann-Whitney test: B-F). The results of each panel represent 2 to 3 independent experiments. Each dot represents the measurement of 1 cell. Data are represented as mean ± SEM. Symbol legends are shown in Figure 3A,F.
Figure 4.
Figure 4.
Mitochondria and mitochondrial function in MSPCs (p4) from 5-FU-treated O5AΔ/Δ and control mice. (A-B) Graphs showing 1 experiment out of 2 as an example for extracellular acidification rate (ECAR) (A) and OXPHOS levels measured by oxygen consumption rates (OCR) (B), in cultured MSPCs, respiration maximum (right panel) is shown for MSPCs from both experiments; oligo, oligomycin; FCCP, p-trifluoromethoxyphenylhydrazone; R&A, rotenone and antimycin. (C) Fluorescent microscopy images and intensity of reactive oxygen species (ROS = DCFDA, green) levels and DAPI (blue) in MSPCs. Graph showing pixel intensity measured by ImageJ software. (D) Fluorescent microscopy images and diameter of mitochondria designated as feret's diameter measured by ImageJ software (MitoTrackerRed, red) and DAPI (blue) in MSPCs. (E) Fluorescent microscopy images of mitochondria (TOMM20) in MSPCs illustrated as relief image (Adobe Photoshop: v21.1.1/filter relief) and diameter of mitochondria designated as feret's diameter measured by ImageJ software. Scale bars, 10 µm. *P < .05 (nonparametric Mann-Whitney test; A-E). The results of each panel represent 2 or 3 independent experiments. Data are represented as mean ± SEM. Open symbols and bars represent measurements of control (5Afl/fl and O5A+/+). Closed symbols and bars represent measurements of O5AΔ/Δ MSPCs. Symbol legend shown in Figure 4A.
Figure 5.
Figure 5.
Actin- and CDC42-dependent autophagy in O5AΔ/Δ and human MSPCs. Mouse samples: (A) IP injection of 5-FU in the following genotypes: CTRL: O5A+/+ n = 5, 5Afl/fl n = 7 and O5AΔ/Δ n = 10. Analysis of cytoskeleton-associated proteins and autophagy in compact bone-derived MSPCs, isolated 8 days after 5-FU-treatment and cultured until passage 4. (B) Fluorescent microscopy images of F-actin (Phalloidin/green) and DAPI (blue) staining. The graph shows the results of stress fiber formation in pooled MSPCs of 3 independent experiments. (C) Fluorescent microscopy images of CDC42-GTP in MSPCs illustrated as relief image (Adobe Photoshop: v21.1.1/filter relief). Graphs showing the total pixel intensity of CDC42-GTP (left panel) and the cell edge (right panel) as measured by ImageJ software. (D) Confocal images of CDC42-GTP (green), LC3 (red), and DAPI (blue) in MSPCs. Colocalization was measured by ImageJ software (plugin colocalization) and visualized in white. The graph shows the measurement of colocalization in pooled MSPCs. (E) Fluorescent microscopy images of F-actin (Phalloidin/green) and LC3 (red) in MSPCs. Colocalization was measured by ImageJ software (plug-in: colocalization) and visualized in white. Human samples: (F) Fluorescent microscopy images of cultured human MSPCs (P2) from healthy young donors and SDS patients. Fluorescent staining of WNT5A (green, left), F-actin (green, middle), CDC42-GTP (red, middle), DAPI staining (blue, left and middle), and colocalization of LAMP1 (green, right) and LC3 (red, right) measured by ImageJ software. (G) Graphs showing the protein content of WNT5A (left) and CDC42-GTP (right). (H) Evaluation of the orientation of F-actin stress fibers stained with phalloidin. Cells showing intermediate orientation (for instance, at the cell edge only) or no orientation were taken together (see supplemental Methods). (I) LAMP1 staining (left) and colocalization pixels of LAMP1 and LC3 (right) in MSPCs (P2) from healthy young individuals, n = 7, healthy aged individuals, n = 7, samples from hypocellular BM patients (P_1-3; see supplemental Table 2 for details), n = 3, SDS patients (P_7-9; see supplemental Table 2 for details), n = 3 and post-allo-HSCT patients (P_4-6; see supplemental Table 2 for details), n = 3. Scale bars 10 µm. *P < .05 (nonparametric Mann-Whitney test: B-E,G-I). The results represent 2 to 3 independent experiments. Data are represented as mean ± SEM. Symbol legends shown in Figure 5A and underneath Figure 5H-I.
Figure 6.
Figure 6.
Attenuation of elevated CDC42 activity ensures survival. (A) Serial IP injection of 5-FU in the following genotypes: CTRL: O5A+/+ n = 6, 5Afl/fl n = 7 and O5AΔ/Δ n = 7 at day 0 and day 8. Additional in vivo IP injection of CDC42-GTP inhibitor CASIN at day 5 through day 8. Analysis of animal survival, hematopoiesis (BM from 4 flushed long bones), and compact bone-derived MSPCs at day 14. (B) Percentage of mice survival after serial 5-FU treatment. Graph shows the survival curve of CTRL and O5AΔ/Δ mice treated with CASIN (+) or vehicle (-). (C) Graph shows the total BM cell number (left) and relative number of LSK cells (middle) and MPs (right) at day 14 of CTRL mice with vehicle ([-]; O5A+/+ n = 6, 5Afl/fl n = 7), O5AΔ/Δ mice with vehicle ([-]; n = 5, mice analyzed shortly before death) and O5AΔ/Δ mice with CASIN ([+]; n = 5). (D,F,H,J) Representative contour plots from BM populations. Graphs show relative number of LT-HSCs and ST-HSCs (E-F), T cells and B cells (G-H), and Gr1+ myeloid cells (I-J). *P < .05 (nonparametric Mann-Whitney test: C,E,G,I). The results represent 2 to 3 independent experiments. Data are represented as mean ± SEM. Symbol legend shown in Figure 6A.
Figure 7.
Figure 7.
Attenuation of elevated CDC42 activity during auto/mitophagy. (A) IP injection of 5-FU in O5AΔ/Δ mice at day 0. Additional in vivo IP injection of vehicle ([-], n = 5) or CASIN ([+], n = 4) at day 5 through day 8. Rescue and analysis of autophagy relevant mechanisms in compact bone-derived MSPCs, isolated at day 8 and cultured until passage 4. (A-G) Shown are the results of O5AΔ/Δ mice with vehicle (-) and CASIN (+) treatment. CASIN-treated mice show the same phenotype as the control groups 5Afl/fl and O5A+/+ (Figure 3). (B) Fluorescent microscopy images of LC3 (red) and DAPI (blue) staining. Graph shows the pixel intensity as measured by ImageJ software. (C) Fluorescent microscopy image of CDC42-GTP (green), LC3 (red), and DAPI (blue) staining. The graph shows the percentage of MSPCs with colocalization measured by ImageJ software (plugin colocalization) and visualized in white. (D) Fluorescent microscopy images of F-actin (Phalloidin/green) and LC3 (red) in MSPCs. Colocalization was measured by ImageJ software (plug-in colocalization) and visualized in white. The graph shows colocalization counted with ImageJ software. (E) Fluorescent microscopy images of LAMP1 (green) and DAPI (blue) staining. The pixel intensity (left graph) and feret’s diameter (right graph) were measured by ImageJ software. (F) Fluorescent microscopy images of LAMP1 (green), LC3 (red), and DAPI (blue) staining. Yellow arrows show colocalized vesicle staining, red arrows depict LC3+ vesicles that did not colocalize with green LAMP1+ vesicles. Perinuclear colocalization of LAMP1 and LC3 measured by ImageJ software (plugin colocalization, depicted in white). (G) Representative FACS plots and quantification (graph) of Cyto-ID dye levels (DMFI: Cyto-ID dye level chloroquine treated, Cyto-ID dye level w/o treatment). (H) Fluorescent microscopy images of TOMM20 (green), LC3 (red), and DAPI (blue) staining. Colocalization was measured by ImageJ software (plugin colocalization) and visualized in the bottom row in white. Scale bars, 10 µm. *P < .05 (2-sided parametric Student’s t test; B-H). The results represent 2 independent experiments. Data are represented as mean ± SEM. Symbol legend shown in Figure 7A.

Comment in

References

    1. Pronk E, Raaijmakers MHGP. The mesenchymal niche in MDS. Blood. 2019;133(10):1031-1038. - PubMed
    1. Lin H, Sohn J, Shen H, Langhans MT, Tuan RS. Bone marrow mesenchymal stem cells: aging and tissue engineering applications to enhance bone healing. Biomaterials. 2019;203:96-110. - PMC - PubMed
    1. Weickert MT, Hecker JS, Buck MC, et al. . Bone marrow stromal cells from MDS and AML patients show increased adipogenic potential with reduced Delta-like-1 expression. Sci Rep. 2021;11(1):5944. - PMC - PubMed
    1. Hinge A, He J, Bartram J, et al. . Asymmetrically segregated mitochondria provide cellular memory of hematopoietic stem cell replicative history and drive HSC attrition. Cell Stem Cell. 2020; 26(3):420-430.e6. - PMC - PubMed
    1. Ho TT, Warr MR, Adelman ER, et al. . Autophagy maintains the metabolism and function of young and old stem cells. Nature. 2017;543(7644):205-210. - PMC - PubMed

Publication types

LinkOut - more resources