. 2022 May 4;24(5):694-707.
doi: 10.1093/neuonc/noab244.

Anti-invasive efficacy and survival benefit of the YAP-TEAD inhibitor verteporfin in preclinical glioblastoma models

Affiliations

Anti-invasive efficacy and survival benefit of the YAP-TEAD inhibitor verteporfin in preclinical glioblastoma models

Anne Marie Barrette et al. Neuro Oncol. .

Abstract

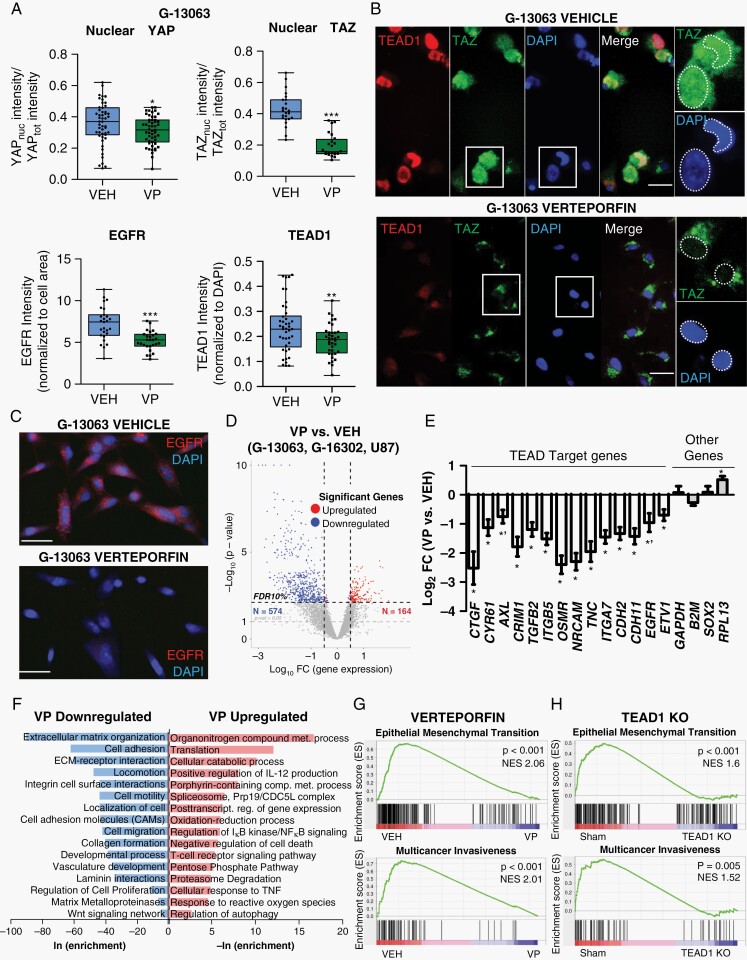
Background: Glioblastoma (GBM) remains a largely incurable disease as current therapy fails to target the invasive nature of glioma growth in disease progression and recurrence. Here, we use the FDA-approved drug and small molecule Hippo inhibitor Verteporfin (VP) to target YAP-TEAD activity, known to mediate convergent aspects of tumor invasion/metastasis, and assess the drug's efficacy and survival benefit in GBM models.

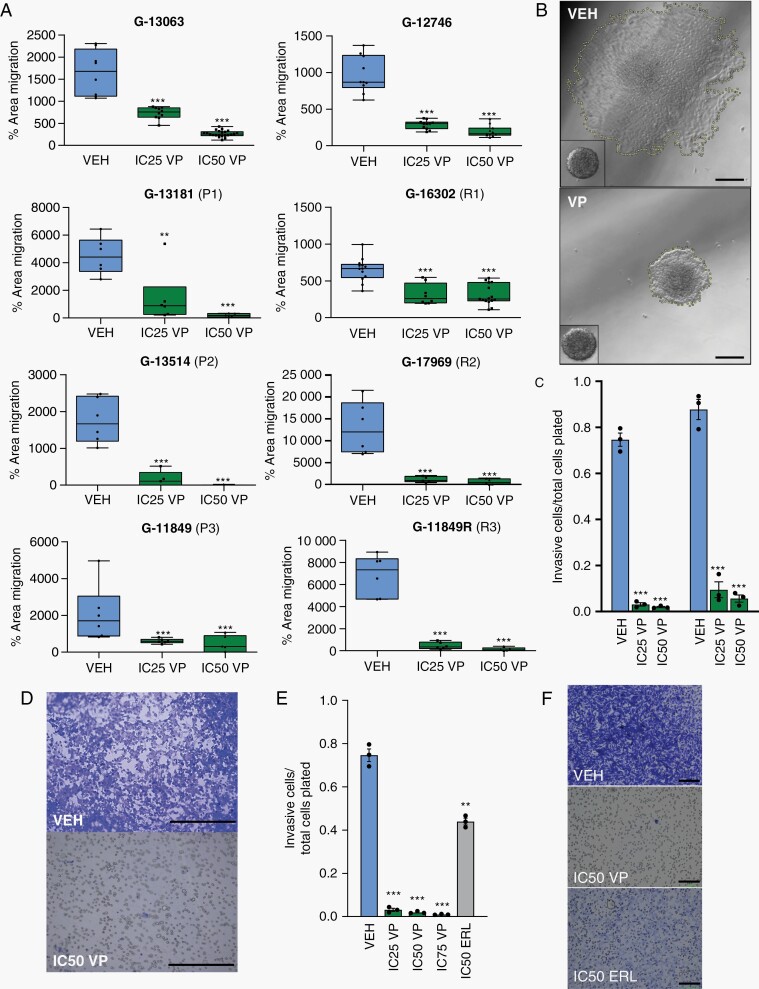
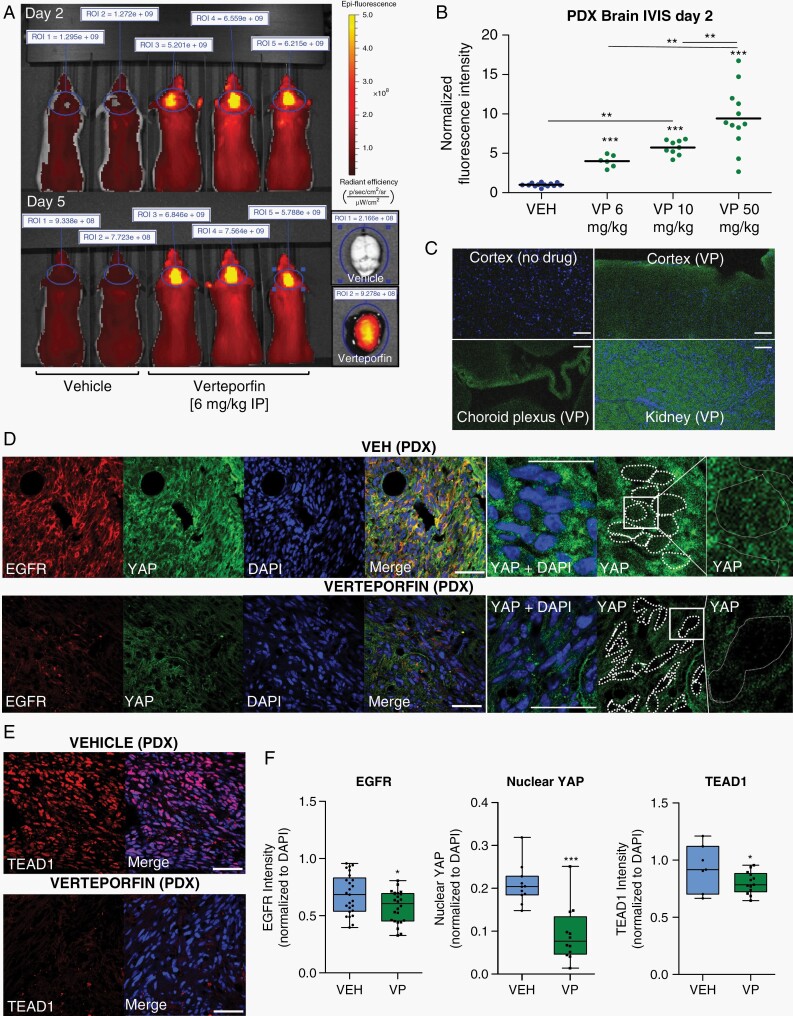
Methods: Up to 8 low-passage patient-derived GBM cell lines with distinct genomic drivers, including 3 primary/recurrent pairs, were treated with VP or vehicle (VEH) to assess in vitro effects on proliferation, migration, invasion, YAP-TEAD activity, and transcriptomics. Patient-derived orthotopic xenograft (PDX) models were used to assess VP's brain penetrance and effects on tumor burden and survival.

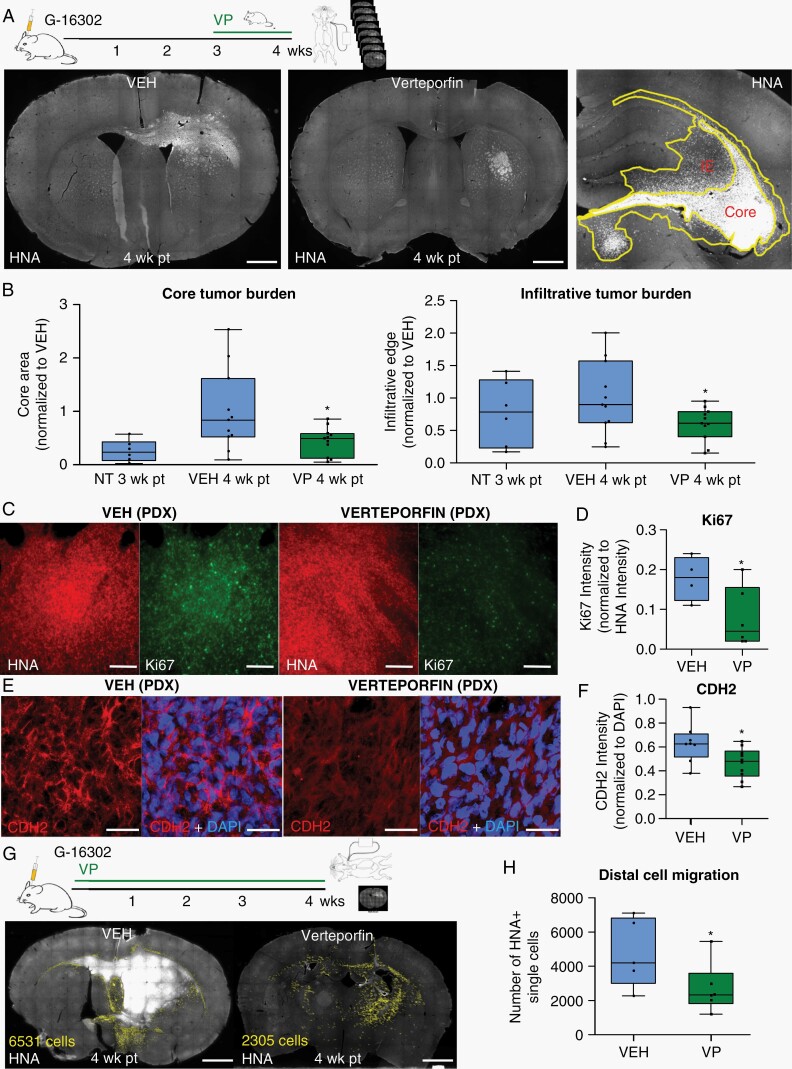
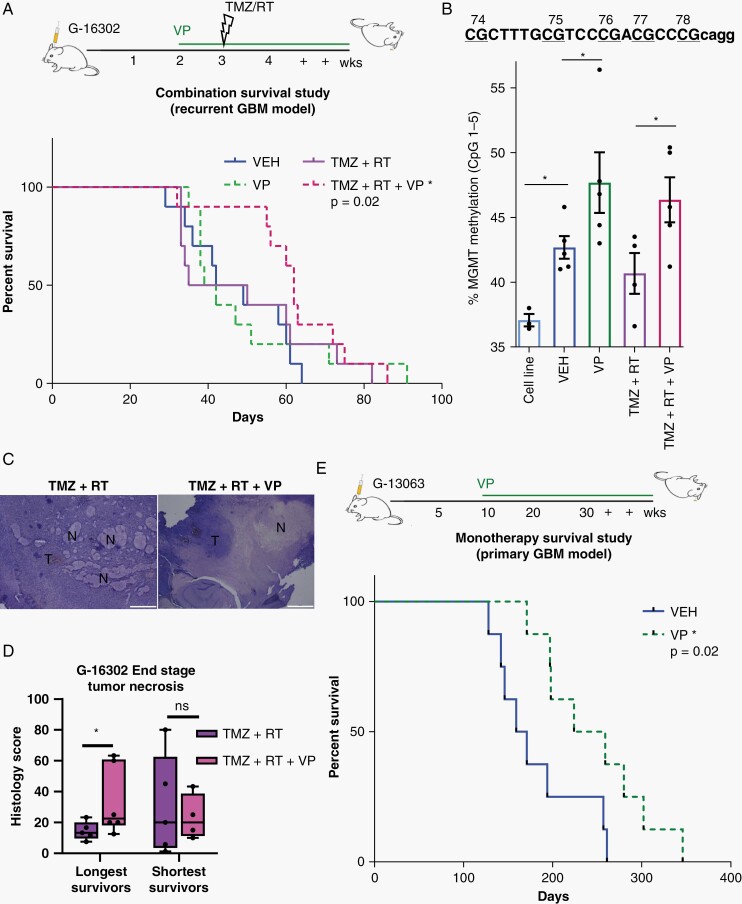
Results: VP treatment disturbed YAP/TAZ-TEAD activity; disrupted transcriptome signatures related to invasion, epithelial-to-mesenchymal, and proneural-to-mesenchymal transition, phenocopying TEAD1-knockout effects; and impaired tumor migration/invasion dynamics across primary and recurrent GBM lines. In an aggressive orthotopic PDX GBM model, short-term VP treatment consistently diminished core and infiltrative tumor burden, which was associated with decreased tumor expression of Ki67, nuclear YAP, TEAD1, and TEAD-associated targets EGFR, CDH2, and ITGB1. Finally, long-term VP treatment appeared nontoxic and conferred survival benefit compared to VEH in 2 PDX models: as monotherapy in primary (de novo) GBM and in combination with Temozolomide chemoradiation in recurrent GBM, where VP treatment associated with increased MGMT methylation.

Conclusions: We demonstrate combined anti-invasive and anti-proliferative efficacy for VP with survival benefit in preclinical GBM models, indicating potential therapeutic value of this already FDA-approved drug if repurposed for GBM patients.

Keywords: Verteporfin; YAP-TEAD; invasion; migration; preclinical.


Figures

Fig. 1
Fig. 1
Verteporfin downregulates YAP/TAZ-TEAD activity and transcriptomes related to adhesion, EMT, and invasion in GBM. (A) Immunocytochemistry analysis of subcellular expression of TAZ, YAP, TEAD1, and the TEAD1-target EGFR after 3-day treatment with Verteporfin (VP) (IC50 dose) vs vehicle (VEH) in G-13063 cells; *P = .017 (YAP), ***P = .0001 (TAZ), **P = 0.0046 (TEAD1), ***P = .00001 (EGFR) by Student t test; n = 24-51 images (dots) in 2-5 wells/condition; lines in box-and-whisker plots represent mean and bars represent min/max. See also Supplementary Figure 2. (B) Representative images of TAZ and TEAD1 from part A. Scale bars = 25 µm. (C) Representative images of EGFR from part A. Scale bars = 50 µm. (D) Volcano plot of differential expression RNA-seq data from 3 biologically distinct GBM lines (G-13063, G-16302, U87) treated with VP (IC50 dose) vs VEH for 3 days. Defined set of 574 downregulated and 164 upregulated genes are marked by blue and red dots, respectively (10% false discovery rate [FDR] adjustment). (E) TEAD-target gene expression in the differential RNA-seq dataset from (D) (*P < .05 and *'P < .1 by Student t test; n = 3 cell lines; bars represent mean ± SEM). (F) Functional enrichment analysis on the differential sets of genes from part (D) (log2-fold change >0.5 and <-0.5) against several gene set databases, HOMER tool. Shown are selected top enriched biological processes, pathways, and reactomes of downregulated (blue) or upregulated (red) VP-associated genes (see Supplementary Data 1 for full list). (G) Gene Set Enrichment Analysis (GSEA) of the predefined signature gene sets “HALLMARK EPITHELIAL MESENCHYMAL TRANSITION” (M5930) and “Multicancer Invasiveness”  in the VP/VEH rld normalized RNA-seq dataset. (H) GSEA analysis of rld normalized RNA-seq dataset from CRISPR/Cas9 TEAD1 knockout cell lines vs sham (G-13063, G-16302, G-12746, and G-13306 cell lines), phenocopying the enrichment pattern seen in VP-treated cells. Abbreviations: EMT, epithelial-mesenchymal transition; GBM, glioblastoma; NES, normalized enrichment score.
Fig. 2
Fig. 2
Verteporfin decreases tumor migration in vitro across primary and recurrent GBMs. (A) Dose-dependent effect of Verteporfin on spheroid dispersion/confluent cell migration, across 8 biologically distinct GBM lines, including 3 primary (P1-P3) and recurrent (R1-R3) pairs (n = 3 wells (dots) with multiple spheres/well, 2 independent experiments for G-13063 and G-16302; lines in box and whisker plots represent the mean spheroid area at 36 h after treatment, bars represent min/max). (B) Area of spheroid migration in representative G-13063 cells at 36 h of treatment with VEH or IC50 VP, marked by yellow dash line; inset shows spheroid at 1 h. Scale bars = 75 µm. (C) Dose-dependent effect of Verteporfin on transwell invasion. Dead cells are discarded prior to transwell plating and live cell number is measured using crystal violet (n = 3 wells (dots) per condition for each line). (D) Representative images of transwell membranes were analyzed in (C). Scale bars = 50 µm. (E) Identical transwell invasion assays to part (C) comparing effect of invasion in G-13063 cells treated with VEH, VP, or ERL (n = 3 wells (dots) per condition). (F) Representative images of transwell membranes from (E). Scale bars = 100 µm. (*P < .05, **P < .01, ***P < .001 by Student t test; dose-dependence confirmed by ANOVA (P < .05); C, E: bars represent mean ± SEM). Abbreviations: ERL, Erlotinib; GBM, glioblastoma; VEH, vehicle; VP, Verteporfin.
Fig. 3
Fig. 3
Brain accumulation and YAP-TEAD activity of Verteporfin in PDX tumors. (A) IVIS imaging in anesthetized littermate G-16302 PDX mice 2 h after VP administration on days 2 and 5 (6 mg/kg IP), measured at 605 nm/700 nm excitation/emission. On right, brain organ fluorescence at necropsy 2.5 h after treatment, day 5. Regions of interest (ROI) for intensity measurements are marked by blue lines. (B) Dose-dependent accumulation of VP-associated fluorescence in G-16302 PDX brains, normalized IVIS data over multiple experiments; ***P < .0001 (VEH) vs 6 mg/kg/10 mg/kg/50 mg/kg (VP); **P = .0011 6 mg/kg (VP) vs 10 mg/kg (VP); **P = .0069 10 mg/kg (VP) vs 50 mg/kg (VP) by Student t test; dose-dependence also significant by 1-way ANOVA, P < .0001; n = 13 (VEH), 6 (6 mg/kg VP), 9 (10 mg/kg VP),12 (50 mg/kg VP) PDX mice (dots); lines in plot represent mean. All IVIS measurements are performed using identical settings on day 2 of treatment, ~2 h after drug administration. (C) Accumulation of VP-associated autofluorescence (green) throughout the brain parenchyma, including outside cerebral vessels, assessed by epifluorescence microscopy (kidney shown as positive control and choroid plexus shows relative accumulation in vasculature (10 mg/kg intravenous VP, 2 h). Scale bars = 50 µm. (D, E) Representative immunofluorescence images of EGFR and YAP (D) and TEAD1 (E) expression in the core of G-16302 PDX tumors after VP treatment (100 mg/kg IP, 10 days). Scale bars = 50 µm. (F) Quantification of normalized intensity for TEAD1’s target EGFR, nuclear YAP, and TEAD1 in tumor core, using single confocal plane images; *P = .01 (EGFR), *P = .03 (TEAD1), ***P < .0001 (nuclear YAP) by 1-tailed unpaired Student t test, n = 6 mice (EGFR) and n = 4 mice (TEAD1) with multiple fields scored; lines in box-and-whisker plots represent mean and bars represent min/max. Abbreviations: IP, intraperitoneally; PDX, patient-derived orthotopic xenograft; VEH, vehicle; VP, Verteporfin.
Fig. 4
Fig. 4
Verteporfin decreases infiltrative tumor burden in aggressive PDX tumors. (A) Experimental setup and representative histological sections of infiltrative G-16302 PDX tumors at 4-week post-transplantation (wk pt) treated with vehicle or Verteporfin (100 mg/kg IP, days 21-30). Tumors are stained with human nuclear antigen (HNA). “Core” is defined as tumor area near the injection site with highest tumor density (>100 HNA+/HNA− cells) and “infiltrative edge” (IE) is defined as adjacent tumor area of lower tumor density (~50-100 HNA+/HNA− cells) and confluent tumor spread, marked by yellow lines. Scale bar = 1 mm. (B) Quantification of PDX tumor burden area within the tumor “core” and “infiltrative edge” in 8 serial histological sections per mouse, 4-wk pt and VEH/VP treatment and 3-wk pt with no treatment (NT) (*P = .0161; n = 11 mice (dots) per condition from 2 combined experiments, normalized to average VEH tumor burden area; similar results observed in 3 independent experiments). (C, D) Representative histological images (C) and quantifications (D) of Ki67 tumor core intensity normalized to HNA (10 mg/kg IP VP administration days 1-28; *P = .027; n = 6 (VP) and n = 4 (VEH)-treated G-16302 PDX mice (dots)). Scale bars = 100 µm. (E, F) Representative immunofluorescence images (E) and quantification (F) of CDH2 expression in VP/VEH-treated PDX tumors (10 mg/kg IP days 1-28 and 100 mg/kg IP days 21-30; *P = .0136; n = 4 G-16302 PDX mice (dots) per condition). Scale bars = 30 µm. (G, H) Representative images (G) and quantifications (H) of single migratory HNA+ tumor cells (annotated in yellow) away from the core and infiltrative edge in PDX mice with early Verteporfin treatment regimen (10 mg/kg IP days 1-28) (*P = .04; n = 6 G-16302 PDX mice (dots) per condition, section with largest tumor burden annotated for each). Scale bars = 1 mm. See also Supplementary Figure 5F. For parts B, D, F, and H, lines in box-and-whisker plots represent mean and bars represent min/max; P-values determined by Student t test. Abbreviations: IP, intraperitoneally; PDX, patient-derived orthotopic xenograft; VEH, vehicle; VP, Verteporfin.
Fig. 5
Fig. 5
Verteporfin survival studies in primary and recurrent GBM models. (A) Experimental setup (top) and Kaplan-Meier survival analysis (bottom) of Verteporfin treatment alone or in combination with standard chemoradiation therapy, Temozolomide plus Radiation (TMZ + RT) in the recurrent GBM G-16302 PDX model, gender-matched (VP = 10 mg/kg IP beginning on day 14, TMZ = 5 mg/kg days 21-22, two fractions of whole brain 3Gy RT days 21-22). Combined VP + TMZ + RT treatment confers survival benefit over vehicle (*P = .02 VP + TMZ + RT vs VEH; P = .72 VP vs VEH; P = .55 TMZ + RT vs VEH; P = .76 TMZ + RT vs VP; P = .26 VP + TMZ + RT vs VP; P = .23 VP + TMZ + RT vs TMZ + RT; chi-square log-rank test; n = 9 mice/treatment condition, median survival 45.5/40.5/42.5/62 days for VEH/VP/TMZ + RT/VP + TMZ + RT, respectively). (B) DNA methylation analysis of human MGMT comparing cell line (G-16302, n = 3 technical replicates (dots)) and the survival cohorts of G-16302 PDX tumors at end stage (n = 5 PDX mice (dots) per treatment group, *P < .05 by Student t test). (C) Representative hematoxylin and eosin (H&E) images of tumor necrosis in PDX tumors of TMZ + RT and TMZ + RT + VP-treated mice. Scale bar = 1 mm. T, tumor; N, necrosis. (D) Pathological scoring of percentage necrosis stratified into 2 groups based on longest and shortest survival (n = 10 mice (dots) per treatment group, 2-4 sections per mouse, *P < .05 by Student t test, lines in box-and-whisker plots represent mean, bars represent min/max; ns, not significant). (E) Experimental setup (top) and Kaplan-Meier survival analysis (bottom) of Verteporfin vs vehicle treatment in G-13063 orthotopic PDX mice (*P = .02 by chi-square log-rank test; n = 9 mice/treatment condition, median survival 171/211 days for VEH/VP, respectively; tumors confirmed in all mice included in the analysis). Abbreviations: GBM, glioblastoma; PDX, patient-derived orthotopic xenograft; RT, radiation therapy; TMZ, Temozolomide; VEH, vehicle; VP, Verteporfin.

Comment in

References

    1. Brat DJ, Castellano-Sanchez AA, Hunter SB, et al. Pseudopalisades in glioblastoma are hypoxic, express extracellular matrix proteases, and are formed by an actively migrating cell population. Cancer Res. 2004;64(3):920–927. - PubMed
    1. Xie Q, Mittal S, Berens ME. Targeting adaptive glioblastoma: an overview of proliferation and invasion. Neuro Oncol. 2014;16(12):1575–1584. - PMC - PubMed
    1. Cooper LA, Gutman DA, Chisolm C, et al. The tumor microenvironment strongly impacts master transcriptional regulators and gene expression class of glioblastoma. Am J Pathol. 2012;180(5):2108–2119. - PMC - PubMed
    1. Darmanis S, Sloan SA, Croote D, et al. Single-cell RNA-seq analysis of infiltrating neoplastic cells at the migrating front of human glioblastoma. Cell Rep. 2017;21(5):1399–1410. - PMC - PubMed
    1. Zhong J, Paul A, Kellie SJ, Neill GMO. Mesenchymal migration as a therapeutic target in glioblastoma. J Oncol. 2010;2010:430142. - PMC - PubMed

Publication types