

Intrinsic Defects in B Cell Development and Differentiation, T Cell Exhaustion and Altered Unconventional T Cell Generation Characterize Human Adenosine Deaminase Type 2 Deficiency
- PMID: 34657246
- PMCID: PMC8604888
- DOI: 10.1007/s10875-021-01141-0
Intrinsic Defects in B Cell Development and Differentiation, T Cell Exhaustion and Altered Unconventional T Cell Generation Characterize Human Adenosine Deaminase Type 2 Deficiency
Abstract
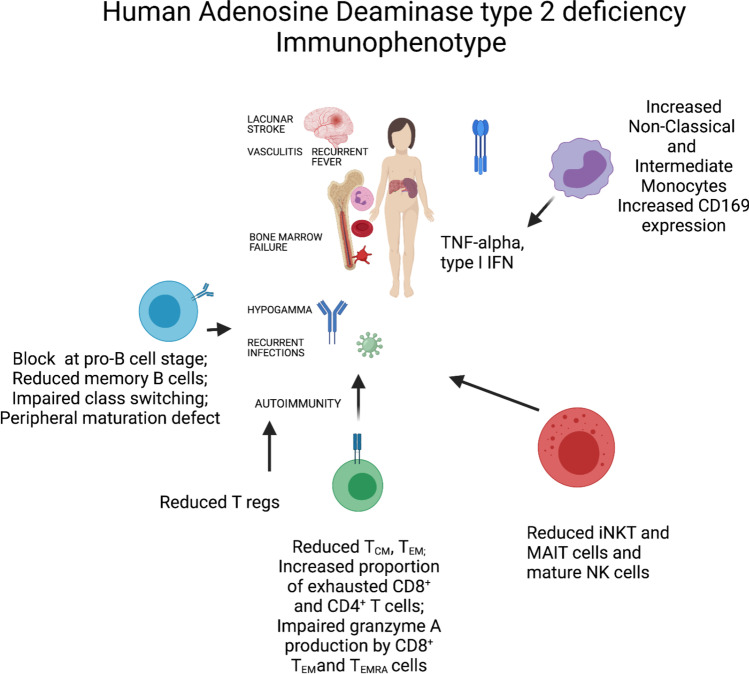
Purpose: Deficiency of adenosine deaminase type 2 (ADA2) (DADA2) is a rare inborn error of immunity caused by deleterious biallelic mutations in ADA2. Clinical manifestations are diverse, ranging from severe vasculopathy with lacunar strokes to immunodeficiency with viral infections, hypogammaglobulinemia and bone marrow failure. Limited data are available on the phenotype and function of leukocytes from DADA2 patients. The aim of this study was to perform in-depth immunophenotyping and functional analysis of the impact of DADA2 on human lymphocytes.
Methods: In-depth immunophenotyping and functional analyses were performed on ten patients with confirmed DADA2 and compared to heterozygous carriers of pathogenic ADA2 mutations and normal healthy controls.
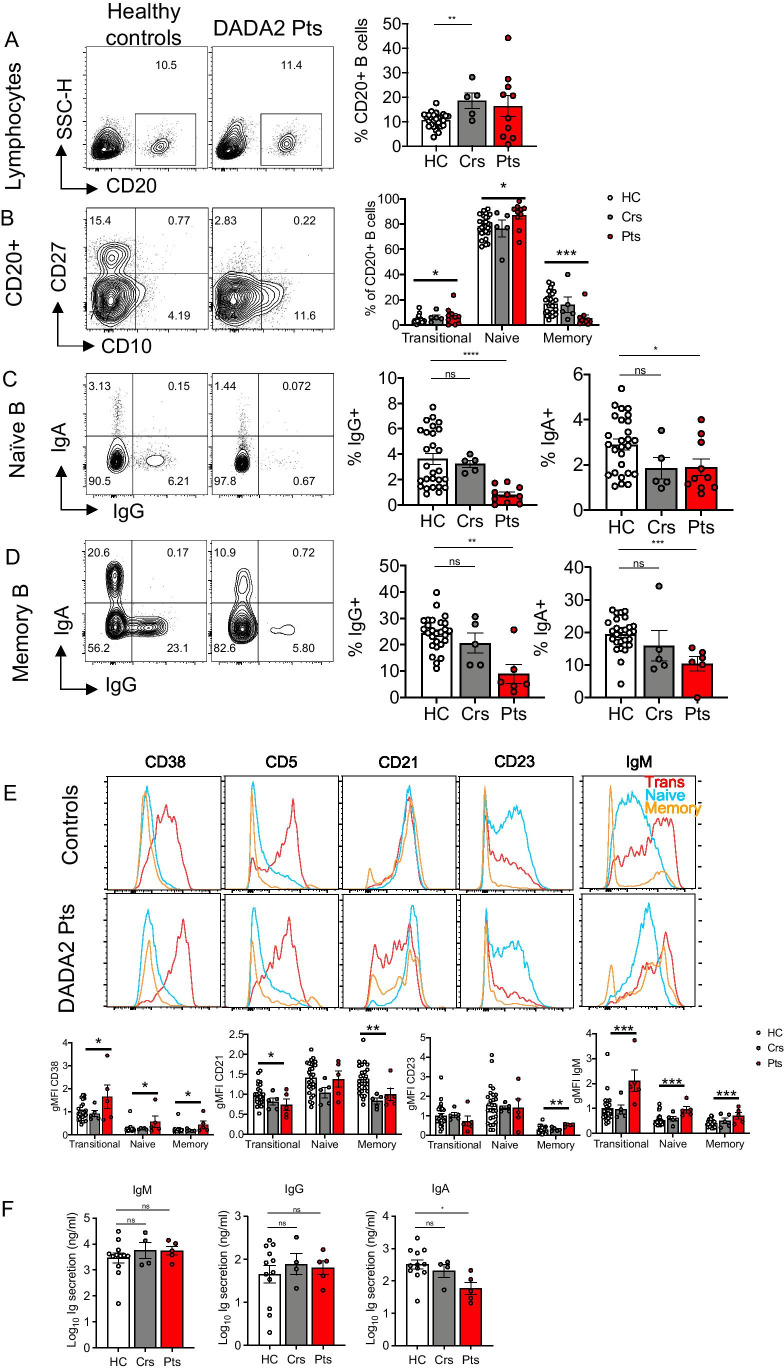
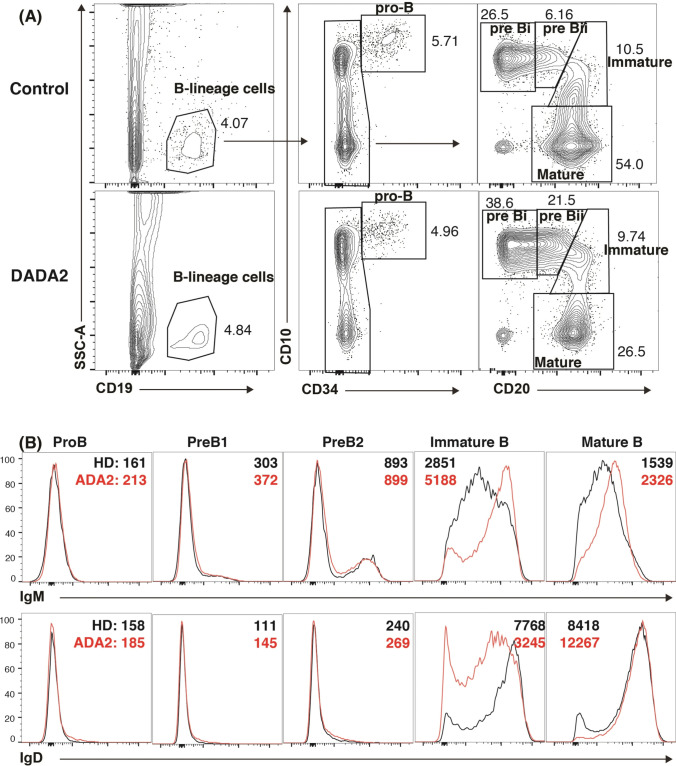
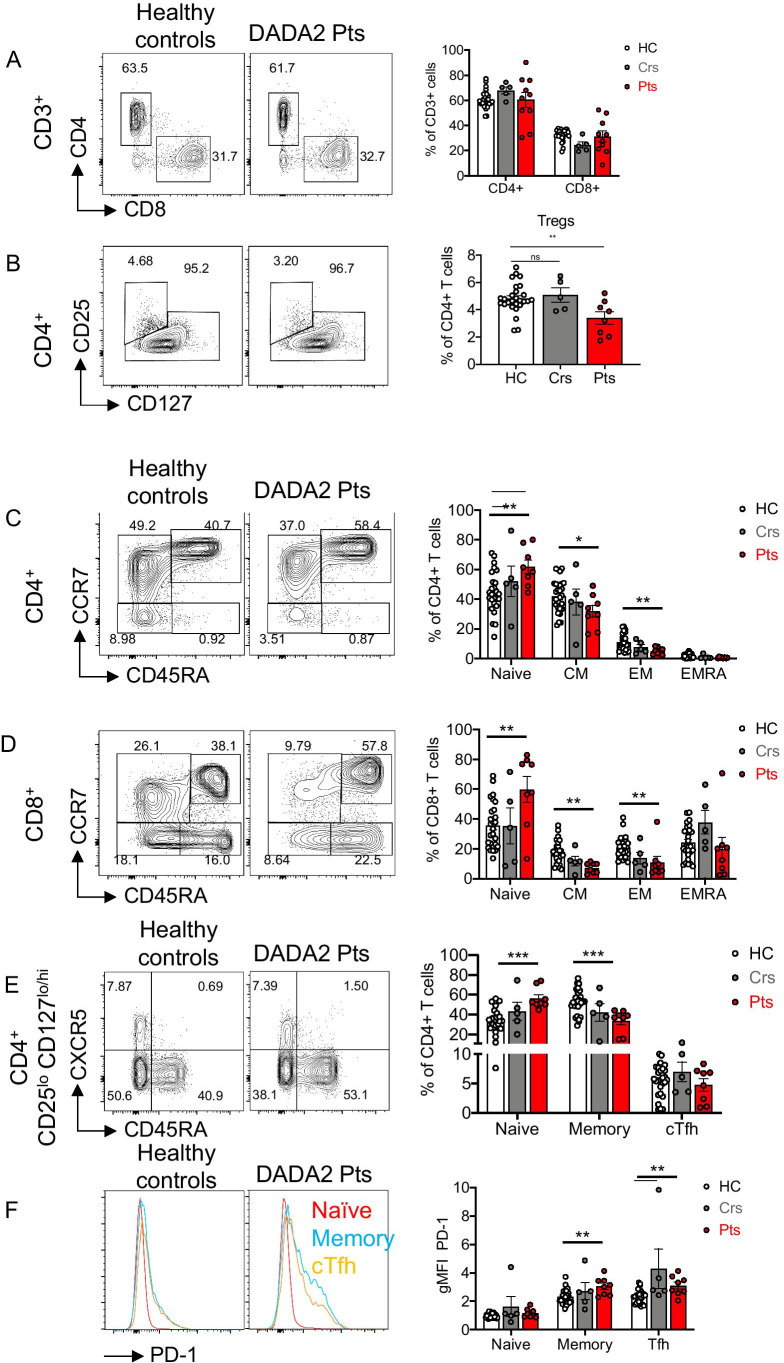
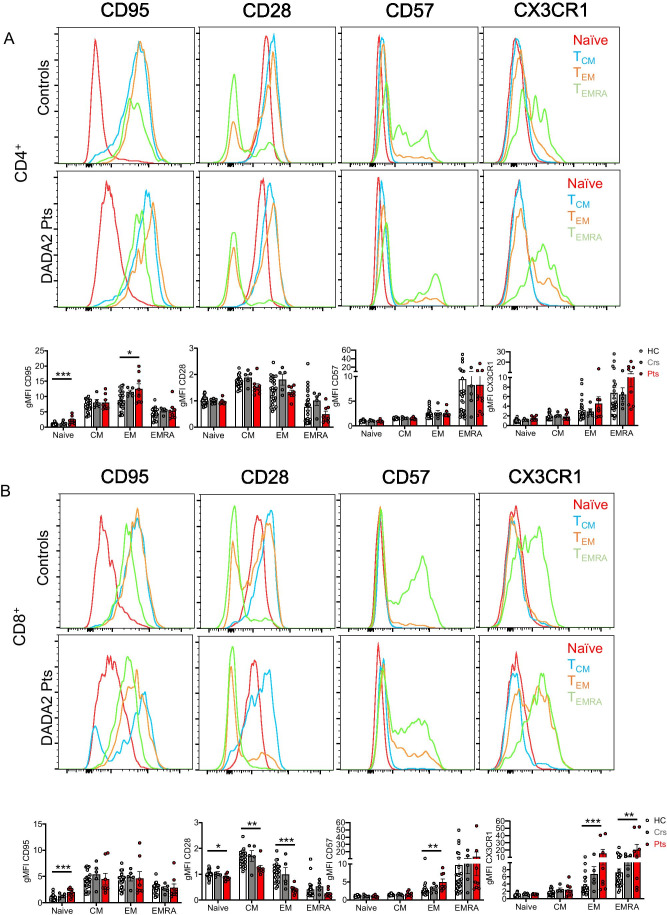
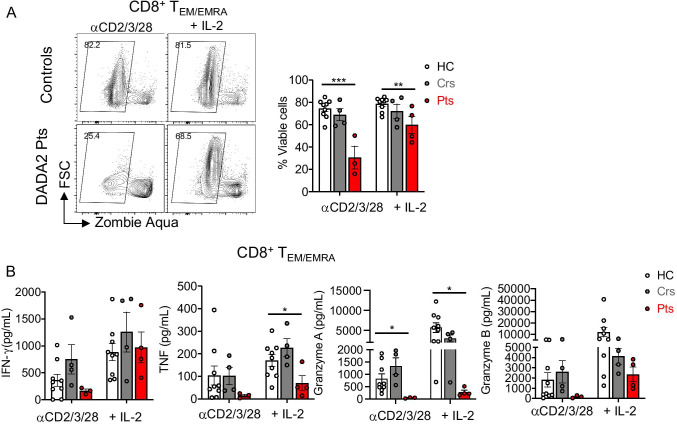
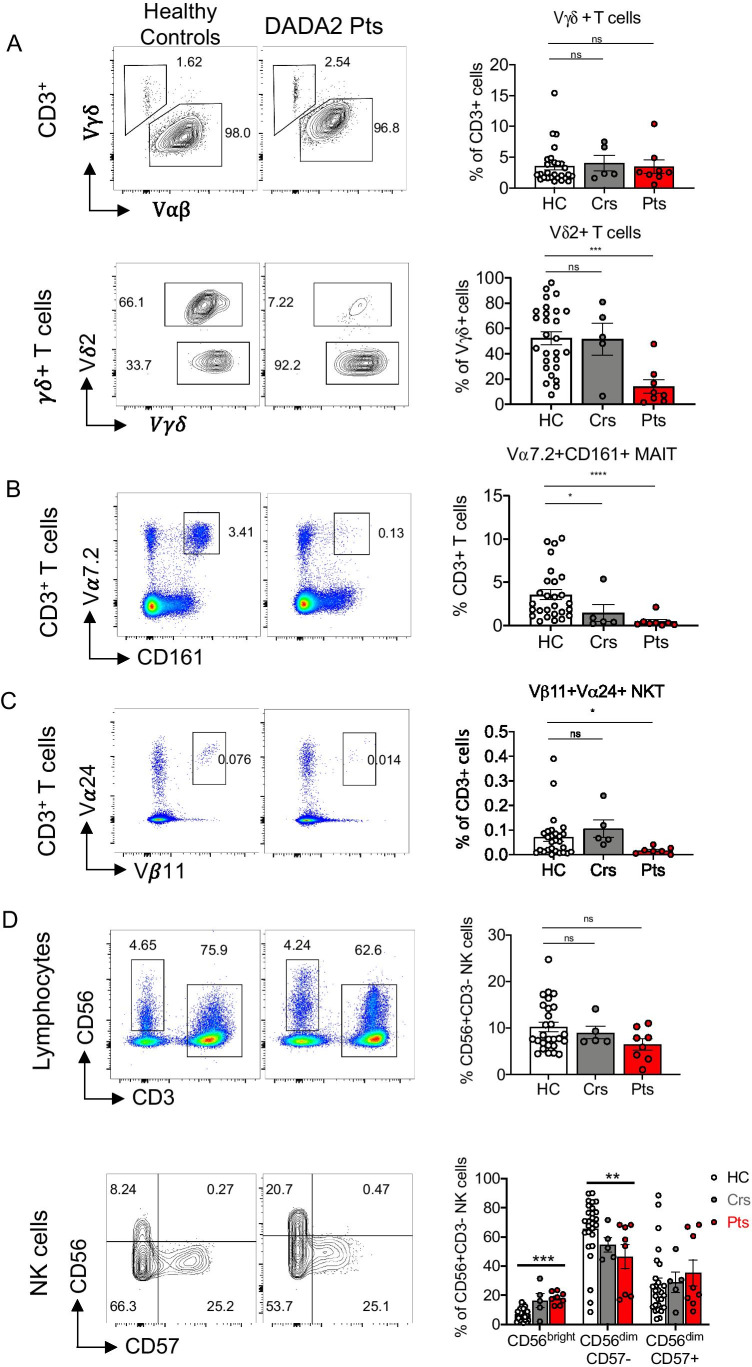
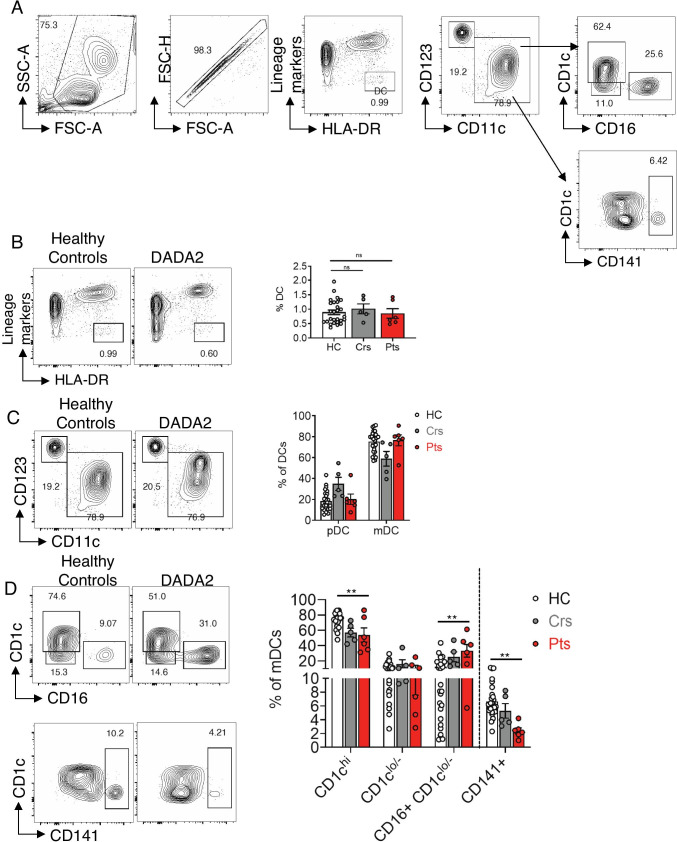
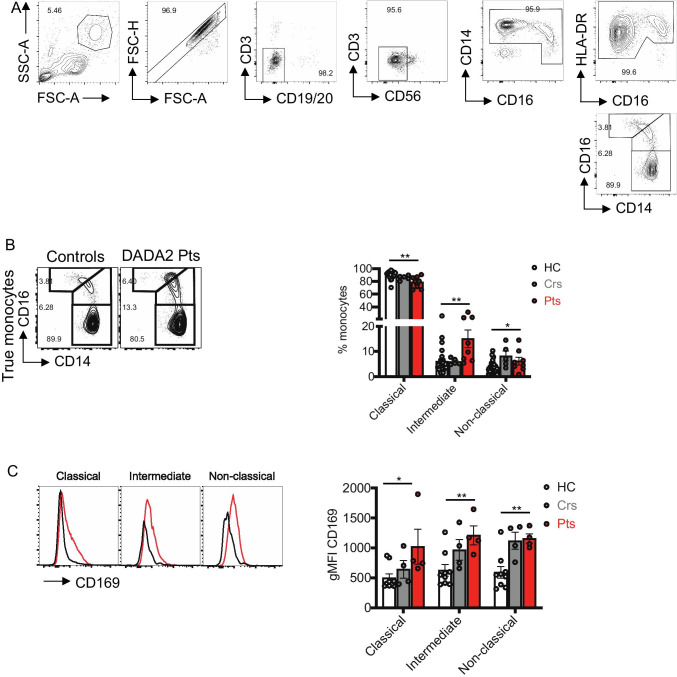
Results: The median age of the patients was 10 years (mean 20.7 years, range 1-44 years). Four out of ten patients were on treatment with steroids and/or etanercept or other immunosuppressives. We confirmed a defect in terminal B cell differentiation in DADA2 and reveal a block in B cell development in the bone marrow at the pro-B to pre-B cell stage. We also show impaired differentiation of CD4+ and CD8+ memory T cells, accelerated exhaustion/senescence, and impaired survival and granzyme production by ADA2 deficient CD8+ T cells. Unconventional T cells (i.e. iNKT, MAIT, Vδ2+ γδT) were diminished whereas pro-inflammatory monocytes and CD56bright immature NK cells were increased. Expression of the IFN-induced lectin SIGLEC1 was increased on all monocyte subsets in DADA2 patients compared to healthy donors. Interestingly, the phenotype and function of lymphocytes from healthy heterozygous carriers were often intermediate to that of healthy donors and ADA2-deficient patients.
Conclusion: Extended immunophenotyping in DADA2 patients shows a complex immunophenotype. Our findings provide insight into the cellular mechanisms underlying some of the complex and heterogenous clinical features of DADA2. More research is needed to design targeted therapy to prevent viral infections in these patients with excessive inflammation as the overarching phenotype.
Keywords: ADA2 deficiency; DADA2; Humoral immunodeficiency; Monocytes; SIGLEC-1; T cell exhaustion; Type I IFN signature.
© 2021. The Author(s).
Conflict of interest statement
IM holds a CSL Behring Chair, Paid to Institution. All of the other authors have no conflicts of interest to declare.
Figures
Similar articles
-
Dysregulation in B-cell responses and T follicular helper cell function in ADA2 deficiency patients.Eur J Immunol. 2021 Jan;51(1):206-219. doi: 10.1002/eji.202048549. Epub 2020 Aug 28. Eur J Immunol. 2021. PMID: 32707604
-
Deficiency of adenosine deaminase 2 skews adaptive immune repertoires toward specific sets of T- and B-cell receptors.J Allergy Clin Immunol. 2025 May;155(5):1664-1674. doi: 10.1016/j.jaci.2025.01.032. Epub 2025 Feb 7. J Allergy Clin Immunol. 2025. PMID: 39924119
-
A Monogenic Disease with a Variety of Phenotypes: Deficiency of Adenosine Deaminase 2.J Rheumatol. 2020 Jan;47(1):117-125. doi: 10.3899/jrheum.181384. Epub 2019 May 1. J Rheumatol. 2020. PMID: 31043544
-
Getting to know adenosine deaminase 2 deficiency inside and out.J Allergy Clin Immunol. 2025 May;155(5):1451-1463. doi: 10.1016/j.jaci.2025.01.040. Epub 2025 Feb 14. J Allergy Clin Immunol. 2025. PMID: 39956283 Free PMC article. Review.
-
Human ADA2 Deficiency: Ten Years Later.Curr Allergy Asthma Rep. 2024 Sep;24(9):477-484. doi: 10.1007/s11882-024-01163-9. Epub 2024 Jul 6. Curr Allergy Asthma Rep. 2024. PMID: 38970744 Free PMC article. Review.
Cited by
-
Insights into mucosal associated invariant T cell biology from human inborn errors of immunity.Front Immunol. 2022 Dec 22;13:1107609. doi: 10.3389/fimmu.2022.1107609. eCollection 2022. Front Immunol. 2022. PMID: 36618406 Free PMC article. No abstract available.
-
Delayed-onset adenosine deaminase deficiency with a novel synonymous mutation and a case series from China.World J Pediatr. 2023 Jul;19(7):687-700. doi: 10.1007/s12519-023-00729-3. Epub 2023 May 8. World J Pediatr. 2023. PMID: 37154862
-
Case Report: Interindividual variability and possible role of heterozygous variants in a family with deficiency of adenosine deaminase 2: are all heterozygous born equals?Front Immunol. 2023 May 3;14:1156689. doi: 10.3389/fimmu.2023.1156689. eCollection 2023. Front Immunol. 2023. PMID: 37207212 Free PMC article.
-
Development of EBV Related Diffuse Large B-cell Lymphoma in Deficiency of Adenosine Deaminase 2 with Uncontrolled EBV Infection.J Clin Immunol. 2024 May 17;44(5):118. doi: 10.1007/s10875-024-01712-x. J Clin Immunol. 2024. PMID: 38758417 Free PMC article.
-
Filaggrin-Associated Atopic Skin, Eye, Airways, and Gut Disease, Modifying the Presentation of X-Linked Reticular Pigmentary Disorder (XLPDR).J Clin Immunol. 2024 Jan 2;44(1):38. doi: 10.1007/s10875-023-01637-x. J Clin Immunol. 2024. PMID: 38165470
References
-
- Navon Elkan P, Pierce SB, Segel R, Walsh T, Barash J, Padeh S, et al. Mutant adenosine deaminase 2 in a polyarteritis nodosa vasculopathy. N Engl J Med. 2014;370(10):921–931. - PubMed
-
- Hashem H, Egler R, Dalal J. Refractory pure red cell aplasia manifesting as deficiency of adenosine deaminase 2. J Pediatr Hematol Oncol. 2017;39(5):e293–e296. - PubMed
-
- Alabbas F, Elyamany G, Alsharif O, Hershfield M, Meyts I. Childhood Hodgkin Lymphoma: Think DADA2. J Clin Immunol. 2019;39(1):26–29. - PubMed
Publication types
MeSH terms
Substances
Supplementary concepts
LinkOut - more resources
Full Text Sources
Research Materials
