

doi: 10.1161/HYPERTENSIONAHA.121.17643.
Epub 2021 Oct 18.
Knockout of Macula Densa Neuronal Nitric Oxide Synthase Increases Blood Pressure in db/db Mice
Affiliations
- PMID: 34657443
- PMCID: PMC8651058
- DOI: 10.1161/HYPERTENSIONAHA.121.17643
Item in Clipboard
Knockout of Macula Densa Neuronal Nitric Oxide Synthase Increases Blood Pressure in db/db Mice
Hypertension.
2021 Dec.
Abstract
[Figure: see text].
Keywords: diabetes mellitus; glomerular filtration rate; hemodynamics; hypertension; kidney; nitric oxide; nitric oxide synthase.
Figures
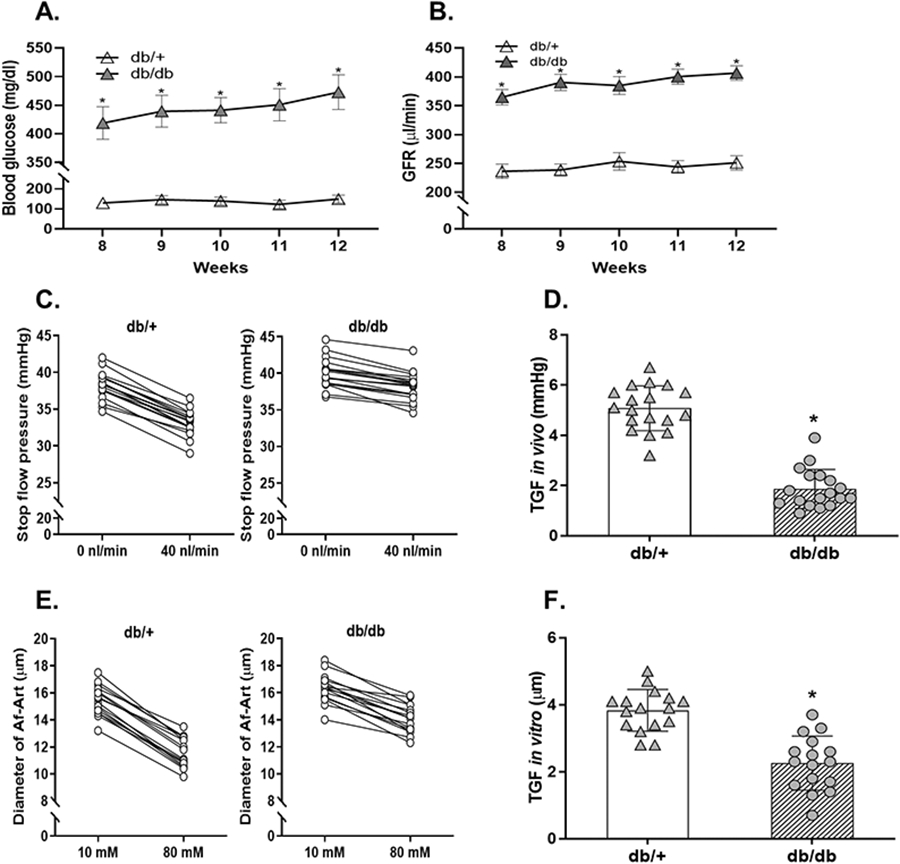
(A) The blood glucose concentration in db/db and db/+ mice. n=12; *P<0.01 vs db/+. (B) The GFR in db/db and db/+ mice. n=10; *P<0.01 vs db/+. (C and D) The TGF response in vivo in db/db and db/+ mice. n=18 tubules/6 mice per group; *P<0.01 vs db/+. (E and F) The TGF response in vitro in Akita and WT mice. n=16 nephrons/group; *P<0.01 vs db/+, *P<0.01 vs db/+. Statistical difference in (A and B) was calculated by two-way repeated measures ANOVA followed by Sidak multiple comparisons test. Statistical difference in (C-F) was calculated by t-test.
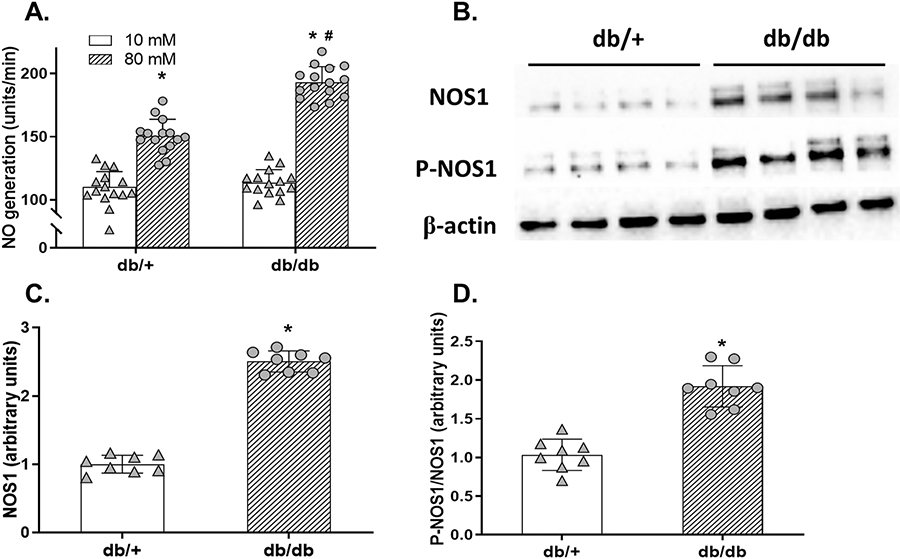
(A) The TGF-induced NO generation at the macula densa in db/db and db/+ mice. n=15; *P<0.01 vs 10 mM, #P<0.01 vs db/+. (B) The immunoblots of renal cortical NOS1, P-NOS1, and loading control of β-actin in db/db and db/+ mice. (C and D) The renal cortical NOS1 and P-NOS1/NOS1 levels in db/db and db/+ mice. n=8; *P<0.01 vs db/+. Statistical difference in (A) was calculated by two-way ANOVA followed by Sidak multiple comparisons test. Statistical difference in (C-D) was calculated by t-test.
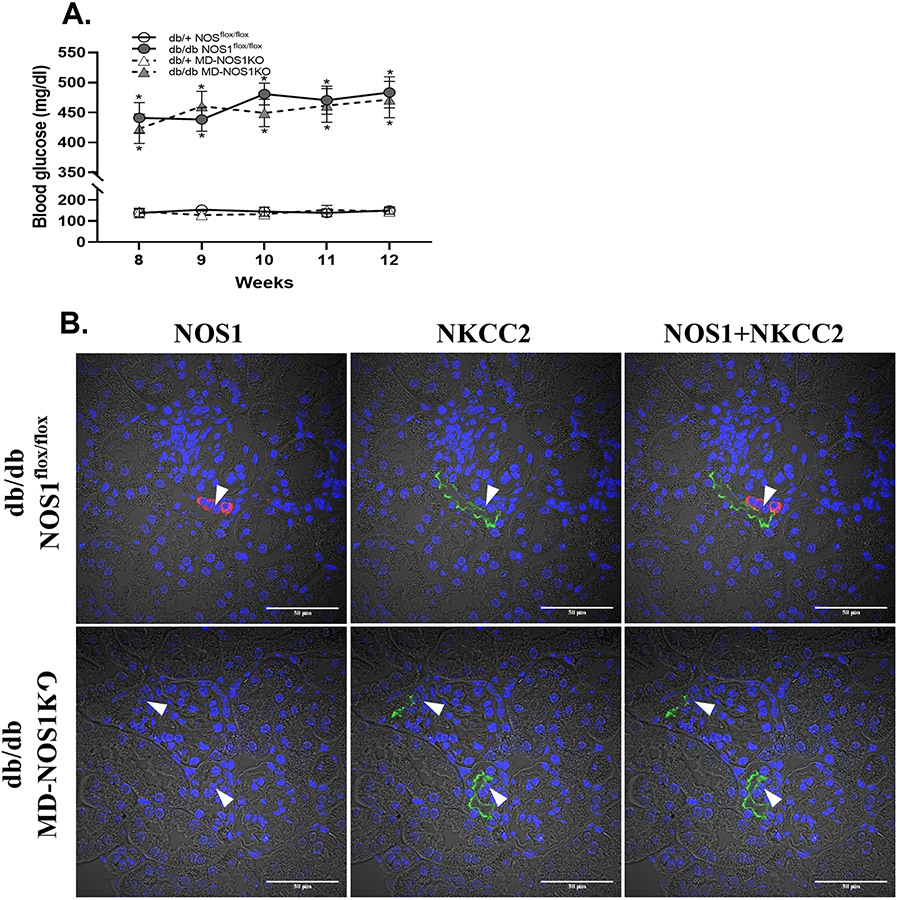
(A) The blood glucose concentration in db/+ NOS1flox/flox, db/db NOS1flox/flox, db/+ MD-NOS1KO and db/db MD-NOS1KO mice. n=10; *P<0.01 vs db/+. (B) The double immunofluorescence staining of NOS1 and NKCC2 in the kidney slices of db/db NOS1flox/flox and db/db MD-NOS1KO mice. Red: NOS1; Green: NKCC2; Blue: nucleus; Arrow: macula densa. Statistical difference in (A) was calculated by two-way repeated measures ANOVA followed by Sidak multiple comparisons test.
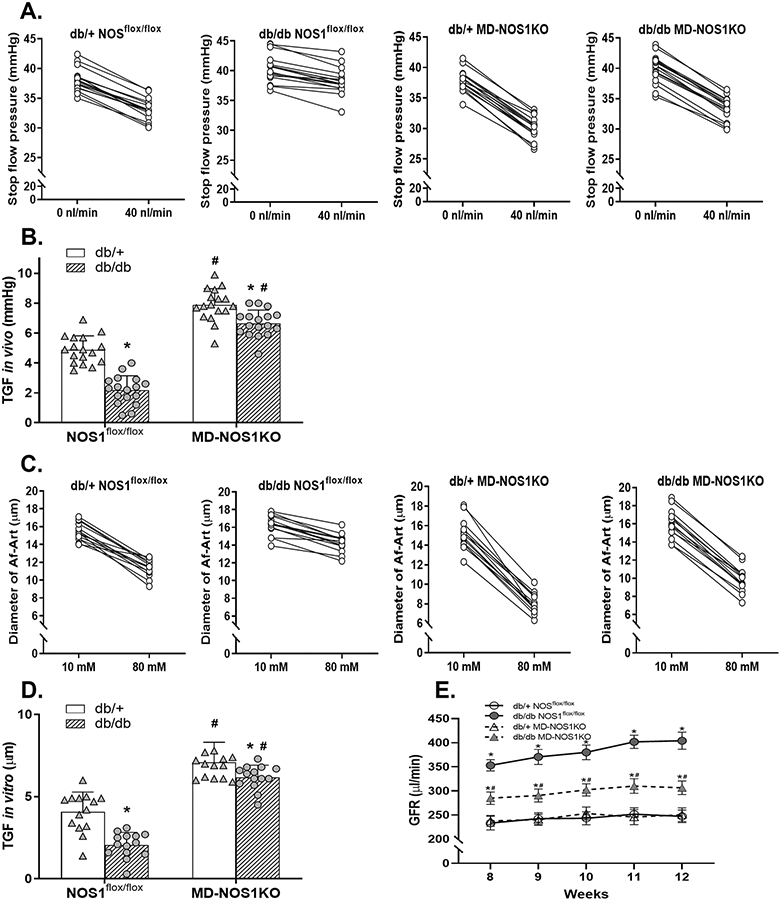
(A and B) The TGF response in vivo in db/+ NOS1flox/flox, db/db NOS1flox/flox, db/+ MD-NOS1KO and db/db MD-NOS1KO mice. n=17 tubules/5 mice per group; *P<0.01 vs db/+; #P<0.01 vs NOS1flox/flox. (C and D) The TGF response in vitro in db/+ NOS1flox/flox, db/db NOS1flox/flox, db/+ MD-NOS1KO and db/db MD-NOS1KO mice. n=14 nephrons/group; *P<0.05 vs db/+; #P<0.01 vs NOS1flox/flox. (E) The GFR in db/+ NOS1flox/flox, db/db NOS1flox/flox, db/+ MD-NOS1KO and db/db MD-NOS1KO mice. n=10; *P<0.01 vs db/+; #P<0.01 vs NOS1flox/flox. Statistical difference in (A and C) was calculated by t-test. Statistical difference in (B and D) was calculated by two-way ANOVA followed by Sidak multiple comparisons test. Statistical difference in (E) was calculated by two-way repeated measures ANOVA followed by Sidak multiple comparisons test.
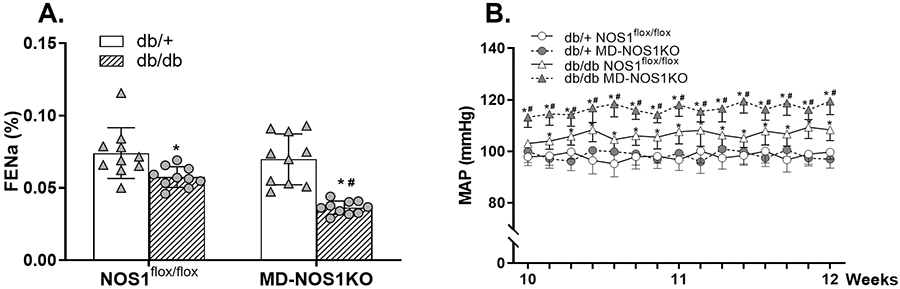
(A) The FENa in db/+ NOS1flox/flox, db/db NOS1flox/flox, db/+ MD-NOS1KO and db/db MD-NOS1KO mice. n=10; *P<0.05 vs db/+; #P<0.01 vs NOS1flox/flox. (B) The MAP in db/+ NOS1flox/flox, db/db NOS1flox/flox, db/+ MD-NOS1KO and db/db MD-NOS1KO mice. *P<0.05 vs db/+; #P<0.05 vs NOS1flox/flox. Statistical difference in (A) was calculated by two-way ANOVA followed by Sidak multiple comparisons test. Statistical difference in (B) was calculated by two-way repeated measures ANOVA followed by Sidak multiple comparisons test.
References
-
- Gillespie CD, Hurvitz KA, Centers for Disease C, Prevention. Prevalence of hypertension and controlled hypertension - united states, 2007-2010. MMWR Suppl. 2013;62:144–148 - PubMed
-
- Hypertension in diabetes study (hds): I. Prevalence of hypertension in newly presenting type 2 diabetic patients and the association with risk factors for cardiovascular and diabetic complications. J Hypertens. 1993;11:309–317 - PubMed
-
- Sowers JR, Epstein M, Frohlich ED. Diabetes, hypertension, and cardiovascular disease: An update. Hypertension. 2001;37:1053–1059 - PubMed
Publication types
MeSH terms
Substances
Grants and funding
LinkOut - more resources
Full Text Sources
Miscellaneous
