. 2021 Dec 1;321(6):F675-F688.
doi: 10.1152/ajprenal.00186.2021. Epub 2021 Oct 18.

VEGFR3 tyrosine kinase inhibition aggravates cisplatin nephrotoxicity

Affiliations

VEGFR3 tyrosine kinase inhibition aggravates cisplatin nephrotoxicity

Laurence M Black et al. Am J Physiol Renal Physiol. .

Abstract

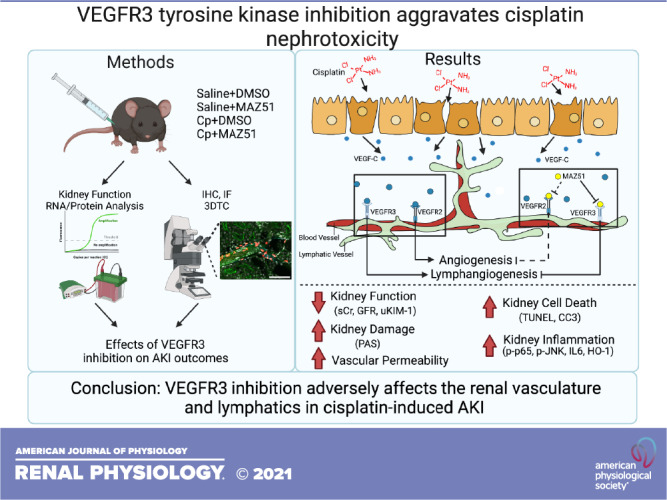
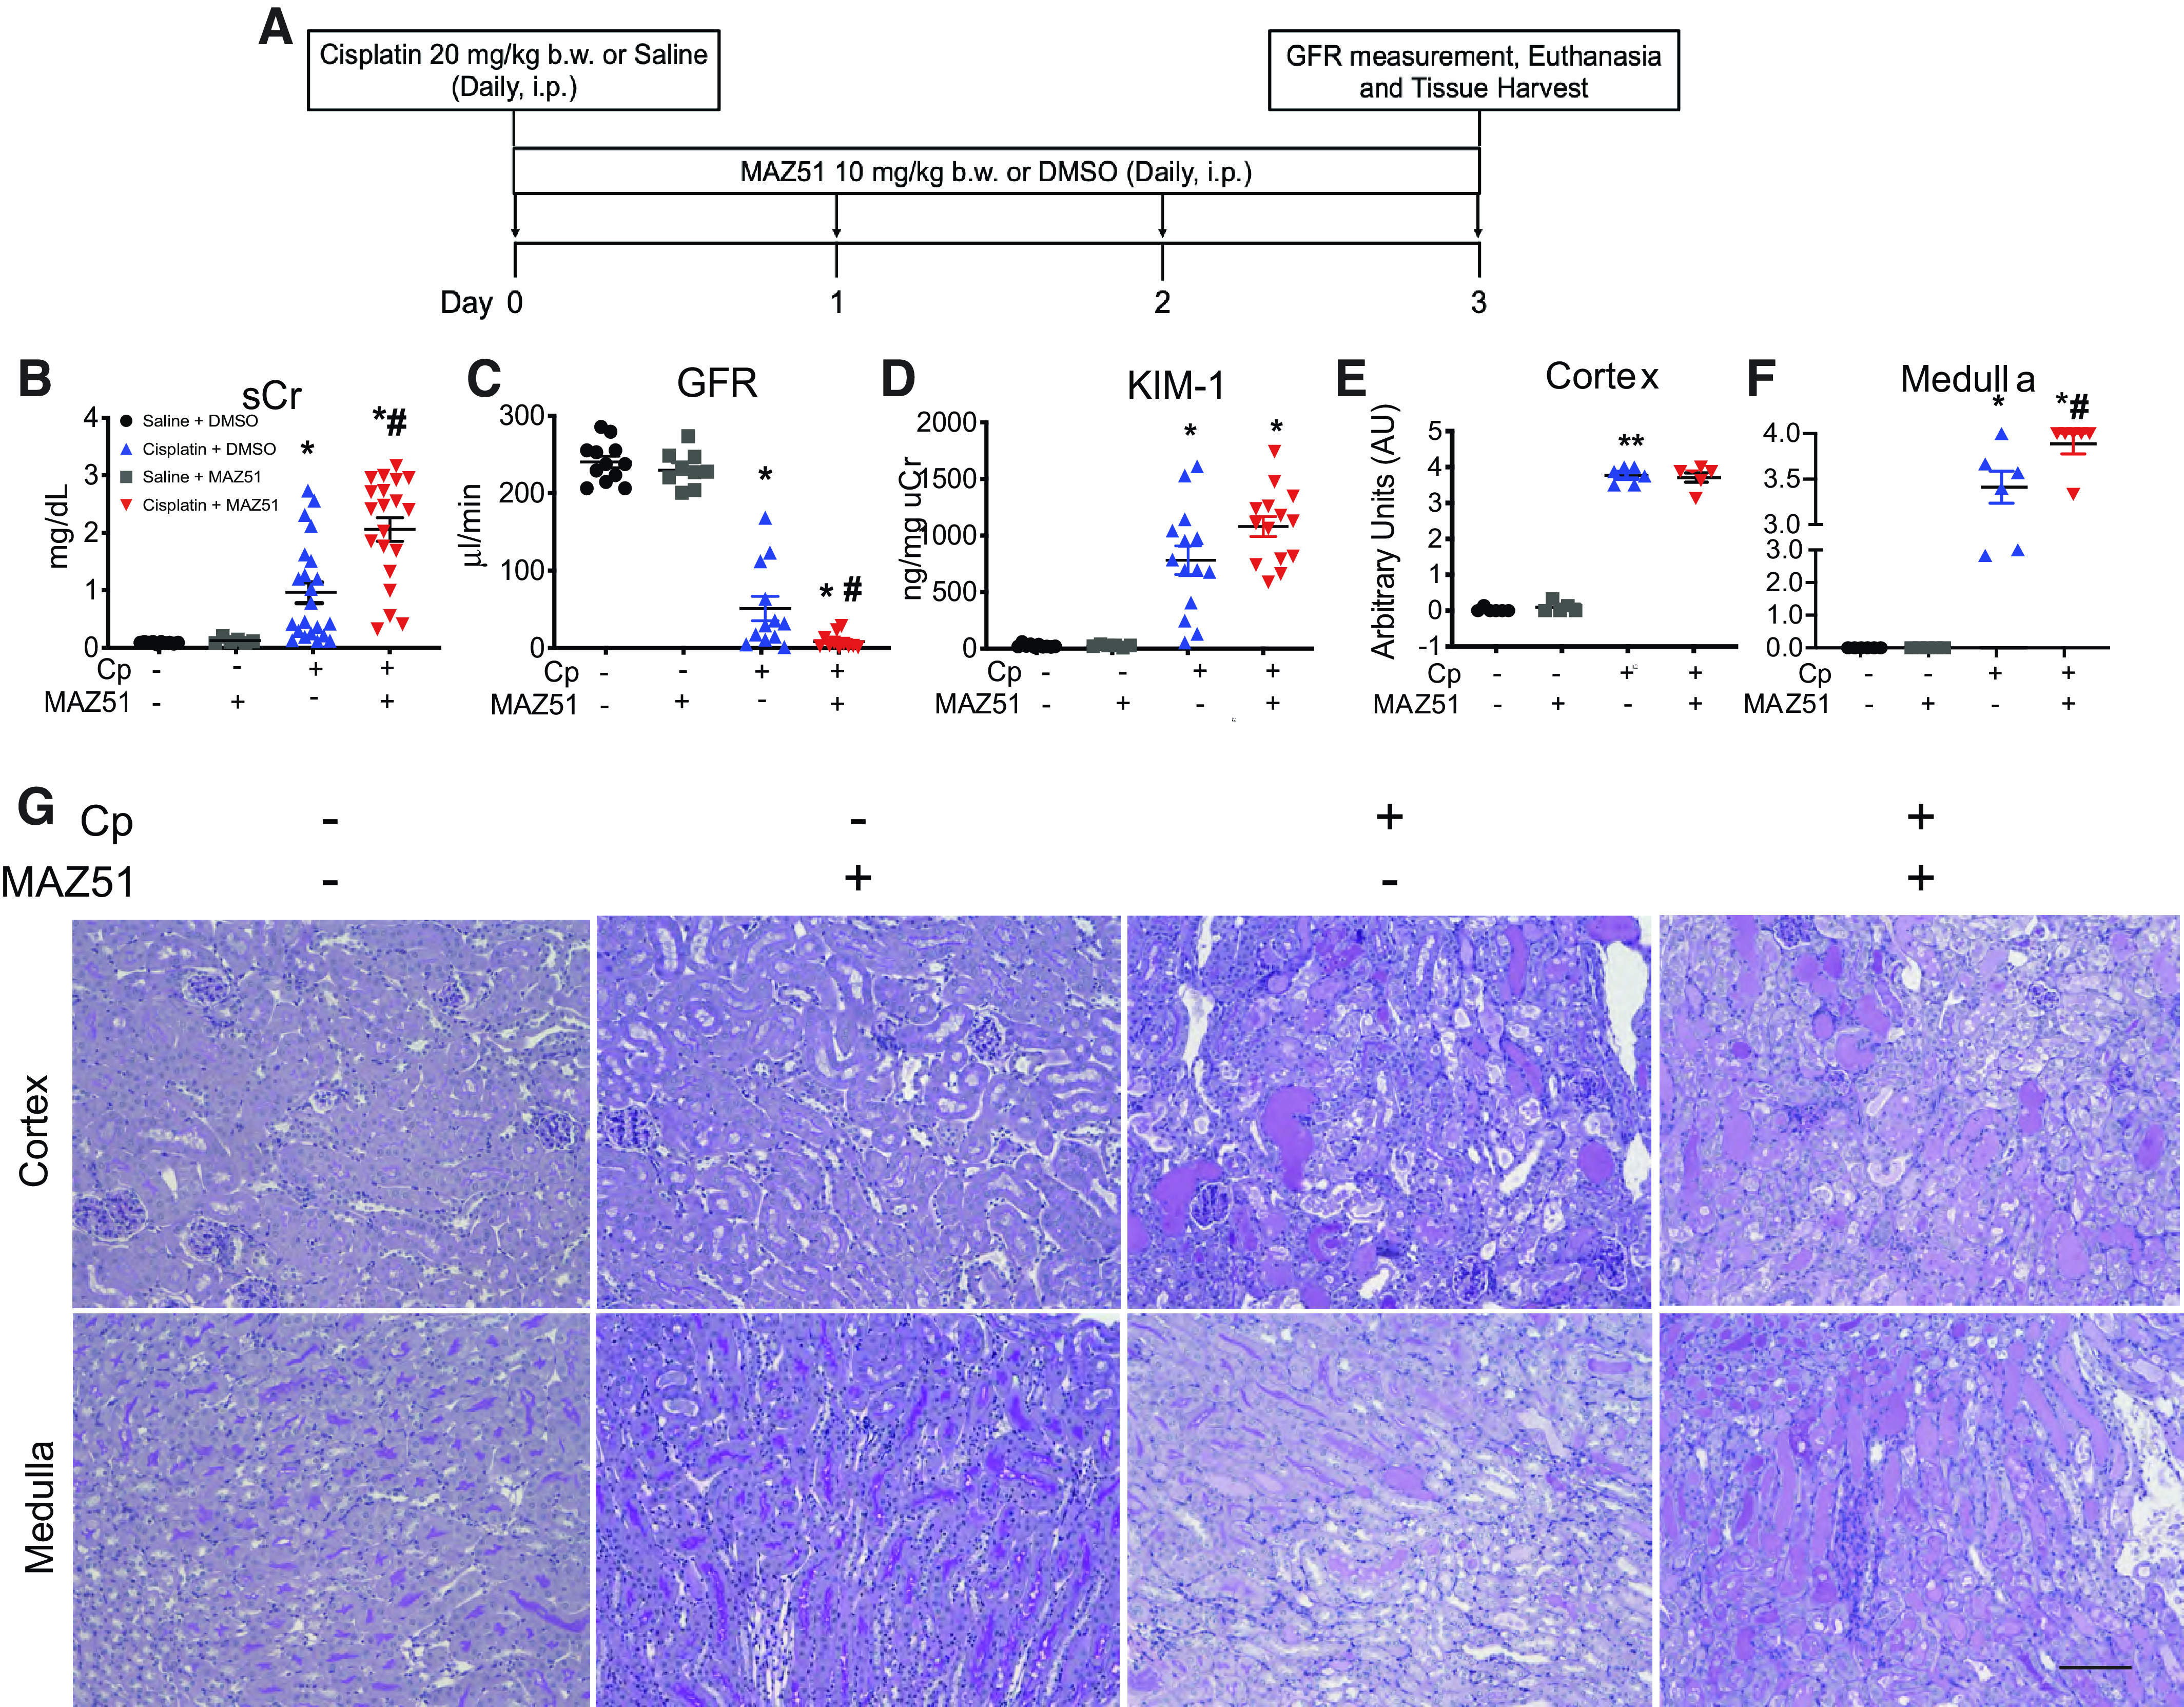
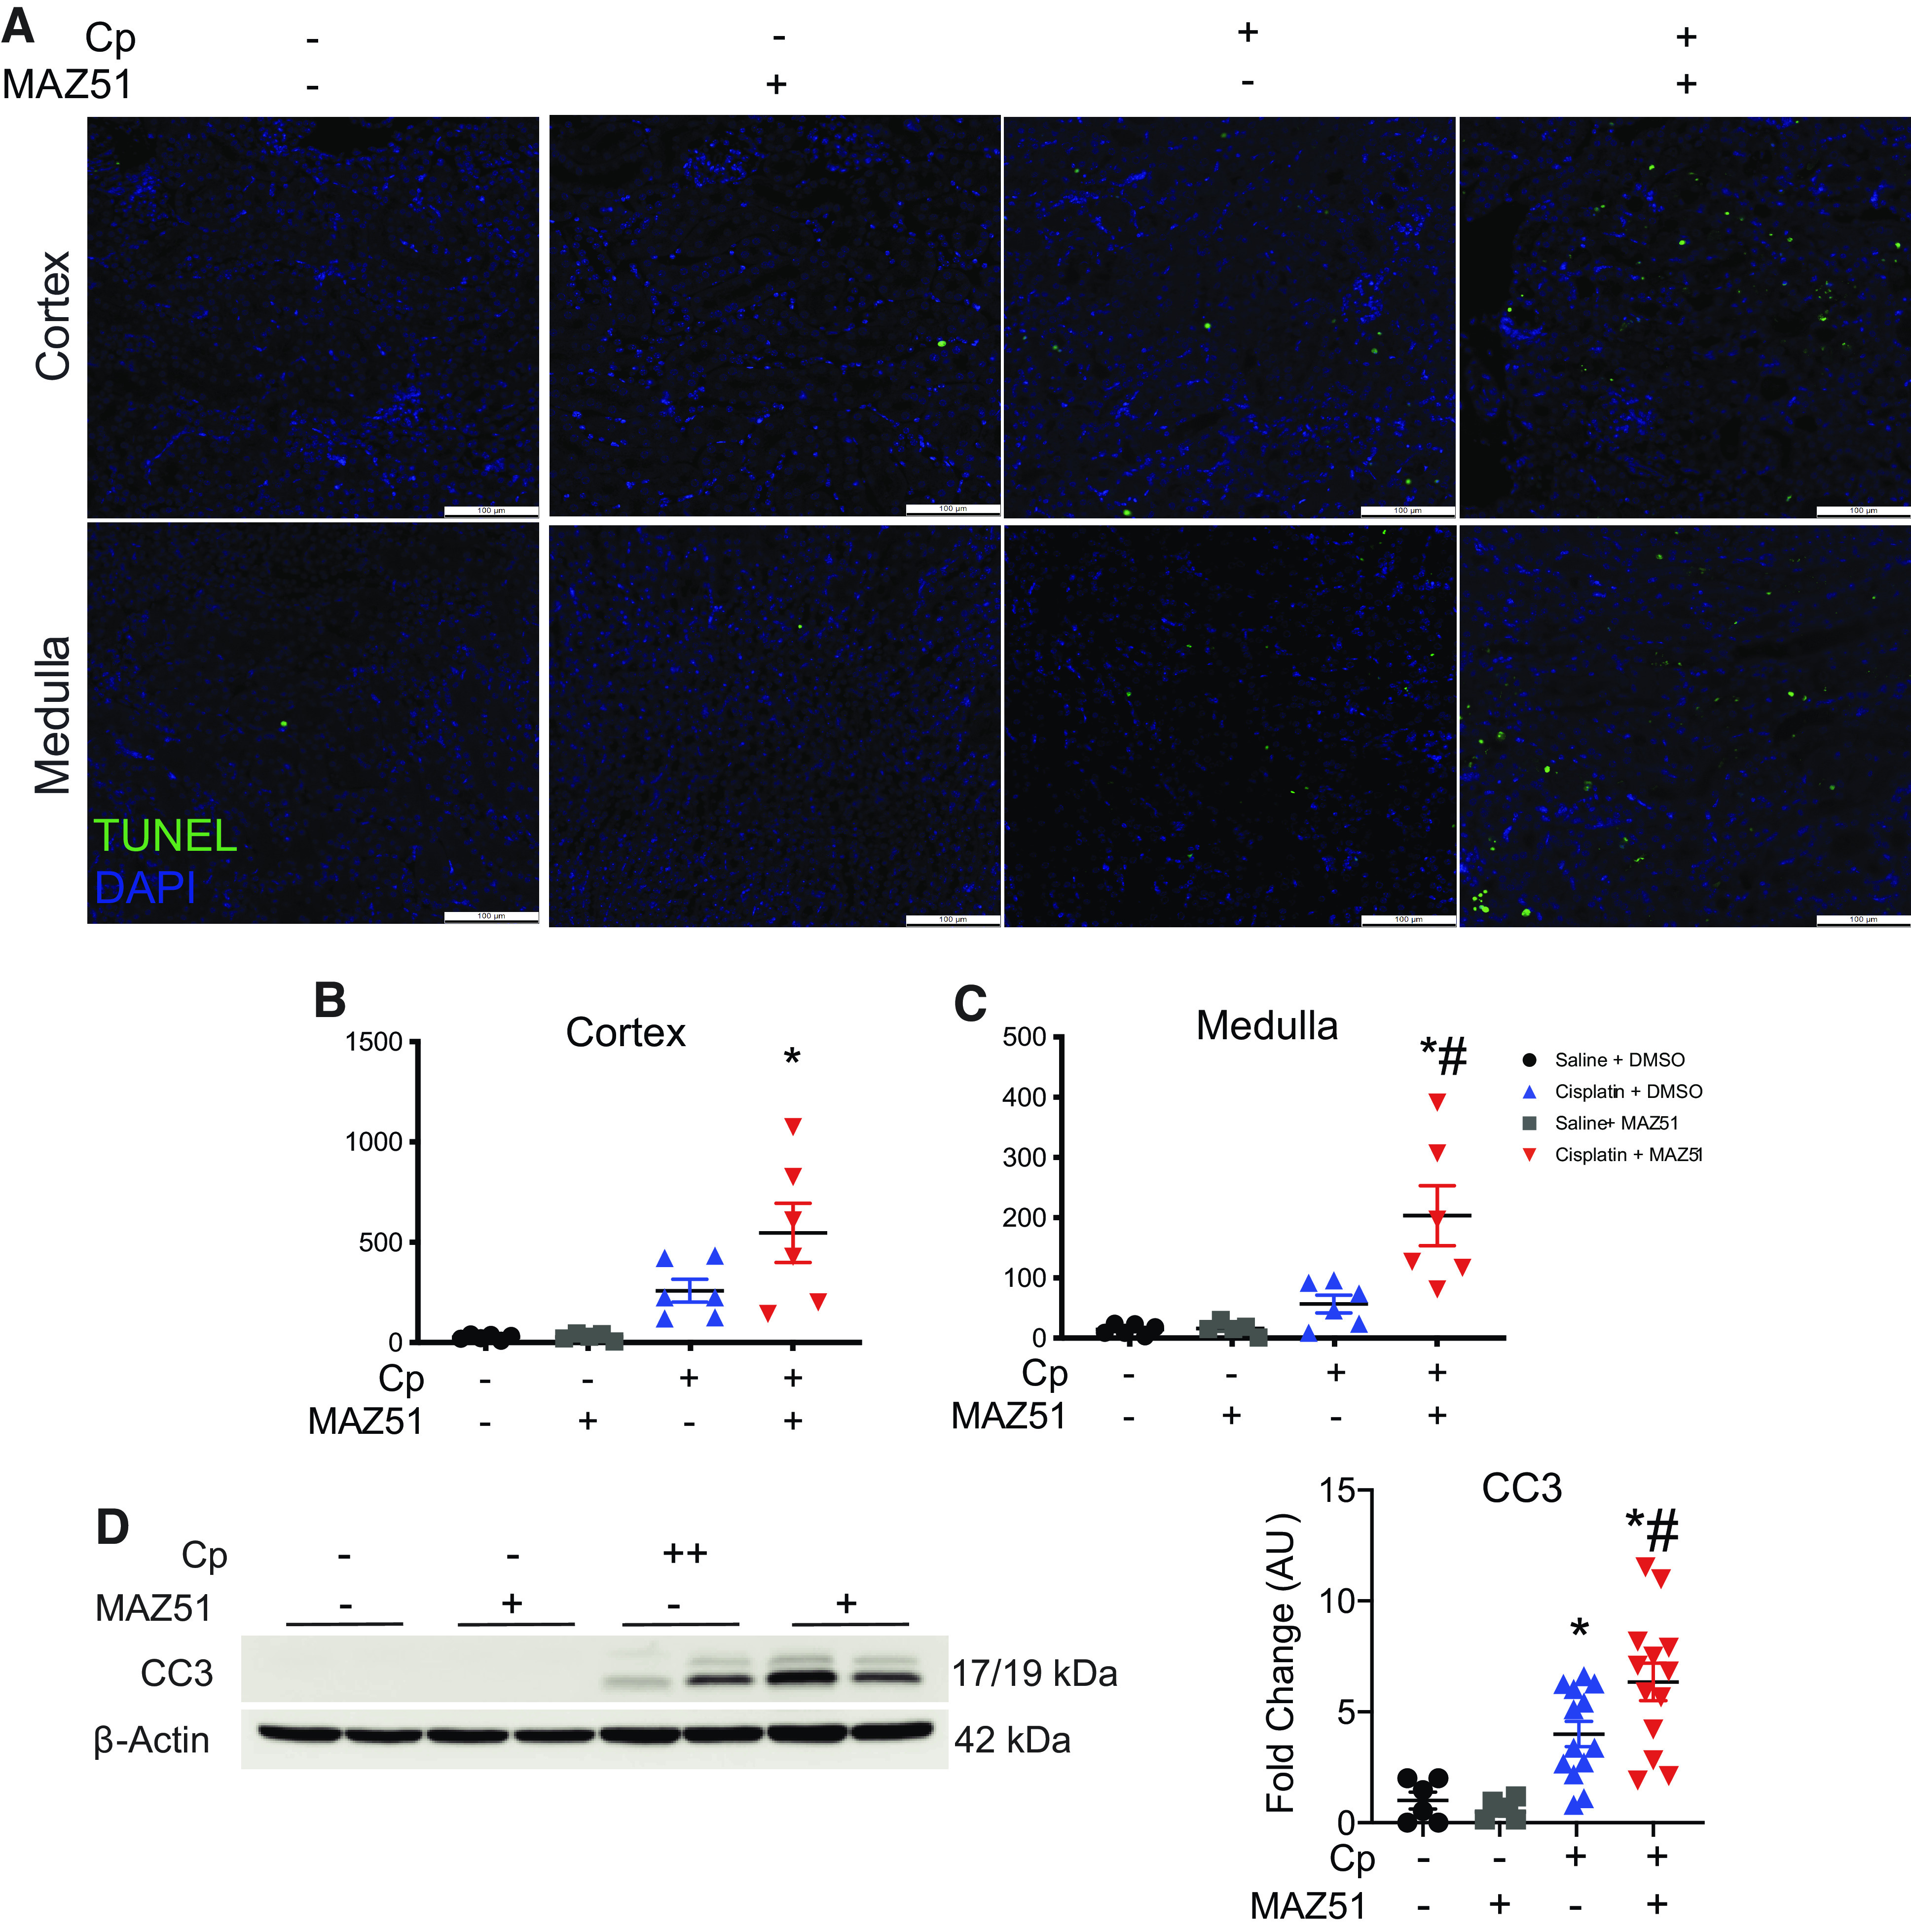
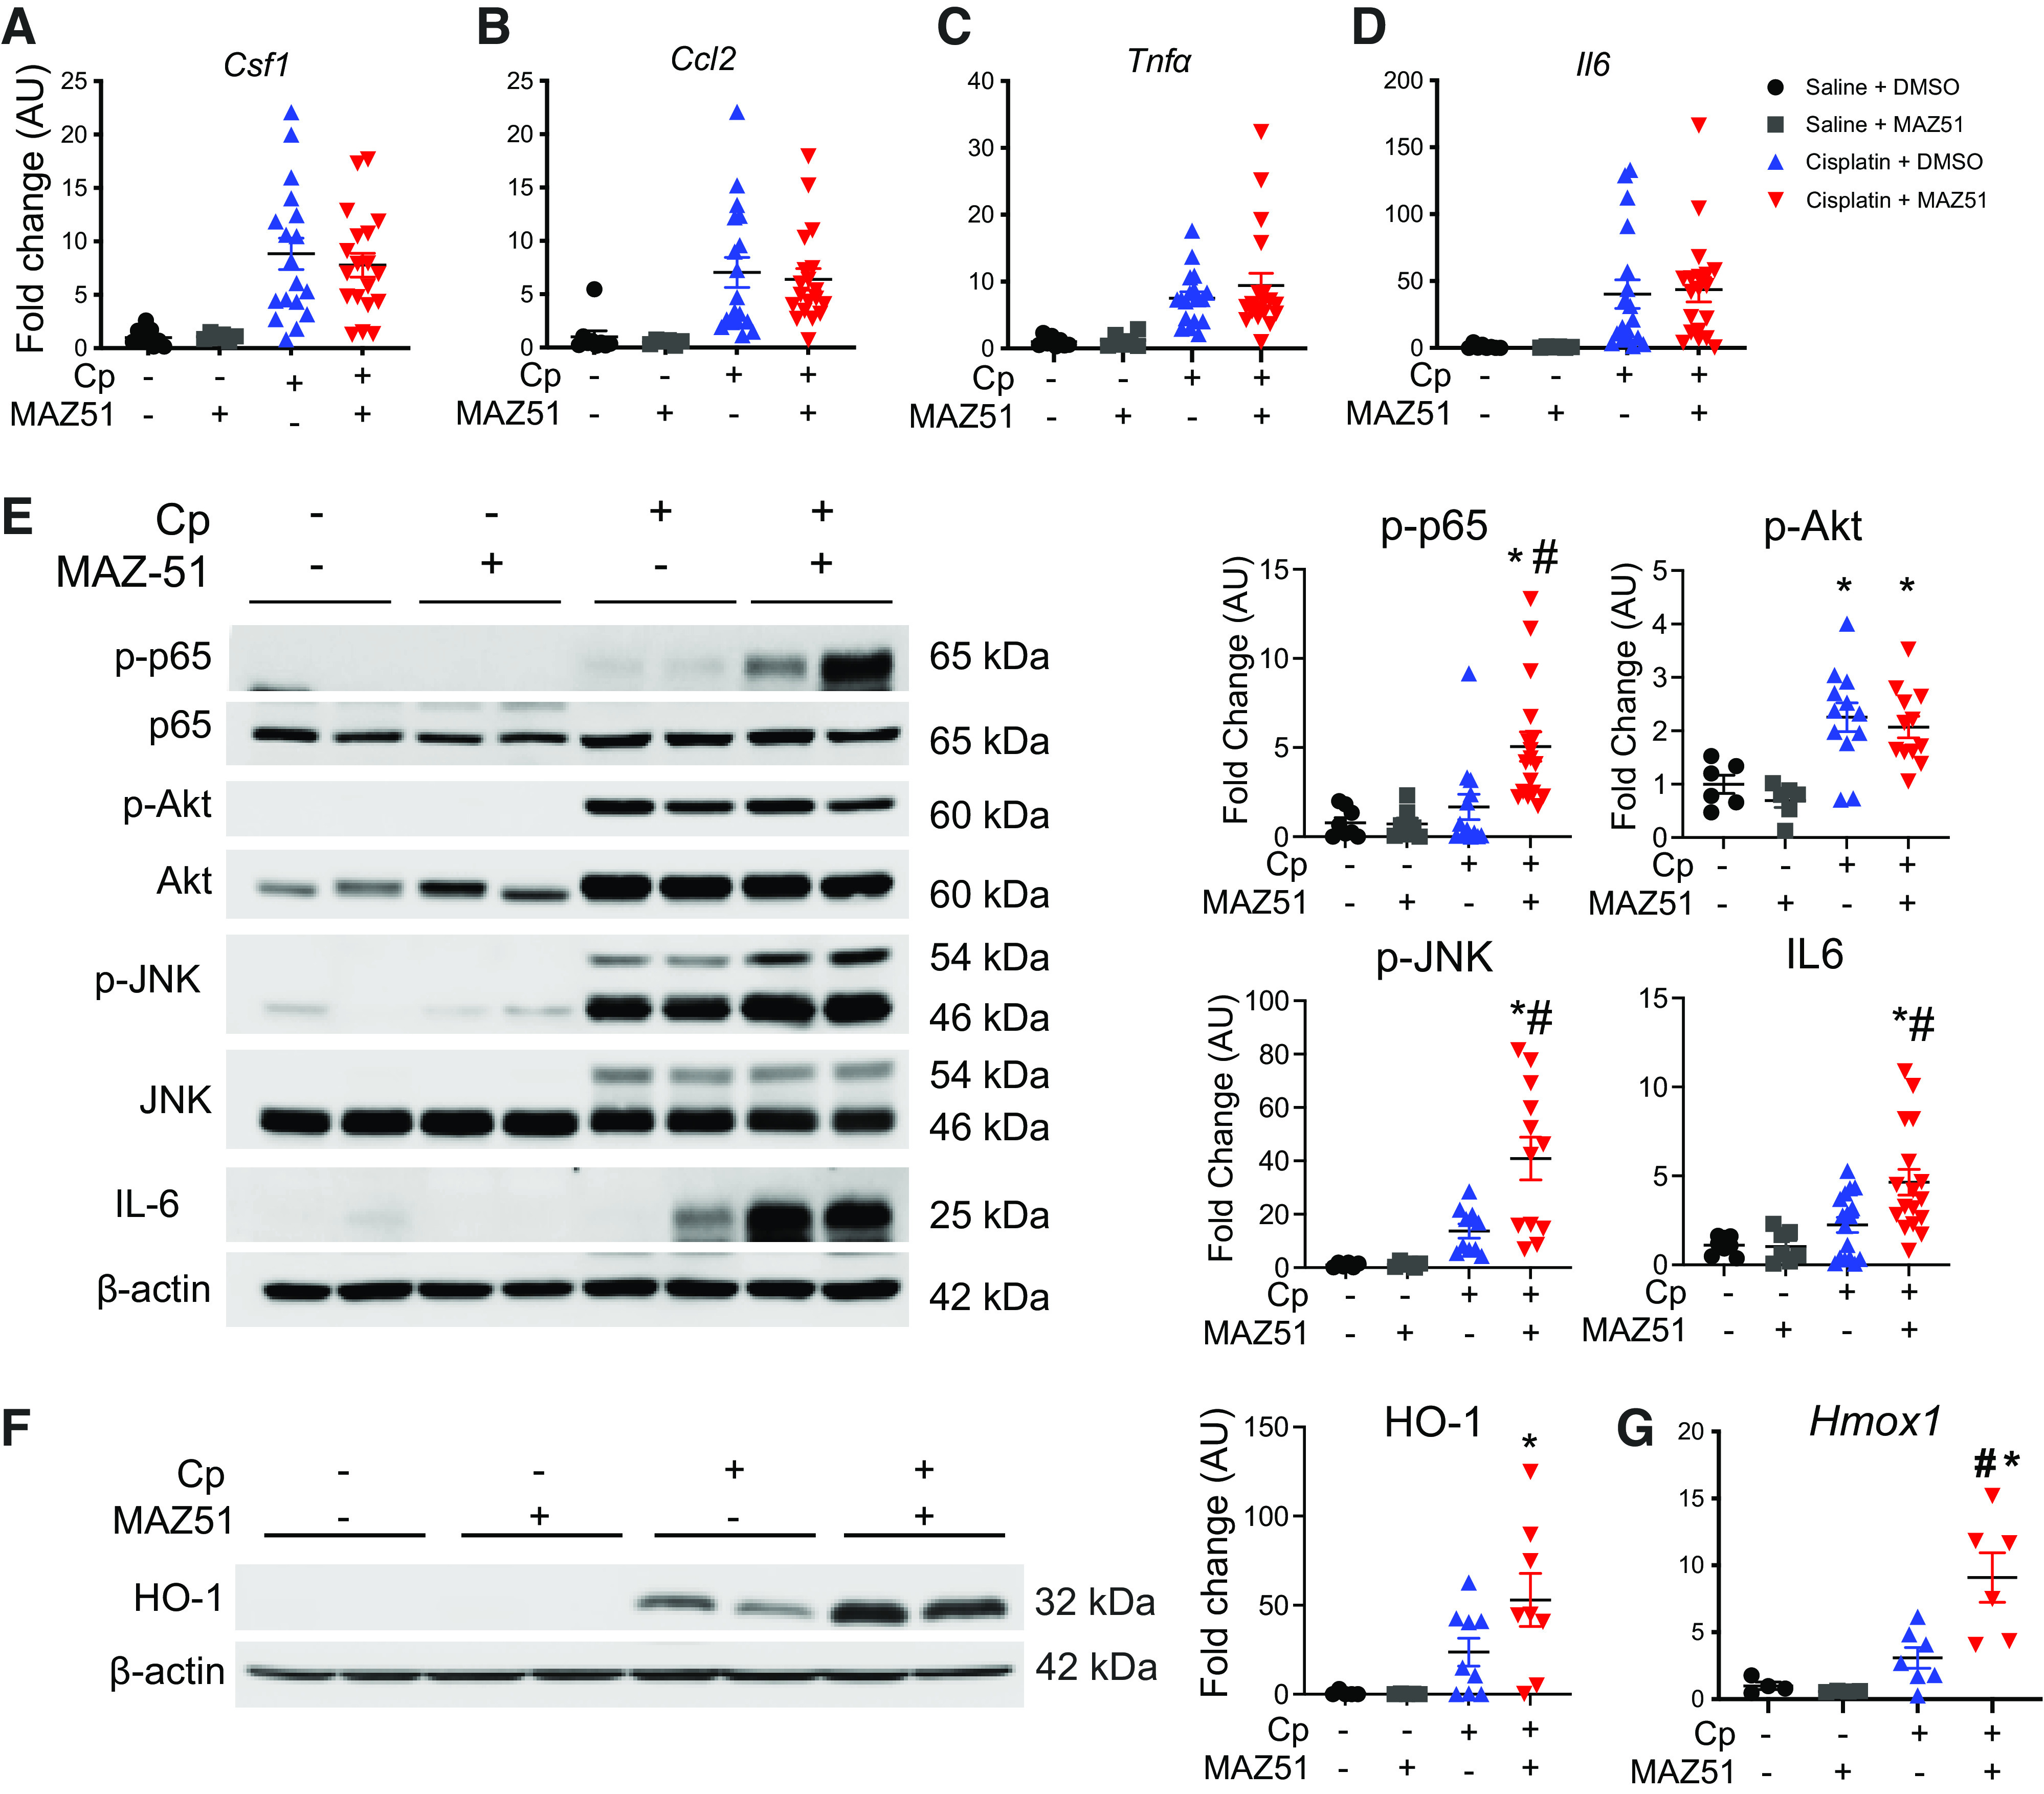
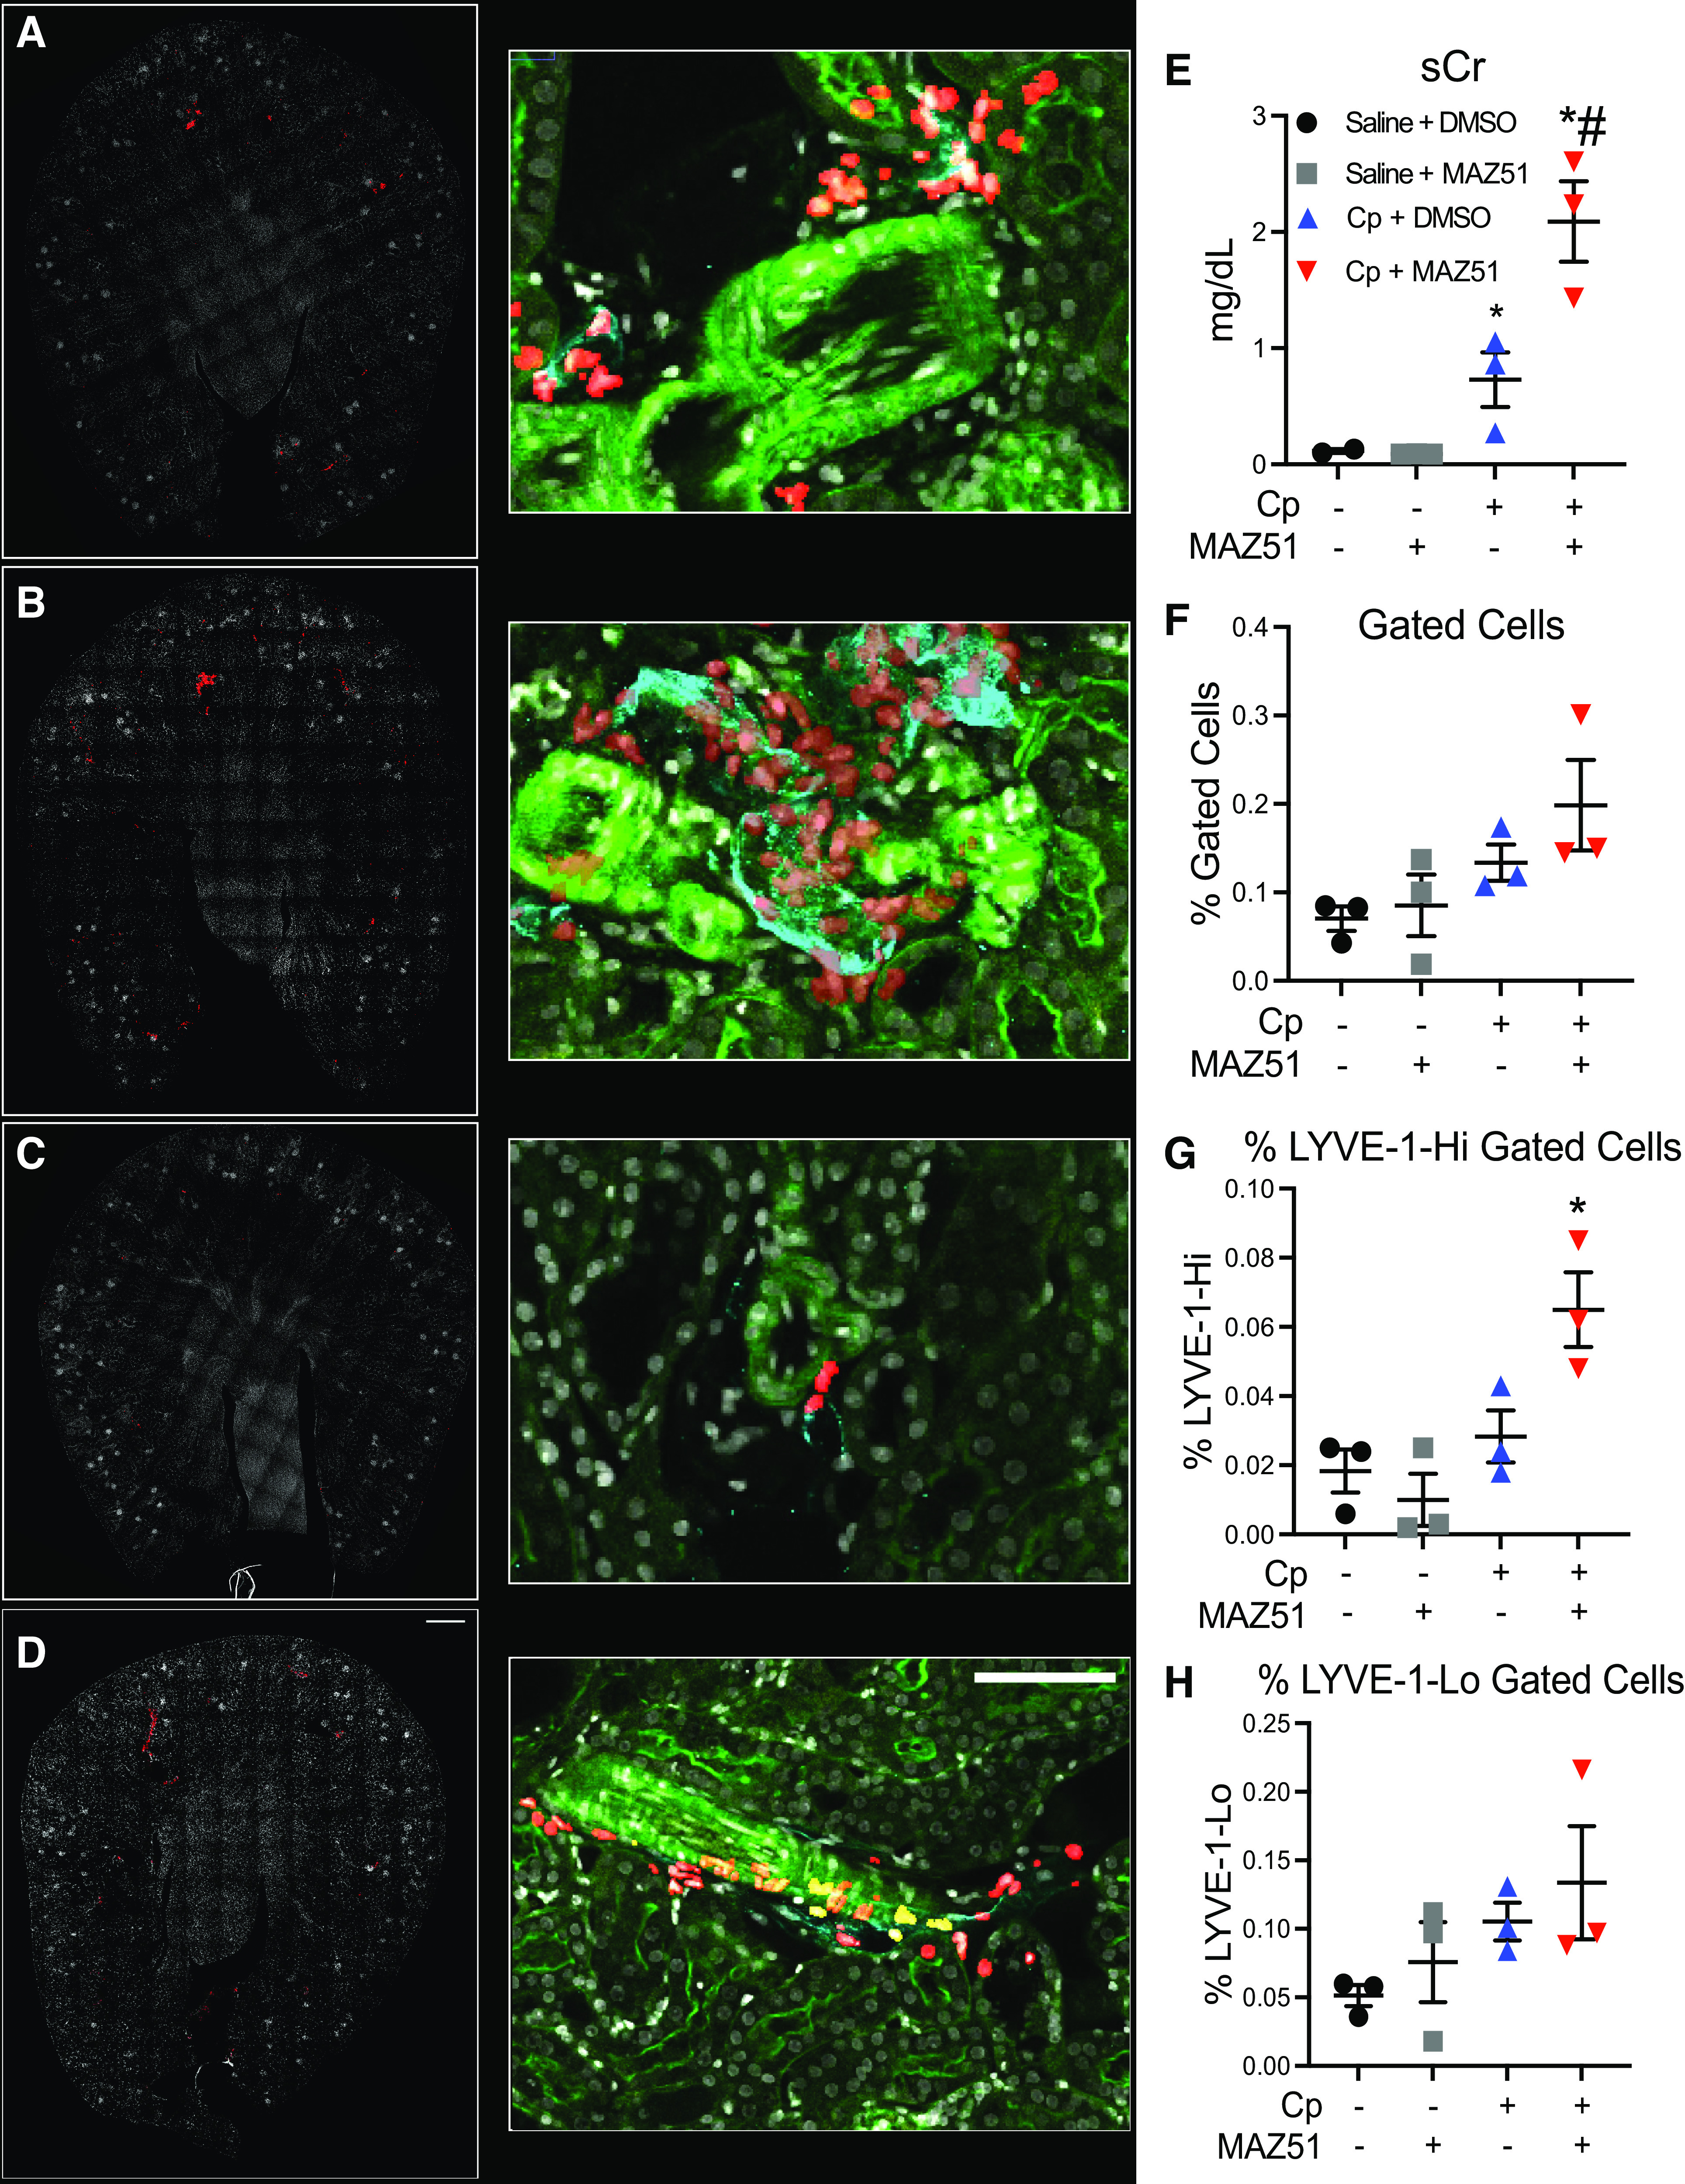
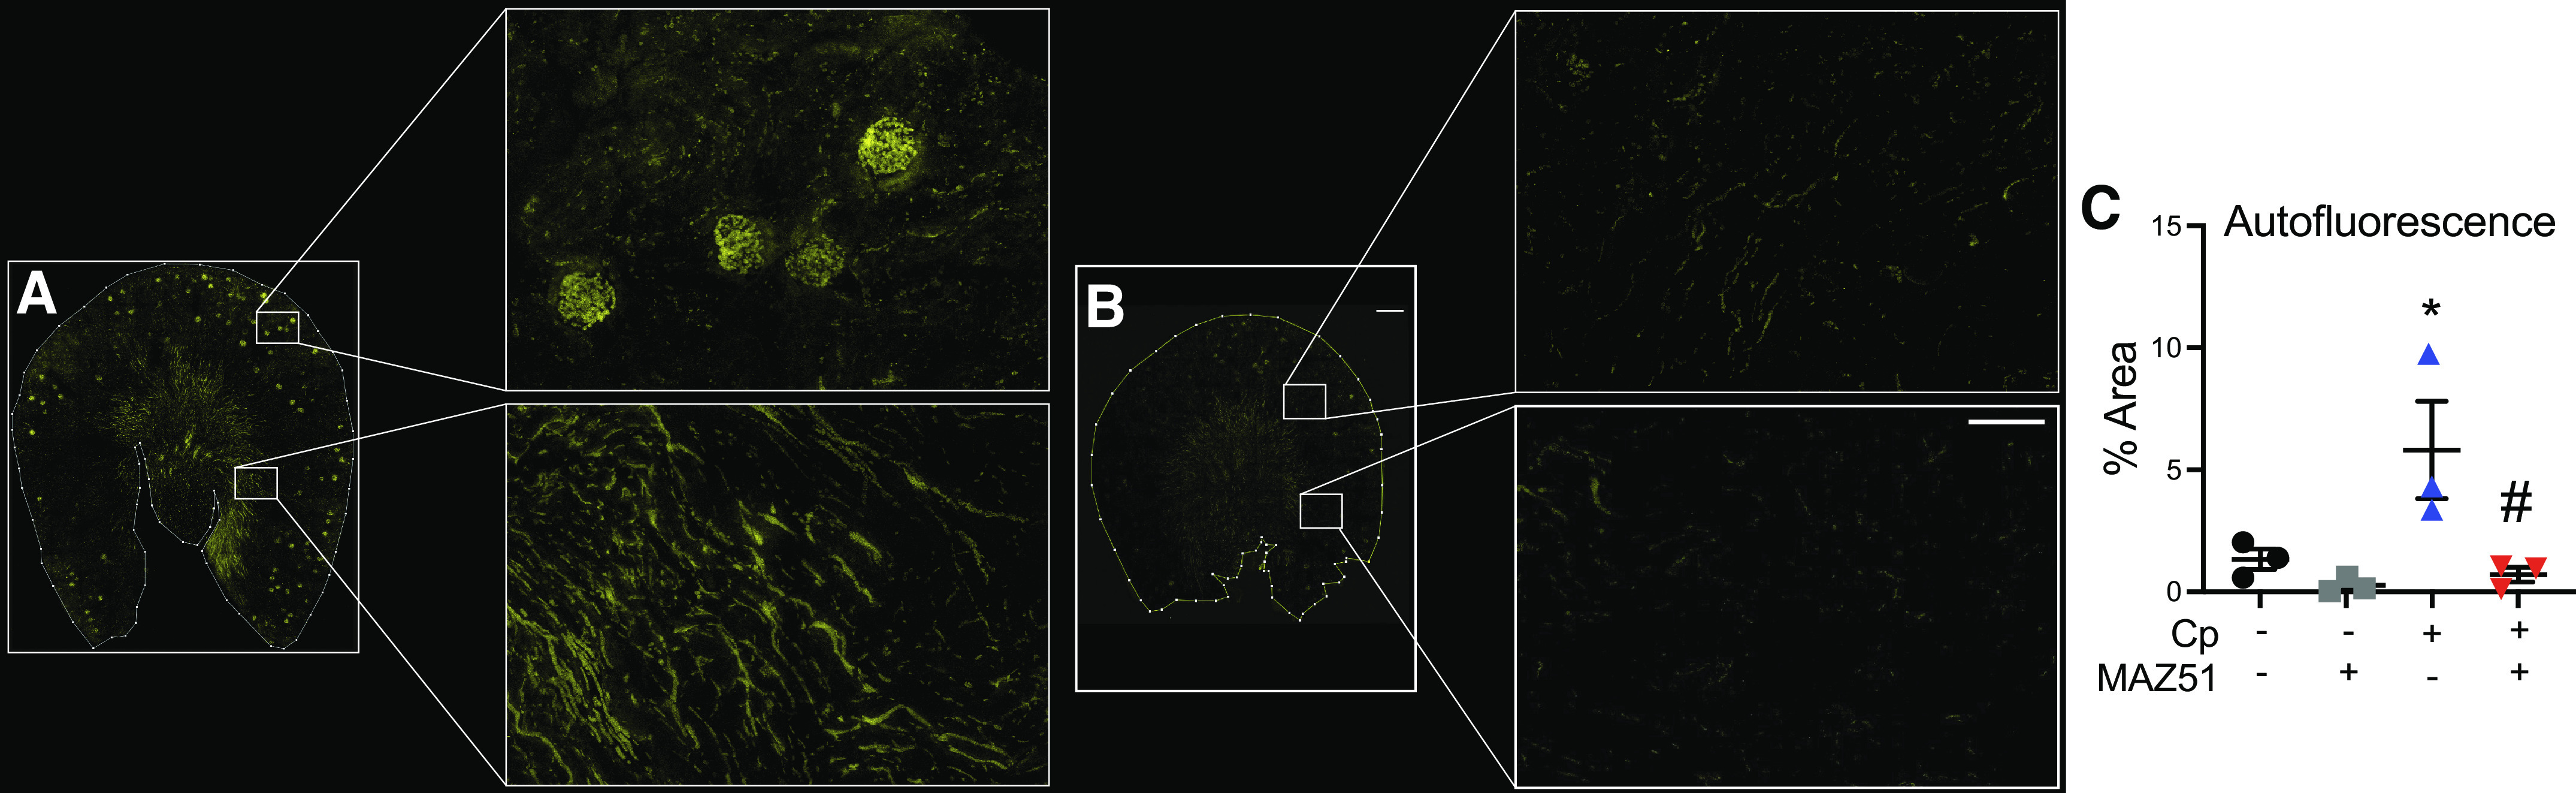
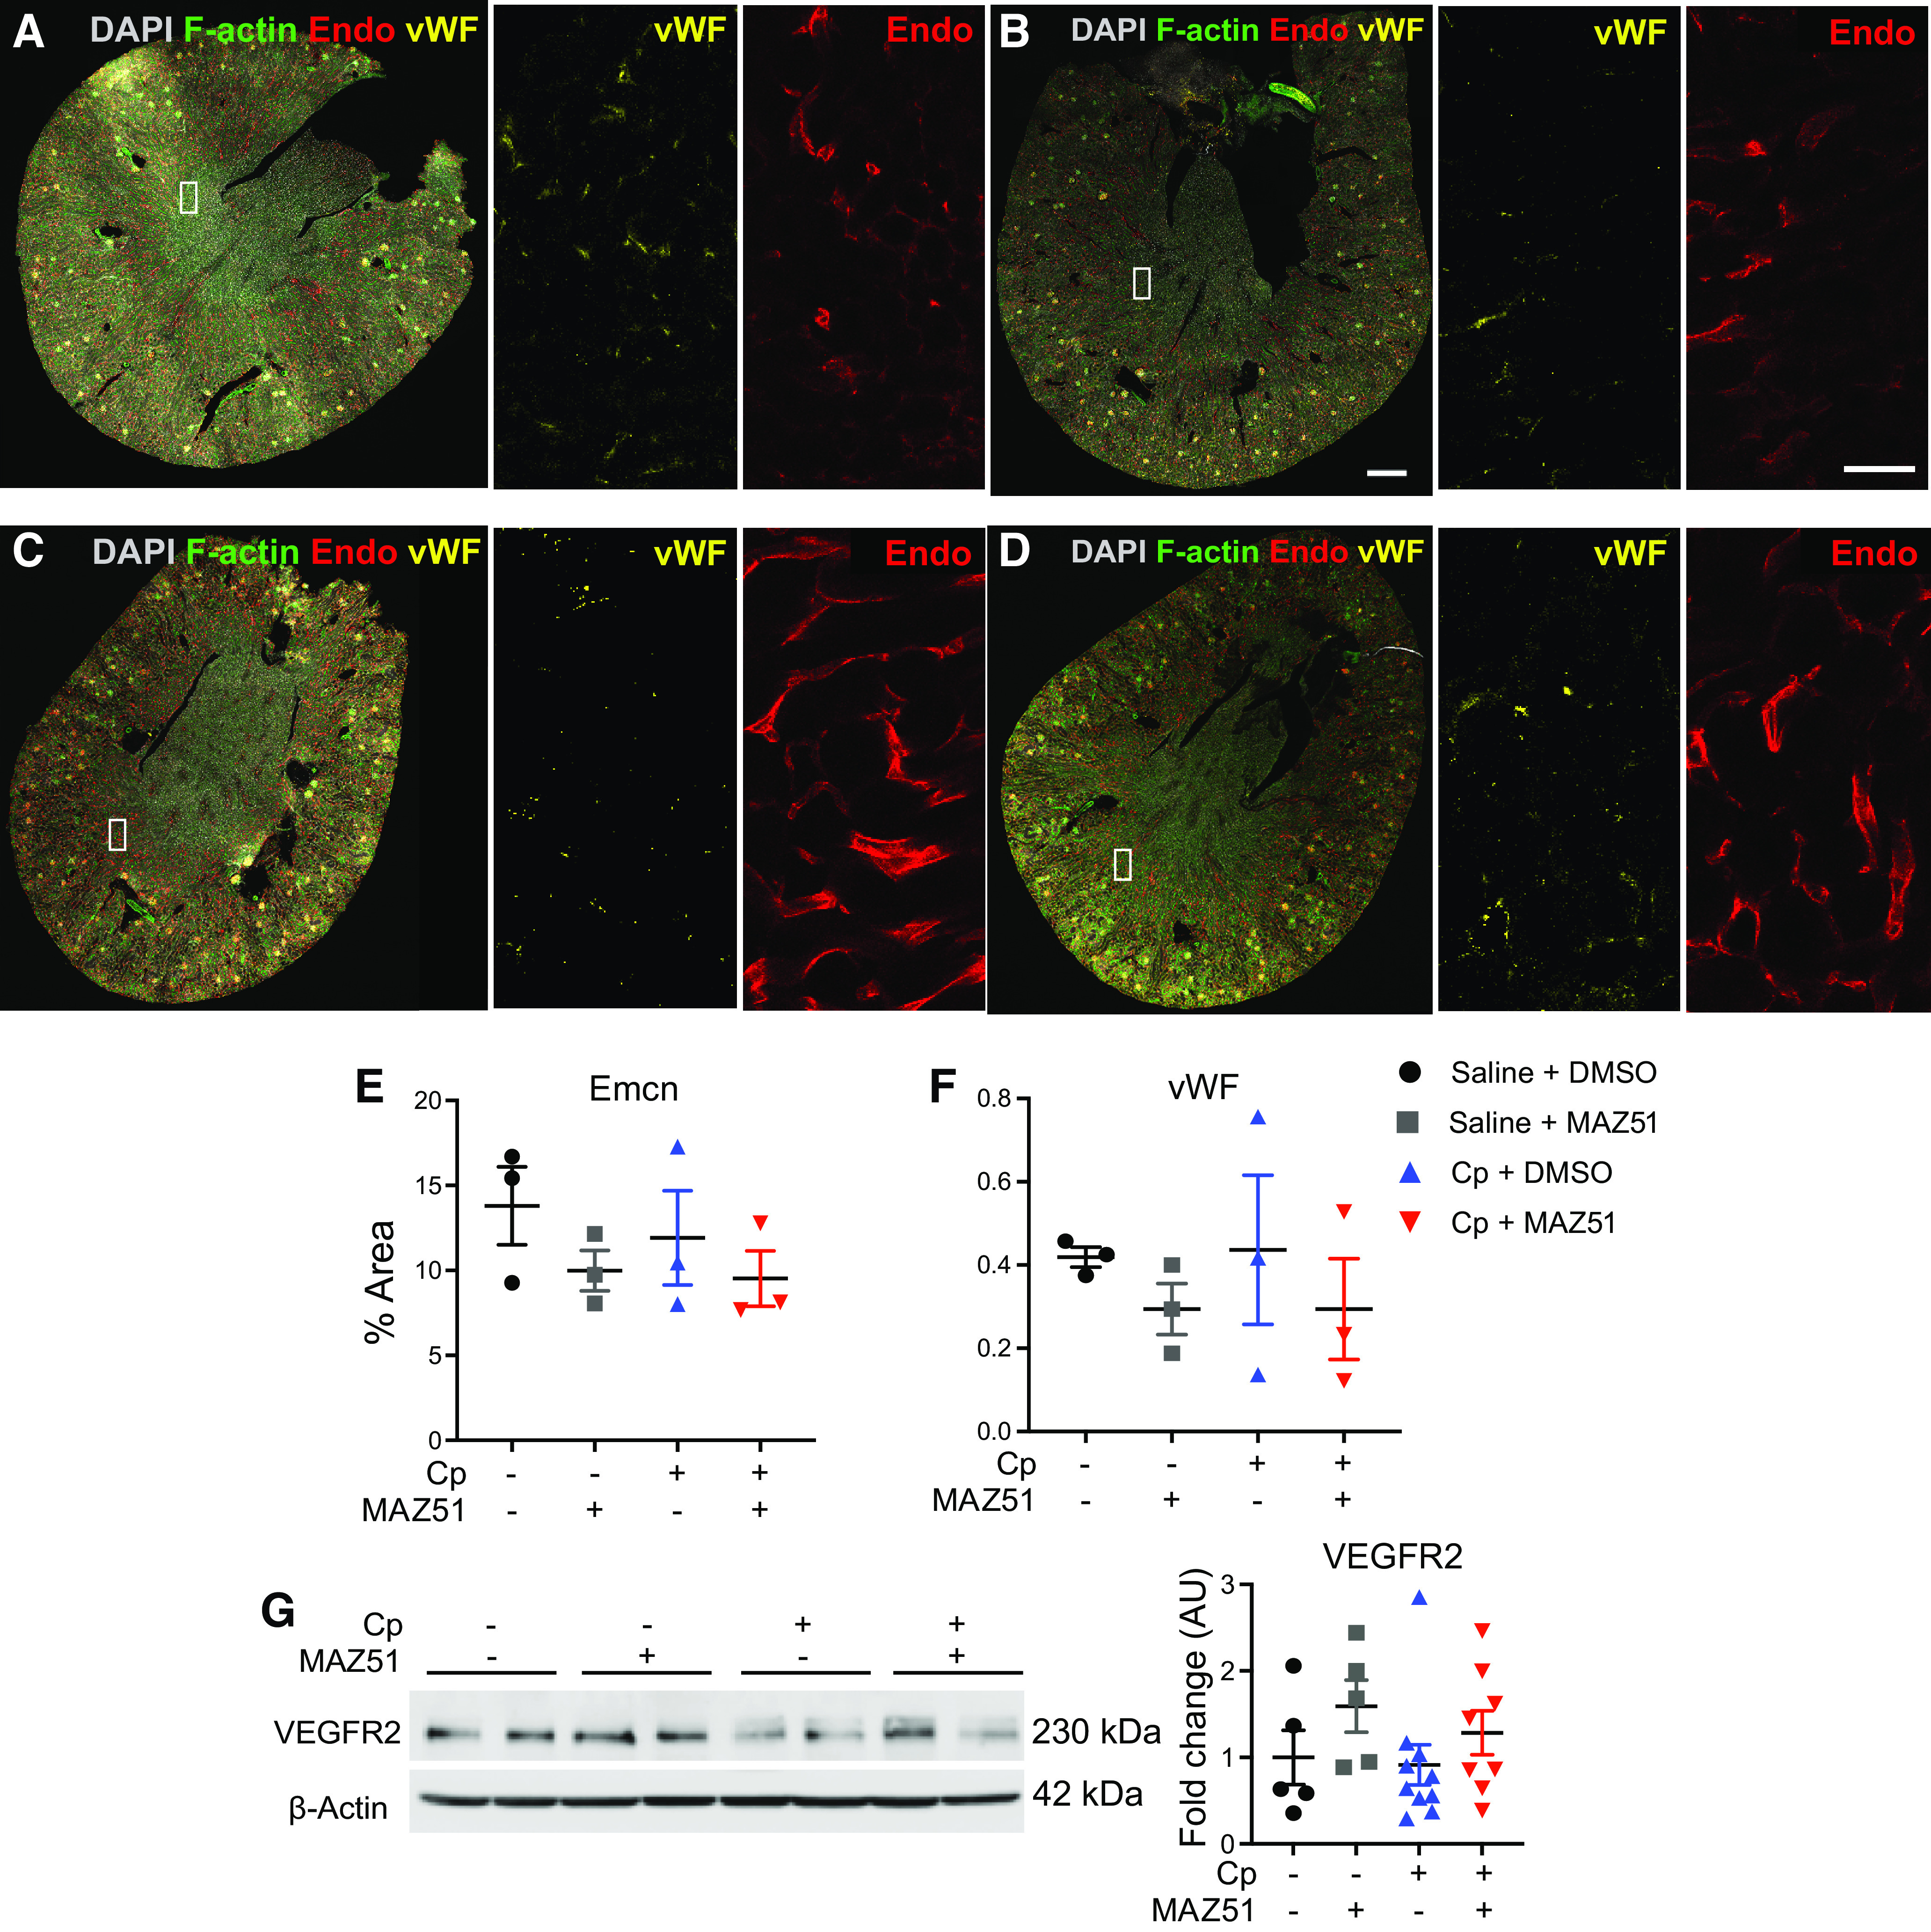
Expansion of renal lymphatic networks, or lymphangiogenesis (LA), is well recognized during development and is now being implicated in kidney diseases. Although LA is associated with multiple pathological conditions, very little is known about its role in acute kidney injury. The purpose of this study was to evaluate the role of LA in a model of cisplatin-induced nephrotoxicity. LA is predominately regulated by vascular endothelial growth factor (VEGF)-C and VEGF-D, ligands that exert their function through their cognate receptor VEGF receptor 3 (VEGFR3). We demonstrated that use of MAZ51, a selective VEGFR3 inhibitor, caused significantly worse structural and functional kidney damage in cisplatin nephrotoxicity. Apoptotic cell death and inflammation were also increased in MAZ51-treated animals compared with vehicle-treated animals following cisplatin administration. Notably, MAZ51 caused significant upregulation of intrarenal phospho-NF-κB, phospho-JNK, and IL-6. Cisplatin nephrotoxicity is associated with vascular congestion due to endothelial dysfunction. Using three-dimensional tissue cytometry, a novel approach to explore lymphatics in the kidney, we detected significant vascular autofluorescence attributed to erythrocytes in cisplatin alone-treated animals. Interestingly, no such congestion was detected in MAZ51-treated animals. We found increased renal vascular damage in MAZ51-treated animals, whereby MAZ51 caused a modest decrease in the endothelial markers endomucin and von Willebrand factor, with a modest increase in VEGFR2. Our findings identify a protective role for de novo LA in cisplatin nephrotoxicity and provide a rationale for the development of therapeutic approaches targeting LA. Our study also suggests off-target effects of MAZ51 on the vasculature in the setting of cisplatin nephrotoxicity.NEW & NOTEWORTHY Little is known about injury-associated LA in the kidney and its role in the pathophysiology of acute kidney injury (AKI). Observed exacerbation of cisplatin-induced AKI after LA inhibition was accompanied by increased medullary damage and cell death in the kidney. LA inhibition also upregulated compensatory expression of LA regulatory proteins, including JNK and NF-κB. These data support the premise that LA is induced during AKI and lymphatic expansion is a protective mechanism in cisplatin nephrotoxicity.

Keywords: kidney; lymphangiogenesis; lymphatics; three-dimensional imaging; vascular endothelial growth factor receptor 3.


Conflict of interest statement

No conflicts of interest, financial or otherwise, are declared by the authors.

Figures

None
Graphical abstract
Figure 1.
Figure 1.
Vascular endothelial growth factor receptor 3 (VEGFR3) tyrosine kinase inhibition aggravates cisplatin (Cp) nephrotoxicity. A: experimental design for Cp (20 mg/kg in sterile saline) and MAZ51 (10 mg/kg in sterile DMSO) administration. Male C57Bl/6J mice were used in all experiments, and end-point measurements were made at day 3. B: serum creatinine (sCr) levels were measured and expressed as mg/dL. C: glomerular filtration rate (GFR) was measured using transcutaneous FITC-sinistrin clearance and expressed as µL/min. D: urinary kidney injury molecule-1 (KIM-1) levels were measured, normalized to urinary creatinine (uCr) levels, and expressed as ng/mg uCr. Periodic acid-Schiff-stained transverse kidney sections were imaged, analyzed for injury score in the cortex (E) and medulla (F), and expressed in arbitrary units (AU). Five to eight images from the cortex and the medulla were evaluated. The scoring system was as follows: 0, no apparent damage; 1, up to 25% area; 2, 25–50% area; 3, 50–75% area; and 4, over 75% area. G: representative periodic acid-Schiff staining from the cortex and medulla. Scale bar = 50 µm. Data are expressed as means ± SE; n = 6–24 animals per group. *P < 0.05 vs. vehicle control; #P < 0.05 vs. Cp + DMSO using one-way ANOVA followed by a Tukey’s multiple comparisons test. b.w., body weight.
Figure 2.
Figure 2.
Cell death is exacerbated when lymphangiogenesis is blocked in cisplatin (Cp) nephrotoxicity. A: representative images of TUNEL staining on transverse kidney sections at day 3 after Cp administration. Whole kidney sections were imaged, and TUNEL-positive cells were quantitated in the cortex (B) and medulla (C). D: protein lysates from whole kidney tissue were analyzed for cleaved caspase-3 (CC3) expression. Anti-β-actin was used as a loading control. Densitometric values were calculated and expressed in arbitrary units (AU). Data are expressed as means ± SE; n = 6–17 animals per group. *P < 0.05 vs. vehicle control; #P < 0.05 vs. Cp + DMSO using one-way ANOVA followed by a Tukey’s multiple comparisons test. Scale bar = 100 µm.
Figure 3.
Figure 3.
Inhibition of lymphangiogenesis augments intrarenal inflammation in cisplatin (Cp)-induced acute kidney injury. Total RNA was isolated from whole kidney tissue at day 3 and analyzed for expression of colony stimulating factor-1 (Csf1; A), chemokine (C-C motif) ligand 2 (Ccl2; B), tumor necrosis factor-α (Tnfα; C), and interleukin-6 (Il6; D) by real-time PCR. Data were normalized to Gapdh and expressed as fold changes compared with vehicle controls. Data are expressed as means ± SE; n = 6–19 animals per group. Protein lysates from whole kidney tissue were analyzed for expression of phosphorylated (p)-p65 (NF-κB), p-Akt (RAC-α serine-threonine-protein kinase), p-JNK, and IL-6 (E) and heme oxygenase-1 (HO-1; F). Anti-β-actin was used as a loading control. Densitometric values were calculated and expressed in arbitrary units (AU). Data are expressed as means ± SE; n = 6–19 animals per group. Data were analyzed using one-way ANOVA followed by a Tukey’s multiple comparisons test. G: real-time PCR of kidneys at day 3 for expression of the HO-1 gene (Hmox1). Data were normalized to Gapdh and expressed as fold changes compared with vehicle controls. Data are expressed as means ± SE; n = 5–9 animals per group. *P < 0.05 vs. vehicle control; #P < 0.05 vs. Cp + DMSO using one-way ANOVA followed by a Tukey’s multiple comparisons test.
Figure 4.
Figure 4.
Three-dimensional confocal fluorescence microscopy and cytometry of lymphatic vessel hyaluronan receptor-1 (LYVE-1)-positive lymphatic vessels. Maximum projection of composite fluorescence images of whole kidney sections (left; scale bar = 500 µm) and high-magnification insets (middle; scale bar = 100 µm) from saline + DMSO-treated (A), cisplatin (Cp) + DMSO-treated (B), saline + MAZ51-treated (C), and Cp + MAZ51-treated (D) animals at day 3. In the left images, DAPI is shown in white and nuclei of LYVE-1-positive cells are shown in red. In the middle images, DAPI is shown in white, LYVE-1 is shown in cyan, filamentous actin is shown in green, and gated LYVE-1-positive nuclei are shown in red. E: serum creatinine (sCr) levels were measured and expressed as mg/dL at day 3. Scatterplots with percentages of total LYVE-1-positive cells (F), LYVE-1-Hi (G), and LYVE-1-Lo (H) gated cells. Quantifications obtained from Volumetric Tissue Exploration and Analysis were plotted, showing percentages out of the total number of cells. Data are expressed as means ± SE; n = 3 animals per group. *P < 0.05 vs. vehicle control; #P < 0.05 vs. Cp + DMSO using one-way ANOVA followed by a Tukey’s multiple comparisons test.
Figure 5.
Figure 5.
The autofluorescence imaging signature reveals erythrocyte-associated vascular congestion in cisplatin (Cp)-treated animals without MAZ51 treatment. Maximum projection images of three-dimensional volume of autofluorescence of Cp + vehicle-treated (A) and Cp + MAZ51-treated (B) whole kidney sections (left; scale bar = 500 µm) and high-magnification insets (right; scale bar = 50 µm). C: quantification obtained from volumetric tissue exploration and analysis was plotted, showing percentages of autofluorescent cells out of the total number of cells. Data are expressed as means ± SE; n = 3 animals per group. *P < 0.05 vs. vehicle control; #P < 0.05 vs. Cp + DMSO using one-way ANOVA followed by a Tukey’s multiple comparisons test.
Figure 6.
Figure 6.
Visualization and analysis of endomucin (Emcn)-positive and von Willebrand factor (vWF)-positive cells. Large-scale three-dimensional imaging of saline + DMSO-treated (A), saline + MAZ51-treated (B), cisplatin (Cp) + DMSO-treated (C), and Cp + MAZ51-treated (D) animals at day 3. The white rectangles correspond to the two insets with Emcn (E) or wWF (F) alone. Scale bars = 500 µm in B and 50 µm in B, right inset. Quantification of the immunofluorescent area corresponding to Emcn-positive (E) and vWF (F)-positive cells. G: Western blot analysis of vascular endothelial growth factor receptor 2 (VEGFR2) expression levels. Anti-β-actin was used as a loading control. Densitometric values were calculated and expressed in arbitrary units (AU). Data are expressed as means ± SE; n = 5–10 animals per group.

References

    1. Levey AS, Eckardt KU, Dorman NM, Christiansen SL, Hoorn EJ, Ingelfinger JR, Inker LA, et al. Nomenclature for kidney function and disease: report of a Kidney Disease: improving Global Outcomes (KDIGO) Consensus Conference. Kidney Int 97: 1117–1129, 2020. doi: 10.1016/j.kint.2020.02.010. - DOI - PubMed
    1. Neyra JA, Chawla LS. Acute kidney disease to chronic kidney disease. Crit Care Clin 37: 453–474, 2021. doi: 10.1016/j.ccc.2020.11.013. - DOI - PubMed
    1. Gansevoort RT, Correa-Rotter R, Hemmelgarn BR, Jafar TH, Heerspink HJ, Mann JF, Matsushita K, Wen CP. Chronic kidney disease and cardiovascular risk: epidemiology, mechanisms, and prevention. Lancet 382: 339–352, 2013. doi: 10.1016/S0140-6736(13)60595-4. - DOI - PubMed
    1. Moe SM, Chen NX. Mechanisms of vascular calcification in chronic kidney disease. J Am Soc Nephrol 19: 213–216, 2008. doi: 10.1681/ASN.2007080854. - DOI - PubMed
    1. Agarwal R, Pappas MK, Sinha AD. Masked uncontrolled hypertension in CKD. J Am Soc Nephrol 27: 924–932, 2016. doi: 10.1681/ASN.2015030243. - DOI - PMC - PubMed

Publication types

MeSH terms