. 2021 Dec 15:344:117759.
doi: 10.1016/j.molliq.2021.117759. Epub 2021 Oct 9.

Mechanism of the enhancing effect of glycyrrhizin on nifedipine penetration through a lipid membrane

Affiliations

Mechanism of the enhancing effect of glycyrrhizin on nifedipine penetration through a lipid membrane

A V Kim et al. J Mol Liq. .

Abstract

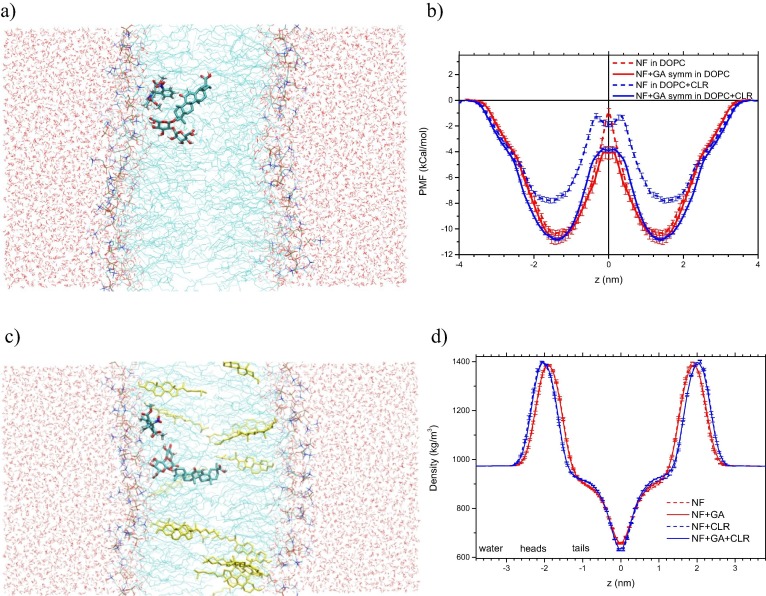
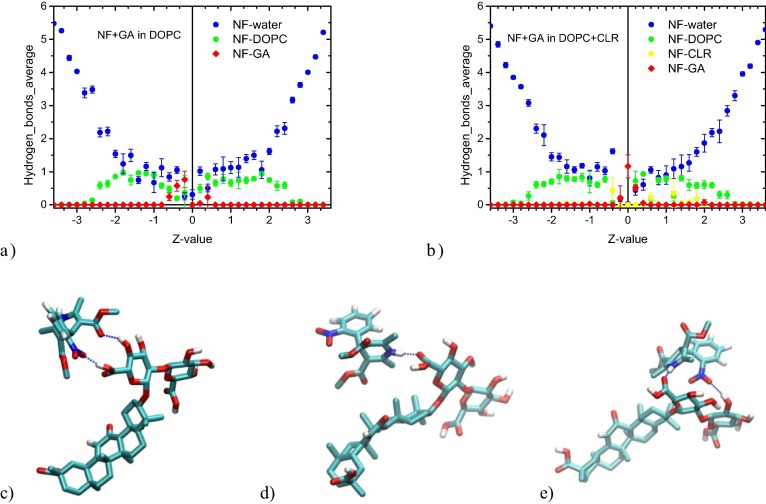
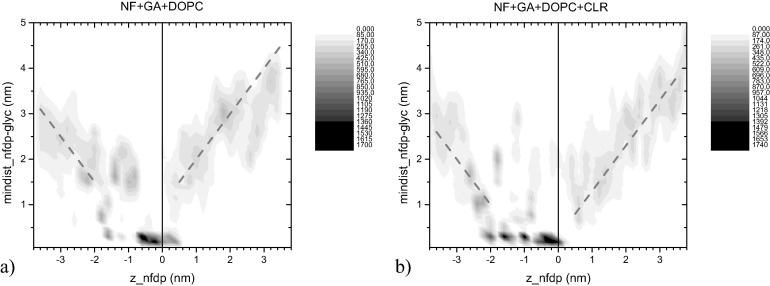
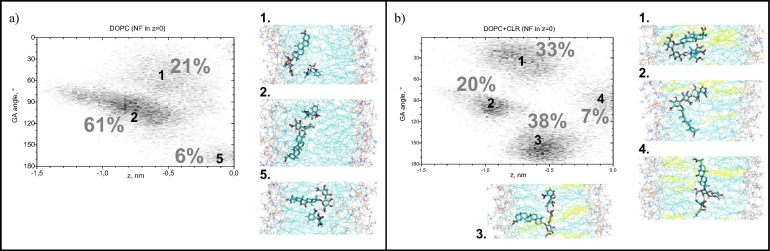
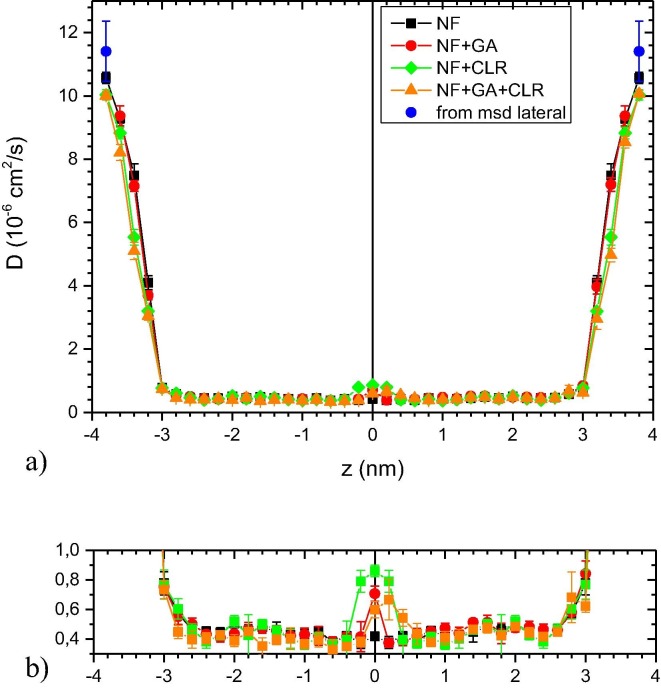
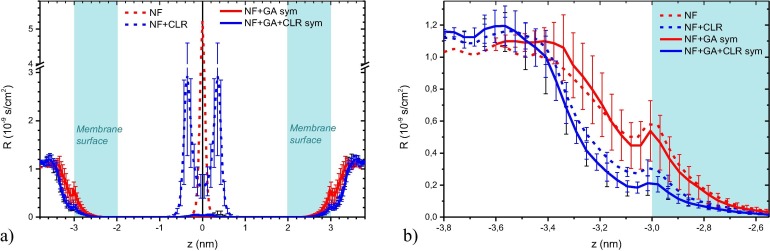
The saponin glycyrrhizin from liquorice root shows the ability to enhance the therapeutic activity of other drugs when used as a drug delivery system. Due to its amphiphilic properties, glycyrrhizin can form self-associates (dimers, micelles) and supramolecular complexes with a wide range of hydrophobic drugs, which leads to an increase in their solubility, stability and bioavailability. That is why the mechanism of the biological activity of glycyrrhizin is of considerable interest and has been the subject of intensive physical and chemical research in the last decade. Two mechanisms have been proposed to explain the effect of glycyrrhizin on drug bioavailability, namely, the increase in drug solubility in water and enhancement of the membrane permeability. Interest in the membrane-modifying ability of glycyrrhizic acid (GA) is also growing at present due to its recently discovered antiviral activity against SARS-CoV-2 Bailly and Vergoten (2020) [1]. In the present study, the passive permeability of the DOPC lipid membrane for the calcium channel blocker nifedipine was elucidated by parallel artificial membrane permeability assay (PAMPA) and full atomistic molecular dynamics (MD) simulation with free energy calculations. PAMPA experiments show a remarkable increase in the amount of nifedipine (NF) permeated with glycyrrhizin compared to free NF. In previous studies, we have shown using MD techniques that glycyrrhizin molecules can integrate into the lipid bilayer. In this study, MD simulation demonstrates a significant decrease in the energy barrier of NF penetration through the lipid bilayer in the presence of glycyrrhizin both in the pure DOPC membrane and in the membrane with cholesterol. This effect can be explained by the formation of hydrogen bonds between NF and GA in the middle of the bilayer.

Keywords: CLR, cholesterol; DDS, drug delivery system; DOPC; DOPC, dioleoylphosphatidylcholine; Drug delivery; GA, glycyrrhizic acid; Glycyrrhizin; Lipid bilayer; MD, molecular dynamics; Membrane penetration; Molecular dynamics; NF, nifedipine; NMR; NMR, nuclear magnetic resonance; Nifedipine; PAMPA; PAMPA, parallel artificial membrane permeability assay; PMF, potential of mean force; TBK, tebuconazole; VDW, Van der Waals.


Conflict of interest statement

The authors declare that they have no known competing financial interests or personal relationships that could have appeared to influence the work reported in this paper.

Figures

Fig. 1
Fig. 1
Structural formulas of nifedipine (NF), glycyrrhizic acid (GA), and 1,2-dioleoyl-sn-glycero-3-phosphocholine (DOPC).
Fig. 2
Fig. 2
The parallel artificial membrane permeability assay of nifedipine (saturated solution (1)) and its complex with GA. The concentration of GA is 0.5 mM (2), 1 mM (3), and 5 mM (4).
Fig. 3
Fig. 3
a) The starting configuration for NF simulation in the vicinity of the DOPC lipid bilayer. DOPC and water molecules are shown by lines, NF - by VDW spheres. b) z-position of the NF molecule relative to the center of the DOPC bilayer for: 1) NF near pure DOPC (black), 2) NF and GA complex near pure DOPC (red), 3) NF near DOPC with CLR (green) and 4) NF and GA complex next to DOPC with CLR (blue). c) Minimum distance between NF and GA in the pure DOPC membrane (red) and DOPC + CLR for two runs, shown in blue and dark blue. In the “dark blue” case, the GA molecule passed into the next half-layer and remained there until the end of the simulation.
Fig. 4
Fig. 4
a), b), c) the simulated GA/NF complexes in a 2:1 ratio obtained in this work, 3 types of complexes: d), e) - the surface of the GA dimer is shown as a wireframe, so the pocket for the guest molecule of GA can be seen.
Fig. 5
Fig. 5
Penetration of the GA/NF complex 2:1 inside the DOPC bilayer. a) initial configuration, b) penetration, c) the complex fell apart inside the bilayer. The nifedipine molecule is shown with its van der Waals radii; GA molecules are shown in bold lines. Water molecules are not shown for clarity.
Fig. 6
Fig. 6
Time dependence of the minimum distances between the complex and the terminal C atoms of DOPC lipids (black line), and between the nifedipine and GA molecules (blue line) for four independent runs.
Fig. 7
Fig. 7
a) A typical view of the DOPC membrane for PMF calculation. b) symmetrized free energy profiles for the penetration of NF through the lipid bilayer (dashed lines) and the membrane with the GA molecule (solid line). The blue and red colors of the lines correspond to the DOPC bilayer with and without cholesterol, respectively. c) the same as a), but with cholesterol in the membrane. d) Local density profile of all four systems; enlarged portions of the profile can be found in Figure S10.
Fig. 8
Fig. 8
Profiles of the number of hydrogen bonds of the NF molecule with water molecules (blue circles), DOPC atoms (green squares), and GA molecule (red diamonds) in the systems: a) DOPC + GA membrane, b) DOPC + CLR + GA membrane. A set of simulations for PMF calculating was used as a data source, so the abscissa z corresponds to the position of the NF in the membrane. The left half-layer (z < 0) contains the GA molecule. c), d), e) - examples of H-bonds between GA and NF molecules from the DOPC + GA system; examples from the system with CLR are almost the same and are shown in Figure S12.
Fig. 9
Fig. 9
a) The thickness of the membrane for all 4 systems depending on the location of the NF molecule (umbrella windows); b) the area per lipid. A system with pure DOPC is shown in yellow, DOPC with GA in green, DOPC with CLR only in red, and DOPC with CLR and GA in blue. Both plots are symmetrized around z = 0.
Fig. 10
Fig. 10
DOPC order parameter of lipids around GA for the distances between GA and the center of mass of the lipid molecule: < 0.5 nm (red), 0.5–1.5 nm (violet), lipids from another half-layer relative to GA (green) and for the model of the pure lipid bilayer.
Fig. 11
Fig. 11
The minimum distance between GA and NF depending on the NF position in a) DOPC, b) DOPC with CLR. The darkness indicates the population of such a minimum distance. The GA molecule moves freely in the left half of the membrane (z < 0). The dashed lines have a slope of ± 1.
Fig. 12
Fig. 12
Selection of the GA backbone vector.
Fig. 13
Fig. 13
The population of the angle-position diagrams of the GA molecule: ordinate axis - the angle of the GA backbone and the normal to the closest membrane surface and abscissa axis - the position of the GA center of mass (COM). The NF molecule is constrained in the middle of the membrane. Columns a) and b) correspond to the pure DOPC membrane and DOPC + CLR, respectively. The states observed in the diagrams are numbered, and typical examples of the corresponding configurations are shown next to the diagrams (CLR molecules are colored yellow, water molecules are not shown). The membrane without CLR (column a) contains the GA molecule oriented parallel to the membrane surface, and in the membrane with CLR (column b) the GA is perpendicular to the surface.
Fig. 14
Fig. 14
Diffusion coefficient profile of NF penetration through the pure DOPC lipid bilayer without GA (black squares) and with GA (red circles), DOPC + CLR without GA (green rhombs) and with (orange triangles). a) - full scale, b) - enlarged scale. D values calculated from the mean square deviation of NF lateral diffusion at z = ±3.8 nm are shown with blue circles.
Fig. 15
Fig. 15
a) Local resistance to penetration of NF through pure DOPC (red) and DOPC with CLR (blue) in the absence of GA (dashed lines) and in the presence (solid). b) Resistivity of the surface in more detail.
Fig. 16
Fig. 16
Accumulated permeability of NF through the membrane.

References

    1. Bailly C., Vergoten G. Glycyrrhizin: An alternative drug for the treatment of COVID-19 infection and the associated respiratory syndrome? Pharmacol. Therapeut. 2020;214:107618. doi: 10.1016/j.pharmthera.2020.107618. - DOI - PMC - PubMed
    1. Lopalco A., Denora N. Nanoformulations for Drug Delivery: Safety, Toxicity, and Efficacy. Meth. Mol. Biol. 2018;1800:347–365. doi: 10.1007/978-1-4939-7899-1_17. - DOI - PubMed
    1. Tekade R.K., Maheshwari R., Tekade M. Biopolymer-Based Composites. Elsevier; 2017. pp. 81–106. - DOI
    1. Dushkin A.V., Tolstikova T.G., Khvostov M.V., Tolstikov G.A. In: The Complex World of Polysaccharides. Karunaratne D.N., editor. InTech, RijdrugCroatia; 2012. Complexes of polysaccharides and glycyrrhizic acid with drug molecules. Mechanochemical synthesis and pharmacological activity; pp. 573–602. - DOI
    1. Kumari A., Yadav S.K., Yadav S.C. Biodegradable polymeric nanoparticles based drug delivery systems. Colloids Surf. B. 2010;75(1):1–18. doi: 10.1016/j.colsurfb.2009.09.001. - DOI - PubMed

LinkOut - more resources