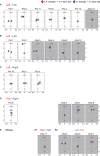
Skill Differences in a Discrete Motor Task Emerging From the Environmental Perception Phase
- PMID: 34659013
- PMCID: PMC8517186
- DOI: 10.3389/fpsyg.2021.697914
Skill Differences in a Discrete Motor Task Emerging From the Environmental Perception Phase
Abstract
Because of the challenges associated with measuring human perception and strategy, the process of human performance from perception to motion to results is not fully understood. Therefore, this study clarifies the phase at which errors occur and how differences in skill level manifest in a motor task requiring an accurate environmental perception and fine movement control. We assigned a golf putting task and comprehensively examined various errors committed in five phases of execution. Twelve tour professionals and twelve intermediate amateur golfers performed the putting task on two surface conditions: flat and a 0.4-degree incline. The participants were instructed to describe the topographical characteristics of the green before starting the trials on each surface (environmental perception phase). Before each attempt, the participants used the reflective markers to indicate their aim point from which the ball would be launched (decision-making phase). We measured the clubface angle and impact velocity to highlight the pre-motion and motion errors (pre-motion and motion phase). In addition, mistakes in the final ball position were analyzed as result errors (post-performance phase). Our results showed that more than half of the amateurs committed visual-somatosensory errors in the perception phase. Moreover, their aiming angles in the decision-making phase differed significantly from the professionals, with no significant differences between slope conditions. In addition, alignment errors, as reported in previous studies, occurred in the pre-motion phase regardless of skill level (i.e., increased in the 0.4-degree condition). In the motion phase, the intermediate-level amateurs could not adjust their clubhead velocity control to the appropriate level, and the clubhead velocity and clubface angle control were less reproducible than those of the professionals. To understand the amateur result errors in those who misperceived the slopes, we checked the individual results focusing on the final ball position. We found that most of these participants had poor performance, especially in the 0.4-degree condition. Our results suggest that the amateurs' pre-motion and strategy errors depended on their visual-somatosensory errors.
Keywords: alignment error; decision-making; golf putting; kinematics; slope perception.
Copyright © 2021 Hasegawa, Okada and Fujii.
Conflict of interest statement
The authors declare that the research was conducted in the absence of any commercial or financial relationships that could be construed as a potential conflict of interest.
Figures


Similar articles
-
Can golfers choose low-risk routes in steep putting based on visual feedback of ball trajectory?Front Sports Act Living. 2023 Aug 22;5:1131390. doi: 10.3389/fspor.2023.1131390. eCollection 2023. Front Sports Act Living. 2023. PMID: 37674636 Free PMC article.
-
Putting performance bias to the front-lower side of the hole on steep slopes: Differences in strategies and movements between professional and amateur golfers.PLoS One. 2024 Dec 31;19(12):e0314820. doi: 10.1371/journal.pone.0314820. eCollection 2024. PLoS One. 2024. PMID: 39739896 Free PMC article.
-
A sense of distance and movement characteristics of golfers tested without visual feedback of outcomes: Is a putt that feels subjectively good also physically good?Front Sports Act Living. 2022 Oct 25;4:987493. doi: 10.3389/fspor.2022.987493. eCollection 2022. Front Sports Act Living. 2022. PMID: 36385781 Free PMC article.
-
Practice Motions Performed During Preperformance Preparation Drive the Actual Motion of Golf Putting.Front Psychol. 2020 Mar 25;11:513. doi: 10.3389/fpsyg.2020.00513. eCollection 2020. Front Psychol. 2020. PMID: 32269542 Free PMC article.
-
Evidence for biomechanics and motor learning research improving golf performance.Sports Biomech. 2012 Jun;11(2):288-309. doi: 10.1080/14763141.2012.671354. Sports Biomech. 2012. PMID: 22900408 Review.
Cited by
-
Can golfers choose low-risk routes in steep putting based on visual feedback of ball trajectory?Front Sports Act Living. 2023 Aug 22;5:1131390. doi: 10.3389/fspor.2023.1131390. eCollection 2023. Front Sports Act Living. 2023. PMID: 37674636 Free PMC article.
-
Putting performance bias to the front-lower side of the hole on steep slopes: Differences in strategies and movements between professional and amateur golfers.PLoS One. 2024 Dec 31;19(12):e0314820. doi: 10.1371/journal.pone.0314820. eCollection 2024. PLoS One. 2024. PMID: 39739896 Free PMC article.
-
A sense of distance and movement characteristics of golfers tested without visual feedback of outcomes: Is a putt that feels subjectively good also physically good?Front Sports Act Living. 2022 Oct 25;4:987493. doi: 10.3389/fspor.2022.987493. eCollection 2022. Front Sports Act Living. 2022. PMID: 36385781 Free PMC article.
References
-
- Cohen J. (1988). Statistical Power Analysis for the Behavioral Sciences, 2nd Edn. Hillsdale, NJ: Lawrence Erlbaum Associates.
-
- de Groot A. D. (1965). Thought and Choice in Chess. The Hague: Mouton.
LinkOut - more resources
Full Text Sources

