. 2021 Sep 30:12:713304.
doi: 10.3389/fimmu.2021.713304. eCollection 2021.

IL-27 Derived From Macrophages Facilitates IL-15 Production and T Cell Maintenance Following Allergic Hypersensitivity Responses

Affiliations

IL-27 Derived From Macrophages Facilitates IL-15 Production and T Cell Maintenance Following Allergic Hypersensitivity Responses

Jutamas Suwanpradid et al. Front Immunol. .

Abstract

Crosstalk between T cells, dendritic cells, and macrophages in temporal leukocyte clusters within barrier tissues provides a new concept for T cell activation in the skin. Activated T cells from these leukocyte clusters play critical roles in the efferent phase of allergic contact hypersensitivity (CHS). However, the cytokines driving maintenance and survival of pathogenic T cells during and following CHS remain mostly unknown. Upon epicutaneous allergen challenge, we here report that macrophages produce IL-27 which then induces IL-15 production from epidermal keratinocytes and dermal myeloid cells within leukocyte clusters. In agreement with the known role of IL-15 as a T cell survival factor and growth cytokine, this signaling axis enhances BCL2 and survival of skin T cells. Genetic depletion or pharmacological blockade of IL-27 in CHS mice leads to abrogated epidermal IL-15 production resulting in a decrease in BCL2 expression in T cells and a decline in dermal CD8+ T cells and T cell cluster numbers. These findings suggest that the IL-27 pathway is an important cytokine for regulating cutaneous T cell immunity.

Keywords: BCL2; CD172a; IL-15; IL-27; STAT1; contact hypersensitivity; dermal leukocyte cluster; human allergic contact dermatitis.


Conflict of interest statement

Author AM has received funding from Silab, Inc. and has consulted for the company. AM also served on the reviewer committee for the LEO foundation and the Triangle Community Foundation. Author AA received a Pfizer Independent Grant for Learning and Change and has consulted for Henkel. The remaining authors declare that the research was conducted in the absence of any commercial or financial relationships that could be construed as a potential conflict of interest.

Figures
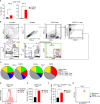
Figure 1
Figure 1
Exposure to allergen upregulates IL-27 in murine MACs during CHS. (A) Quantitative analysis of CD45+ hematopoietic cell frequency (in living cells) in DNFB-treated and vehicle-treated ear skin of the CHS mice (2 and 7 days post-DNFB elicitation). The data are represented as mean ± standard error of the mean (SEM) from at least 4 mice per group, *p < 0.05 (unpaired Student’s t test). (B) Gating strategies for skin myeloid cell population identification in the CHS mouse model. Single-cell suspensions of mouse ear skin treated were prepared. After excluding dead cells, as well as Lin+; including T cells, NK cells, B cells, and granulocytes, the remaining CD45+ cells were analyzed for expression of CD24 and CD11b. CD11b+CD24-/lo cells were further analyzed for Ly-6C, CD64, and CCR2 expression. The CD11b+non-DCs fraction was separated into monocyte and macrophages (MACs) populations, respectively. (C) Pie charts summarizing immune cell distribution (gated on CD45+Lin- cells) from mouse ear skin at 2 and 7 days post-DNFB elicitation. The data represent the mean of at least 4 mice per treatment group. (D) Histogram from representative flow cytometry analysis for IL-27p28 of vehicle-treated and DNFB-treated ears gated on CD45+ cells. Data shown are representative of at least 4 mice per group. (E) Data presented shows median fluorescence intensity (MFI) of IL-27p28 in the CD45+ population from ll-27p28EGFP mice at 7 days post DNFB-elicitation versus vehicle controls from at least 4 mice per group and are depicted as mean ± SEM, *p < 0.05 (unpaired Student’s t test). (F) Quantitative analysis of CD172a+IL-27p28EGFP+ cell frequency of CD45+Lin- CD11b+ cells in DNFB-treated and vehicle-treated ear skin. At least 4 mice per group and summarized as mean ± SEM, *p < 0.05 (unpaired Student’s t test). (G) Representative flow cytometric overlay dot plots of gated monocytes, MACs, and CD11b+ DCs at 7 days post-DNFB elicitation on mouse ear skin demonstrating CD172a and IL-27p28 expression from at least 4 mice per group.
Figure 2
Figure 2
Myeloid cells produce IL-27 upon allergen exposure. (A) Heat map showing gene expression patterns of patch-tested skin from allergic contact dermatitis patients (GSE number: 6281). Samples for gene expression analysis were collected from positive patch-test reactions to nickel at 7, 48, and 96 hours post-elicitation as well as the 0h control. Samples and genes are clustered using correlation distance with complete linkage. (B) Representative immunofluorescence staining of IL-27 (red), CD14 (green), CD86 (purple), CD3 (white) and Hoechst (blue) in human donor-matched patch-test negative control and patch-test (+) ACD skin. Data are representative of 3 patient samples per stained condition. Original magnification x100 (left) and original magnification x400 (right) with scale bars 100 µm, and 20 µm, respectively. White dashed lines mark the epidermal-dermal junction. (C) Analysis depicting total numbers of dermal IL-27+ cells in donor-matched patch-test negative control and patch-test (+) ACD samples. Data are expressed as mean ± SEM from at least three separate microscopic fields from 3 patients, *p < 0.05 (unpaired Student’s t test). (D, E) Quantitative PCR and representative immunofluorescence staining of IL-27 of THP-1 cells treated with (D) nickel chloride (NiCl2, 100µM) and (E) dinitrobenzene sulfonic acid (DNBS, 0.05%) at various time points. Data are summarized as mean ± SEM from at least 3 biological replicates, *p < 0.05 (ANOVA test with Bonferroni correction).
Figure 3
Figure 3
CD3, CD47, and CD172a expression in human ACD clusters. (A–C) Immunofluorescence staining of CD3 (green), CD47 (red), CD172a (purple), CD14 [green, a serial slide section with the staining of CD172a (purple)], and Hoechst (blue) in human donor-matched patch-test negative control and patch-test (+) ACD skin. White dashed lines mark the epidermal-dermal junction. Data are representative of 3 patient samples per tested condition. (A) Scale bars are 200 µm (left) and 100 µm (right). (B, C) Scale bars are 20 µm.
Figure 4
Figure 4
MAC-derived IL-27p28 mediates CHS inflammation and maintenance of dermal T cell numbers. (A) Il-27p28fl/fl;LysMCre+/- and Il-27p28fl/fl;LysMCre-/- control mice (Ctrls) were sensitized and elicited with DNFB 2 times. Ear swelling was measured daily and is depicted as mean ± SEM from at least 5 mice per group, *p < 0.05 (ANOVA test followed by least-significant differences multi-comparison (LSD) test). (B) Representative immunofluorescence staining showing CD3 (red), CD8 (green), and Hoechst (blue) in DNFB-treated back skin from Il-27p28fl/fl;LysMCre+/- and Il-27p28fl/fl;LysMCre control mice (Ctrls). Data are representative of 3 mice per group. Original magnification x200 with scale bars 50 µm. White dashed lines mark the epidermal-dermal junction. (C) Analysis of total numbers of CD3+CD8- and CD3+CD8+ T cells of mouse back skin. Data depicted as mean ± SEM from 3 mice per group using at least 3 microscopic views (area = 450 µm2), unpaired Student’s t test, *p < 0.05.
Figure 5
Figure 5
IL-27 upregulates IL-15 production through a STAT1-dependent signaling pathway. (A) Overlap of genes that had a p-value ≤ 0.05 and at least a 50% increase in expression in each of the three datasets gene expression datasets. For the NHEK and THP-1 datasets, the 50% increase in expression was in the recombinant human IL-27 stimulated cells (rhIL-27, 100ng/ml). (B) Quantitative PCR of IL15 in NHEKs and THP1 stimulated with rhIL-27 (100 ng/ml). Data are summarized as mean ± SEM from at least 3 biological replicates, *p < 0.05 (ANOVA). (C) The biocomputational analysis from pathwaycommon® representing the association pathways/molecules of IL-27 from open public data sets. (D–G) Quantitative PCR of IL15 in NHEKs transfected with siRNAs specific for (D) IFNAR1, (E) STAT1, (F) STAT3, and (G) JAK1 expression and then stimulated with rhIL-27(100 ng/ml). Data are summarized as mean ± SEM from 1-2 biological replicates *p < 0.05; n.s., not significant (ANOVA). (H) Quantitative PCR of ll15 in the ear epidermis and dermis from the CHS murine model using DNFB hapten allergen (0.1% DNFB, applied topically every 1-2 months). The mice received nIL-27Ab (i.d.) 40 days after elicitation and the skins were harvested 6 hours later. Data are representative of at least 3 mice per group and summarized as mean ± SEM, *p < 0.05; n.s., not significant (unpaired Student’s t test).
Figure 6
Figure 6
IL-15 restores skin inflammation in mice treated with neutralizing IL-27 antibody (nIL-27p28AB). (A, B) Wild-type (WT) mice were sensitized and elicited with (A) DNFB or (B) vehicle and treated with nIL-27p28AB, nIL-27p28AB + IL15 complex (cpx) (IL-15 + IL-15Rα), IL-15 cpx + IgG, or IgG at day 7 after the first ear elicitation. 2 days later, the mice were re-elicited with DNFB on the ear. Ear swelling was measured daily and is depicted as mean ± SEM from at least 3-4 mice per group, # and *p < 0.05 (ANOVA). # symbolizes the difference between IgG and nIL-27AB. * symbolizes the difference between nIL-27AB and IL-15 + IgG.
Figure 7
Figure 7
IL-15 enhances human BCL2 expression in skin T cells. (A) Representative immunofluorescence staining of CD3 (green), IL-15 (red), BCL2 (purple), and Hoechst (blue) in human donor-matched patch-test negative control and patch-test (+) ACD skin. Data are representative of patient samples per tested condition (at least 3 samples per condition). Original magnification x400 (stitched images) with scale bars of 100 µm. White dashed lines mark the epidermal-dermal junction. (B) Representative immunofluorescence staining of CD3 (green), CD8 (red), and Hoechst (blue) in human patch-test (+) ACD skin. Data are representative of patient samples per tested condition (at least 3 samples per condition). Original magnification x400 with scale bars 100 µm. White dashed lines mark the epidermal-dermal junction. (C) Quantification of flow cytometry analysis of healthy human skin explant T cells treated with rhIL-15 and rhIL-27 for 24 hours. Cells were gated on live cells and CD3+CD45RO+cells subsequently gated on CD3+ BCL2hi and BCL2hi cells, respectively. Data are summarized as mean ± SEM, *p < 0.05 (paired Student’s t test).
Figure 8
Figure 8
IL-27p28 is required for T cell maintenance post-elicitation. (A) Representative immunofluorescence staining showing CD3 (red), CD8 (green), and Hoechst (blue) in back skin from the CHS mice treated with neutralizing IL-27p28 antibody (nIL-27p28AB) or control IgG. The mice started to receive nIL-27p28AB 70 days after elicitation and the mouse skin were harvested 2 days after the first treatment. White arrows indicate leukocyte clusters. Data are representative of 4 mice. Original magnification x200 with scale bars 100 µm. White dashed lines mark the epidermal-dermal junction. (B) Analysis of total numbers of CD3+CD8- and CD3+CD8+ T cells of mouse back skin following nIL-27p28AB treatment. Data are depicted as mean ± SEM from 4 mice per group using at least 3 microscopic views (area = 450 µm2), *p < 0.05; n.s., not significant (unpaired Student’s t test). (C) Analysis depicting total numbers of CD3+ T cell clusters (size of CD3+ cell diameter > 20 µM) of mice back skin upon treatment with nIL-27p28AB (6 µg, 3 times twice a day). Data are depicted as mean ± SEM from 4 mice per group using at least 3 microscopic views (area = 450 µm2), *p < 0.05 (unpaired Student’s t test). (D–H) Flow cytometry analysis of repetitive DNFB exposure mouse ear upon injection with nIL-27p28AB (12 µg) or IgG vehicle control for 2 days showing mean frequency ± SEM of total (D) Thy1.2+ cell and (E) CD44+ and (F) CD44- cells in Thy1.2+ cells. Representative (G) histogram and (H) frequency of BCL2 that are gated on Thy1.2+, Thy1.2+CD44+, or Thy1.2+CD44- cells. Data are depicted as mean plusmn; SEM from at least 4 mice per group, *p < 0.05; n.s., not significant (unpaired Student’s t test). (I) Same experimental setting as in (D), the mice either received nIL-27p28AB or their appropriate control IgG. Flow cytometry analysis depicting the mean frequency ± SEM of total BCL2+ in Thy1.2+CD8+ cells for at least 4 mice per group and summarized as mean ± SEM, unpaired Student’s t test, *p < 0.05. (J) Similar experimental setting as in (I), the mice either received neutralizing CD122 antibody (nCD122AB) or their appropriate control IgG. Flow cytometry analysis depicting the mean frequency ± SEM of total BCL2+ in Thy1.2+CD8+ cells from at least 4 mice per group and summarized as mean ± SEM, unpaired Student’s t test, *p < 0.05.

References

    1. Hanifin JM, Reed ML, Eczema Prevalence and Impact Working Group . A Population-Based Survey of Eczema Prevalence in the United States. Dermatitis (2007) 18:82–91. doi: 10.2310/6620.2007.06034 - DOI - PubMed
    1. Shaw TE, Currie GP, Koudelka CW, Simpson EL. Eczema Prevalence in the United States: Data From the 2003 National Survey of Children’s Health. J Invest Dermatol (2011) 131:67–73. doi: 10.1038/jid.2010.251 - DOI - PMC - PubMed
    1. Silverberg JI, Simpson EL. Association Between Severe Eczema in Children and Multiple Comorbid Conditions and Increased Healthcare Utilization. Pediatr Allergy Immunol (2013) 24:476–86. doi: 10.1111/pai.12095 - DOI - PMC - PubMed
    1. AS OG, Jee MH, Funch AB, Alhede M, Mraz V, Weber JF, et al. . Pathogenic CD8(+) Epidermis-Resident Memory T Cells Displace Dendritic Epidermal T Cells in Allergic Dermatitis. J Invest Dermatol (2019) 140:806–15. doi: 10.1016/j.jid.2019.07.722 - DOI - PubMed
    1. Harty JT, Badovinac VP. Shaping and Reshaping CD8+ T-Cell Memory. Nat Rev Immunol (2008) 8:107–19. doi: 10.1038/nri2251 - DOI - PubMed

Publication types

MeSH terms