. 2021 Sep 30:12:717873.
doi: 10.3389/fimmu.2021.717873. eCollection 2021.

Diagnostic Vaccination in Clinical Practice

Affiliations

Diagnostic Vaccination in Clinical Practice

Anette Tarp Hansen et al. Front Immunol. .

Abstract

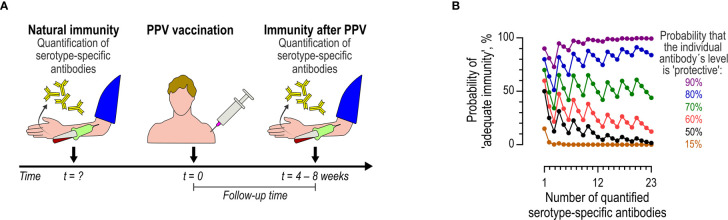
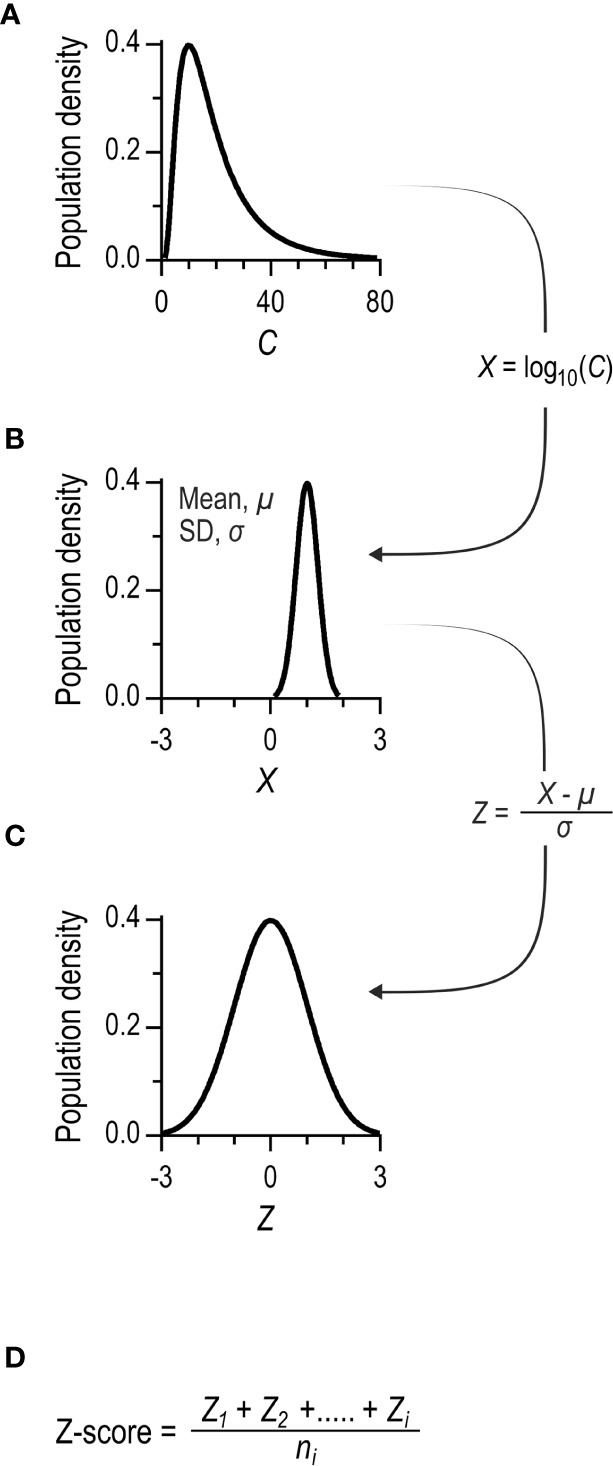
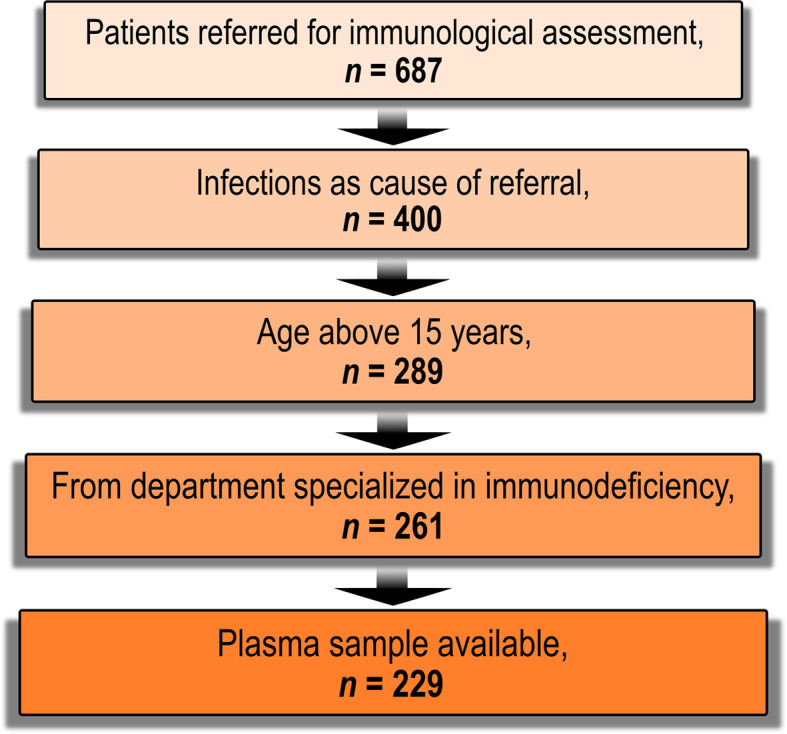
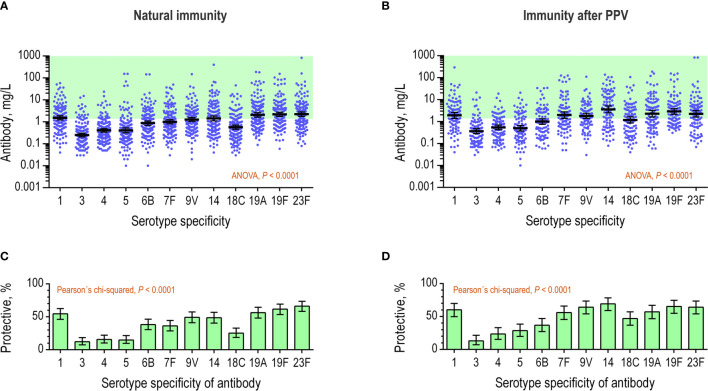
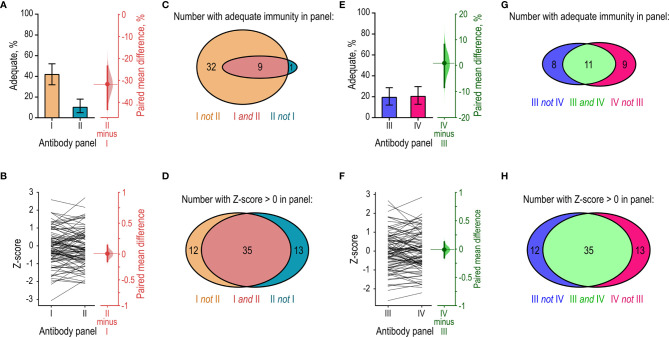
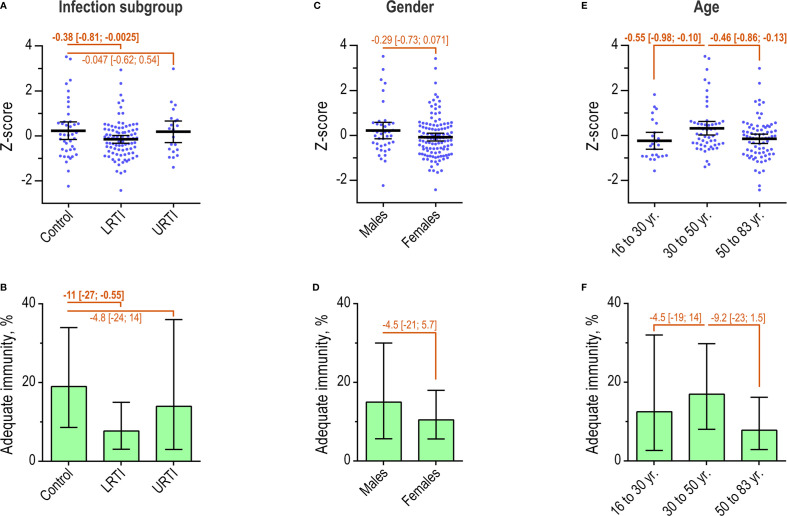
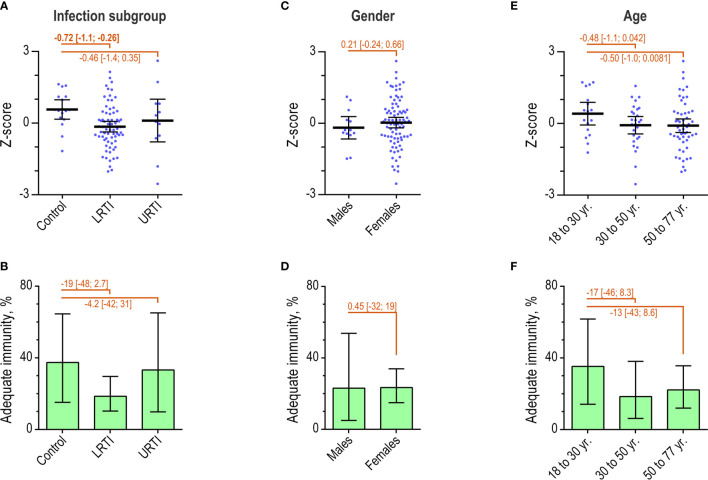
Testing the antibody response to vaccination (diagnostic vaccination) is crucial in the clinical evaluation of primary immunodeficiency diseases. Guidelines from the American Academy of Allergy, Asthma & Immunology (AAAAI) provide detailed recommendations for diagnostic vaccination with pure pneumococcal polysaccharide vaccines (PPV). However, the degree of compliance with these guidelines and the utility of the guidelines in actual practice are undescribed. To address this, we systematically evaluated diagnostic vaccination in adult patients with suspected primary immunodeficiency diseases in a single tertiary center from 2011 to 2016 (n = 229). We found that full compliance with the AAAAI guidelines was achieved for only 39 patients (17%), suggesting that the guidelines are not easy to follow. Worse, interpretation according to the guidelines was heavily influenced by which serotype-specific antibodies that were used for the evaluation. We found that the arbitrary choices of serotype-specific antibodies could change the fraction of patients deemed to have 'adequate immunity' by a factor of four, exposing an inherent flaw in the guidelines. The flaw relates to dichotomous principles for data interpretation under the AAAAI guidelines. We therefore propose a revised protocol for diagnostic vaccination limited to PPV vaccination, subsequent antibody measurements, and data interpretation using Z-scores. The Z-score compiles multiple individual antibody levels, adjusted for different weighting, into one single continuous variable for each patient. In contrast to interpretation according to the AAAAI guidelines, the Z-scores were robust to variations in the choice of serotype-specific antibodies used for interpretation. Moreover, Z-scores revealed reduced immunity after vaccination in the patients with recurrent pneumonia (a typical symptom of antibody deficiency) compared with control patients. Assessment according to the AAAAI guidelines failed to detect this difference. We conclude that our simplified protocol and interpretation with Z-scores provides more robust clinical results and may enhance the value of diagnostic vaccination.

Keywords: antibody deficiency; clinical guidelines; diagnostic vaccination; pneumococcal vaccines; primary immunodeficiency; vaccination; z-score.


Conflict of interest statement

The authors declare that the research was conducted in the absence of any commercial or financial relationships that could be construed as a potential conflict of interest.

Figures

Figure 1
Figure 1
Diagnostic vaccination according to the AAAAI guidelines. (A) Flow of events. The preexisting immunity (natural immunity), represented by the levels of multiple (undefined number) serotype-specific antibodies, is determined at an undefined time-point before vaccination (t = ?). Later, PPV is administered (t = 0). The immunity after PPV is assayed four to eight weeks later by quantifying the same serotype-specific antibodies. (B) Model showing the theoretical probability of achieving adequate immunity (y-axis, left) according to the AAAAI guidelines (i.e., the probability of at least 70% of serotype-specific antibodies reaching levels of at least 1.3 mg/L) as a function of the number (x-axis) of tested serotype-specific antibodies. The colored curves represent different probabilities of an individual antibody being classified as ‘protective’ (i.e., a level of at least 1.3 mg/L). The probability of achieving ‘adequate immunity’ follows the binomial distribution, under the simplifying assumption that the individual serotype-specific antibodies in a given panel have equal likelihoods of being at the ‘protective’ level (although this will rarely be the case, the simplification nonetheless serves to illustrate the underlying problem).
Figure 2
Figure 2
Principles for calculating Z-scores. (A) The distribution of serum concentrations of a serotype-specific antibody in a population. The distribution is typically left-skewed. (B) Log10 transformation of data results in Gaussian distribution. (C) The individual concentrations are further transformed to standard normal distributions. This is achieved by subtracting the mean and dividing by the standard deviation of the population dataset. The final parameter is dimensionless, and the population data set has a mean of 0 and a standard deviation of 1. (D) The Z-score is calculated for each patient as the mean of the standard normal deviations of the individual antibody levels. The Z-score´s standard deviation tends to decrease with an increasing number of distinct serotype-specific antibody levels, owing to mutual correlations (10). To promote comparability of cohorts tested with different number of measured serotype-specific antibody levels, the Z-score is normalized by the standard deviation of the population dataset.
Figure 3
Figure 3
Flow-chart of patient enrolment. Candidates eligible for inclusion were patients referred for advanced laboratory assessment of immunodeficiency at the department of Clinical Immunology, Aarhus University Hospital, Denmark between 12 May, 2011 and 18 August, 2016 (n = 687). Patients without an increased susceptibility to infections were excluded (n = 287). Patients younger than 16 years were excluded (n = 111) as diagnostic vaccination is not local practice in these patients. We also excluded patients who were referred from departments not specialized in immunodeficiency (n = 28). Patients without a previously archived plasma sample were also excluded (n = 32).
Figure 4
Figure 4
Serotype-specific antibody levels in the patient serum samples. The concentrations (mg/L) of 12 different antibodies were determined in serum samples by a multiplex, bead-based assay. (A) The natural immunity of the patients (n = 154) displayed for each of the antibodies as continuous variables. The green area indicates concentrations of at least 1.3 mg/L, which is considered as ‘protective’ under AAAAI guidelines. Error bars are geometrical means with 95% confidence intervals. The antibodies were tested for different levels using repeated-measures ANOVA. (B) Data from previous panel showing the proportion of patients with antibody levels of at least 1.3 mg/L (i.e., ‘protective level’) for each specific antibody. (C) As in the panel A, but for levels measured in serum samples collected after PPV vaccination (n = 98). (D) Data from previous panel, showing the proportion of patients with antibody levels of at least 1.3 mg/L for each specific antibody.
Figure 5
Figure 5
Sensitivity-analysis of interpretation using the AAAAI guidelines and Z-scores. The same cohort of patients (n = 98) were assessed for adequate immunity after PPV vaccination using different panels of serotype-specific antibodies for the interpretation. Each panel contained six out of the 12 quantified serotype-specific antibodies. (A) Left: The proportions of patients considered to have achieved ‘adequate immunity’ in each of two antibody panels (I and II) according to the AAAAI guidelines. Right: The paired mean difference in proportions (dot) with 95% confidence interval (vertical error lines) and bootstrap sampling distribution (normalized histogram). Panel I contained the six serotype-specific antibodies that most frequently had levels of 1.3 mg/L or higher in the patients. Panel II contained the six serotype-specific antibodies that least frequently had levels of 1.3 mg/L or higher in the patients. (B) Left: Paired Z-scores for the individual patients calculated using data from panel I and panel II. Right: The paired mean difference in Z-score from the two panels. (C) Venn-diagram showing the number of patients with adequate immunity in panels I and II under AAAAI guidelines. Panels I and II identified an unequal numbers of the patients, and the results showed little overlap. (D) As in (C), but for Z-scores. Panels I and II now identified comparable numbers of the patients, and the results largely overlapped. (E) As in (A), but for two other panels (III and IV). These panels were composed to provide an equal proportion of patients with ‘adequate immunity’ under AAAAI guidelines. (F) Comparison of the Z-scores calculated for the patients using the data from panels III and IV. (G) Venn-diagram showing the number of patients with adequate immunity in panels III and IV according to the AAAAI guidelines. Panels III and IV identified comparable numbers of the patients, but the results showed little overlap. (H) As in (G), but for Z-scores. Panels III and IV identified comparable numbers of the patients, and the results largely overlapped.
Figure 6
Figure 6
Natural immunity in patient subgroups. (A) Individual Z-scores and mean with 95% confidence interval for patients (n = 154), by infection profiles. Differences between groups were determined as indicated. (B) The percentage of patients with ‘adequate’ immunity according to the AAAAI guidelines, by infection profiles. Error bars are 95% confidence intervals. (C) As in A, but for patients by gender. (D) As in B, but for patients by gender. (E) Individual Z-scores for patients by age intervals. (F) As in B, but for patients by age group.
Figure 7
Figure 7
Immunity after PPV in patient subgroups. (A) Individual Z-scores and mean with 95% confidence interval for patients (n = 98) by infection profiles. Differences between groups were determined as indicated. (B) The percentage of patients with ‘adequate’ immunity according to the AAAAI guidelines, by infection profiles. Error bars are 95% confidence intervals. (C) As in A, but for patients by gender. (D) As in B, but for patients by gender. (E) Individual Z-scores for patients by age intervals. (F) As in B, but for patients by age group.

References

    1. Bonilla FA, Khan DA, Ballas ZK, Chinen J, Frank MM, Hsu JT, et al. . Practice Parameter for the Diagnosis and Management of Primary Immunodeficiency. J Allergy Clin Immunol (2015) 136(5):1186–205.e1-78. doi: 10.1016/j.jaci.2015.04.049 - DOI - PubMed
    1. Seidel MG, Kindle G, Gathmann B, Quinti I, Buckland M, van Montfrans J, et al. . The European Society for Immunodeficiencies (ESID) Registry Working Definitions for the Clinical Diagnosis of Inborn Errors of Immunity. J Allergy Clin Immunol Pract (2019) 7(6):1763–70. doi: 10.1016/j.jaip.2019.02.004 - DOI - PubMed
    1. (LASID) LAfI . Primary Immunodeficiency (2021). Available at: https://lasid.org/primary-immunodeficiency/.
    1. Bousfiha A, Jeddane L, Picard C, Al-Herz W, Ailal F, Chatila T, et al. . Human Inborn Errors of Immunity: 2019 Update of the IUIS Phenotypical Classification. J Clin Immunol (2020) 40(1):66–81. doi: 10.1007/s10875-020-00758-x - DOI - PMC - PubMed
    1. Winkelstein JA, Marino MC, Lederman HM, Jones SM, Sullivan K, Burks AW, et al. . X-Linked Agammaglobulinemia: Report on a United States Registry of 201 Patients. Medicine (2006) 85(4):193–202. doi: 10.1097/01.md.0000229482.27398.ad - DOI - PubMed

Publication types

MeSH terms