. 2021 Sep 30:12:724855.
doi: 10.3389/fimmu.2021.724855. eCollection 2021.

Enhanced Susceptibility of ADAP-Deficient Mice to Listeria monocytogenes Infection Is Associated With an Altered Phagocyte Phenotype and Function

Affiliations

Enhanced Susceptibility of ADAP-Deficient Mice to Listeria monocytogenes Infection Is Associated With an Altered Phagocyte Phenotype and Function

Martha A L Böning et al. Front Immunol. .

Abstract

The adhesion and degranulation-promoting adaptor protein (ADAP) serves as a multifunctional scaffold and is involved in the formation of immune signaling complexes. To date, only limited data exist regarding the role of ADAP in pathogen-specific immunity during in vivo infection, and its contribution in phagocyte-mediated antibacterial immunity remains elusive. Here, we show that mice lacking ADAP (ADAPko) are highly susceptible to the infection with the intracellular pathogen Listeria monocytogenes (Lm) by showing enhanced immunopathology in infected tissues together with increased morbidity, mortality, and excessive infiltration of neutrophils and monocytes. Despite high phagocyte numbers in the spleen and liver, ADAPko mice only inefficiently controlled pathogen growth, hinting at a functional impairment of infection-primed phagocytes in the ADAP-deficient host. Flow cytometric analysis of hallmark pro-inflammatory mediators and unbiased whole genome transcriptional profiling of neutrophils and inflammatory monocytes uncovered broad molecular alterations in the inflammatory program in both phagocyte subsets following their activation in the ADAP-deficient host. Strikingly, ex vivo phagocytosis assay revealed impaired phagocytic capacity of neutrophils derived from Lm-infected ADAPko mice. Together, our data suggest that an alternative priming of phagocytes in ADAP-deficient mice during Lm infection induces marked alterations in the inflammatory profile of neutrophils and inflammatory monocytes that contribute to enhanced immunopathology while limiting their capacity to eliminate the pathogen and to prevent the fatal outcome of the infection.

Keywords: ADAP; Listeria monocytogenes; adaptor protein; inflammatory monocytes; neutrophil extracellular traps; neutrophils; phagocytosis.


Conflict of interest statement

The authors declare that the research was conducted in the absence of any commercial or financial relationships that could be construed as a potential conflict of interest.

Figures
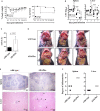
Figure 1
Figure 1
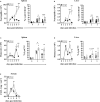
ADAP-deficiency renders mice highly susceptible to infection with the intracellular pathogen Listeria monocytogenes (Lm). Wild type (▪) and ADAPko (▫) mice were either infected i.v. with (A) 5 × 10⁴ CFU, (B, C, E, F) 2.5 × 10⁴ CFU, and (D) 1 × 10⁴ CFU Lm (strain 10403S) or were left untreated (uninfected control mice, day 0) and were sacrificed at the indicated times post infection. (A) Infected mice were weighed and monitored daily, and the survival was reported. Data are depicted as mean ± SEM for n = 8–14 individually analyzed mice. Statistical analyses were performed using two-way ANOVA with Bonferroni’s post-hoc test for the weight data and Mantel–Cox log-rank test for the survival data. (B) Bacterial loads in the spleen and liver after Lm infection. The dashed line represents the limit of detection. Data are depicted as medians for n = 8–10 individually analyzed mice. Statistical analyses were performed after log10-transformation using two-way ANOVA with Bonferroni’s post-hoc test. (C) Serum ALT levels 3 days post infection were determined. Levels higher than the dashed line are considered elevated and indicative of liver damage. Data are depicted as mean ± SEM for n = 5 individually analyzed mice. Statistical analyses were performed using two-tailed unpaired t-test with Welch’s correction (*p < 0.05, ***p < 0.001). (D) Female wild type and ADAPko mice were sacrificed 3 days post Lm infection. Pictures of the internal organs were taken to document the liver (▴) and spleen (▵) pathology. Three individual mice are shown for each genotype. (E) H&E staining of the spleens and livers 3 days post Lm infection. Organs were stored in 4% paraformaldehyde and later sectioned for histology and analyzed following H&E staining. Scale bars at the bottom right corner of each panel represent a distance of 200 µm for the spleen sections and 100 µm for the liver sections. (F) Scoring of degree of inflammation in the spleens and livers. Modified figure from (44). ADAP, adhesion and degranulation-promoting adaptor protein; ADAPko, ADAP knockout; CFU, colony-forming units; ALT, alanine aminotransferase.
Figure 2
Figure 2
Excessive infiltration of neutrophils and monocytes into the spleen and liver of Listeria monocytogenes (Lm)-infected ADAPko mice. Wild type (▪) and ADAPko (▫) mice (age: 10–17 weeks) were either infected i.v. with 2.5 × 10⁴ CFU Lm (strain 10403S) or left untreated (uninfected control mice, day 0) and were sacrificed at the indicated times post infection. Leukocytes, gated as alive singlets and stained for CD45+Lin, were isolated from the spleen and liver and subsequently (A, B, left panel) neutrophil (CD11b+Gr-1+Ly6G+ cells) and (C, D, left panel) monocyte (CD11b+Gr-1+Ly6G cells) absolute numbers as well as the frequencies of (A, B, right panel) neutrophils (CD11b+Ly6G+ cells) and (C, D, right panel) monocytes (CD11b+Ly6GCX3CR1lowLy6Chigh cells) were determined by flow cytometry. For all left panels, data are depicted as mean ± SEM for n = 4–5 individually analyzed mice, and statistical analyses were performed using two-way ANOVA with Bonferroni’s post-hoc test. Modified figure from (44). For all right panels, data shown are representative of three individual experiments (A, B) with n = 4–6 individually analyzed mice per group and one experiment (C, D) with n = 4–6 individually analyzed mice per group. (E) The concentrations of the neutrophil attracting chemokine CXCL1 was determined by cytometric bead array with n = 4 (uninfected control mice, day 0) and n = 8–9 (on the indicated times post infection) individually analyzed mice per group. Modified figure from (44). Data are depicted as mean ± SEM, and statistical analyses were performed using (A–D) unpaired, non-parametric Mann–Whitney test, and (E) analyses were performed using two-way ANOVA with Bonferroni’s post-hoc test (*p < 0.05, **p < 0.01, ***p < 0.001). ADAPko, adhesion and degranulation-promoting adaptor protein knockout; CFU, colony-forming units.
Figure 3
Figure 3
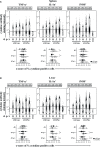
Neutrophils from ADAP-deficient mice show an altered inflammatory profile during in vivo Listeria monocytogenes (Lm) infection. Wild type (▪) and ADAPko (▫) mice (age: 10–17 weeks) were infected i.v. with 2.5 × 10⁴ CFU Lm (strain 10403S) or left untreated (uninfected control mice, day 0) and were sacrificed at the indicated times post infection. Leukocytes were isolated from (A) the spleen and (B) liver and were stimulated in vitro with PMA/ionomycin for 4 h After 1 h, Brefeldin A and Monensin were added. Cells were stained for Ly6G+CD11b+ cells in reference to CD45+Lin leukocytes. (A, B) Representative data (top panels) from one experiment with n = 4–6 individually analyzed mice per group were constrained to alive singlet Ly6G+CD11b+ neutrophils and are shown in columns side by side in a concatenated qualitative density plot (with outliers) in which each column represents data of all pooled mice from one genotype at a given time. Shown is the mean of cytokine positive neutrophils (in %) and the MFI (geometric mean) of all pooled mice per genotype in the top of the concatenated qualitative density plot. Summary plots (bottom panels) present the percentage of cytokine (TNF-α, IL-1α, and iNOS)-positive neutrophils, determined in reference to the corresponding FMO controls in a violin plot with all data points. Results from each independent experiment with n = 8–14 individually analyzed mice per group were normalized over all mice on a given day by z-score calculation. Resulting z-scores from two to three independent experiments are shown. Statistical analyses were performed using unpaired, non-parametric Mann–Whitney test (*p < 0.05, **p < 0.01, ***p < 0.001). ADAP, adhesion and degranulation-promoting adaptor protein; ADAPko, ADAP knockout; PMA, phorbol myristate acetate; MFI, mean fluorescence intensity; TNF, tumor necrosis factor; IL, interleukin; iNOS, inducible nitric oxide synthase; FMO, Fluorescence Minus One.
Figure 4
Figure 4
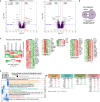
ǀ Microarray analysis of neutrophils from the spleen and liver of wild type and ADAPko mice 3 days post in vivo Listeria monocytogenes (Lm) infection. Wild type and ADAPko mice (age: 9–15 weeks) were infected i.v. with 2.5 × 10⁴ CFU Lm (strain 10403S) and sacrificed on day 3 post infection. Neutrophils (Ly6G+CD11b+ cells) were FACS-sorted from the spleen and liver. Per genotype and organ, neutrophils from six mice were isolated, and cells from two mice each were pooled, resulting in n = 2–3 independent replicate sample pools per organ and genotype. Total RNA was isolated and analyzed by Clariom S microarray (23 samples in total). Differentially expressed transcripts in spleen-/liver-derived neutrophils were determined comparing ADAPko versus wild type condition (fold change > ± 3-fold, FDR < 0.05). (A) Volcano plots of validly detected transcripts from indicated microarray comparisons, plotting −log10 FDR versus log2 fold change. Point sizes refer to mean log2 signal intensities (SIs) of transcripts calculated across all microarrays. Point color code reflects point density. FC (red/green vertical lines) and FDR (blue horizontal lines) criteria for differential gene expression are indicated. Gray boxes show numbers of significantly upregulated (red) and downregulated (green) transcripts. Gene symbols of selected transcripts are stated. (B) Venn diagram of 604 transcripts, differentially regulated in neutrophils isolated from the spleen or liver comparing ADAPko versus wild type condition, respectively. (C) Log2 SI data of the 604 transcripts were z-score transformed and k-means clustered (k = 5), and transcripts in resulting clusters were descendingly sorted by maximal absolute z-score (marked by black point indicators). Data represent color-coded z-scores. Stated gene symbols in each cluster are descendingly ranked by average absolute FC, showing the top n symbols. Top left subfigure: averaged representation of k-means clusters. Sample type, cluster ID, and numbers of genes per cluster are indicated. (D) Gene Ontology (GO) enrichment analysis for GO category “Biological Process” (FDR < 0.05, GO level ≥ 8). GO term groups with the highest significance and numbers of overrepresented genes for ADAPko versus wild type are shown. Data represent hierarchically clustered percentages of enriched genes (color code) that fall into indicated k-means clusters. Numbers in brackets represent number of enriched genes per GO term. ADAPko, adhesion and degranulation-promoting adaptor protein knockout; CFU, colony-forming units; FACS, fluorescence-activated cell sorting; FDR, false discovery rate; FC, fold change.
Figure 5
Figure 5
Microarray analysis of inflammatory monocytes from the spleen and liver of wild type and ADAPko mice 3 days post in vivo Listeria monocytogenes (Lm) infection. Wild type and ADAPko mice (age: 9–15 weeks) were infected i.v. with 2.5 × 10⁴ CFU Lm (strain 10403S) and sacrificed on day 3 post infection. Inflammatory monocytes (Ly6GCD11b+ CX3CR1lowLy6Chigh cells) were FACS-sorted from the spleen and liver. Per genotype and organ, inflammatory monocytes from six mice were isolated; and cells from two mice were pooled, resulting in n = 3 independent replicate sample pools per organ and genotype. Total RNA was isolated and analyzed by Clariom S microarray (23 samples in total). Differentially expressed transcripts in spleen-/liver-derived inflammatory monocytes were determined comparing ADAPko versus wild type condition (fold change > ± 3-fold, FDR < 0.05). (A) Volcano plots of validly detected transcripts from indicated microarray comparisons, plotting −log10 FDR versus log2 fold change. Point sizes refer to mean log2 signal intensities (SIs) of transcripts calculated across all microarrays. Point color code reflects point density. FC (red/green vertical lines) and FDR (blue horizontal lines) criteria for differential gene expression are indicated. Gray boxes show numbers of significantly upregulated (red) and downregulated (green) transcripts. Gene symbols of selected transcripts are stated. (B) Venn diagram of 604 transcripts, differentially regulated in inflammatory monocytes isolated from the spleen or liver comparing ADAPko versus wild type condition, respectively. (C) Log2 SI data of the 604 transcripts were z-score transformed and k-means clustered (k = 5), and transcripts in resulting clusters were descendingly sorted by maximal absolute z-score (marked by black point indicators). Data represent color-coded z-scores. Stated gene symbols in each cluster are descendingly ranked by average absolute FC, showing the top n symbols. Top left subfigure: averaged representation of k-means clusters. Sample type, cluster ID, and numbers of genes per cluster are indicated. (D) Gene Ontology (GO) enrichment analysis for GO category “Biological Process” (FDR < 0.05, GO level ≥ 8). GO term groups with the highest significance and numbers of overrepresented genes for ADAPko versus wild type are shown. Data represent hierarchically clustered percentages of enriched genes (color code) that fall into indicated k-means clusters. Numbers in brackets represent number of enriched genes per GO term. ADAPko, adhesion and degranulation-promoting adaptor protein knockout; CFU, colony-forming units; FACS, fluorescence-activated cell sorting; FDR, false discovery rate; FC, fold change.
Figure 6
Figure 6
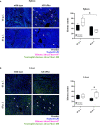
Distinct changes in NET formation by neutrophils from ADAP-deficient mice in response to in vivo Listeria monocytogenes (Lm) infection. Wild type (▪) and ADAPko (▫) mice (age: 10–14 weeks) were infected i.v. with 2.5 × 10⁴ CFU Lm (strain 10403S) and sacrificed at the indicated times post infection. Formalin-fixed tissue slices were stained with primary antibody (neutrophil elastase (NE) and histone H3) and subsequently with the secondary antibody (Alexa Fluor 488 donkey anti-rabbit IgG and goat anti-rat IgG Alexa Fluor 647) as well as DAPI for nuclei staining. Four pictures per slide (three different layers) at a magnification of ×200 were taken, and histones were counted using Image-Pro Plus 6 (double-blinded). Representative pictures show the overlay of the nuclei (colored in blue), histones (colored in red), and neutrophil elastase (colored in green) in (A) spleen and (B) liver tissues, whereas white arrows highlight the histones. Summary plots show the means of counted histones. Data are depicted as box and whiskers ± min to max for n = 4 individually analyzed mice per genotype out of one experiment. Statistical analyses were performed using two-way ANOVA with Bonferroni’s post-hoc test (*p < 0.05). NET, neutrophil extracellular trap; ADAP, adhesion and degranulation-promoting adaptor protein; ADAPko, adhesion and degranulation-promoting adaptor protein knockout.
Figure 7
Figure 7
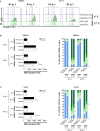
In vivo Listeria monocytogenes-primed neutrophils from ADAPko mice are functionally impaired in their phagocytic capacity. Wild type (▪) and ADAPko (▫) mice (age: 10–17 weeks) were infected i.v. with 2.5 × 10⁴ CFU Lm (strain 10403S) and sacrificed at the indicated times post infection. Leukocytes were isolated from the spleen and liver and stained for Ly6G+CD11b+ neutrophils in reference to CD45+Lin cells; and phagocytosis of Ly6G+CD11b+ cells was assessed by a 2 h incubation of the cells with carboxylate-modified FITC-fluorescent latex microspheres at 37°C or 4°C serving as negative controls (ctr.) with a cell to bead ratio of 1:5. (A) Representative histograms for the spleen (left histograms) and liver (right histograms) for Ly6G+CD11b+ neutrophils in wild type and ADAPko mice in addition to the related negative control 1 and 3 days post Lm infection. Numbers and dotted lines of the (A) histograms and the (B, C, right panels) bar charts (formula image > 3 beads, formula image 3 beads, formula image 2 beads, formula image 1 bead, and formula image 0 beads) show the fractioned cells according to the amount of incorporated beads. Phagocytic capability of (B, left panel) spleen and (C, left panel) liver neutrophils was considered by the MFI of bead-positive populations. Data are depicted as mean ± SEM for n = 6–8 individually analyzed mice per group out of two independent experiments. (B, C, left panels) Statistical analyses were performed using two-way ANOVA with Bonferroni’s post-hoc test and (B, C, right panels) two-tailed unpaired t-test with Welch’s correction (**p < 0.01, ****p < 0.0001). ADAPko, adhesion and degranulation-promoting adaptor protein knockout; CFU, colony-forming units; FITC, fluorescein isothiocyanate; MFI, mean fluorescence intensity. *p < 0.05, ***p < 0.001.

Similar articles

Cited by

  • FYB1-targeted modulation of CAPG promotes AML progression.
    Liu W, Yin H, Xie Z, Fang F, Chu J, Yang L, Huang L, Tu S, Cai H, Wu Z, Wei A, Liu C, Hong Y, Tian X, Cheng Y, Pan J, Wang N, Zhang K. Liu W, et al. Mol Cell Biochem. 2025 Feb;480(2):985-999. doi: 10.1007/s11010-024-04992-4. Epub 2024 May 3. Mol Cell Biochem. 2025. PMID: 38700746 Free PMC article.

References

    1. Togni M. The Role of Adaptor Proteins in Lymphocyte Activation. Mol Immunol (2004) 41(6–7):615–30. doi: 10.1016/j.molimm.2004.04.009 - DOI - PubMed
    1. Hořejší V, Zhang W, Schraven B. Transmembrane Adaptor Proteins: Organizers of Immunoreceptor Signalling. Nat Rev Immunol (2004) 4(8):603–16. doi: 10.1038/nri1414 - DOI - PubMed
    1. Jordan MS, Singer AL, Koretzky GA. Adaptors as Central Mediators of Signal Transduction in Immune Cells. Nat Immunol (2003) 4(2):110–6. doi: 10.1038/ni0203-110 - DOI - PubMed
    1. Veale M, Raab M, Li Z, da Silva AJ, Kraeft S-K, Weremowicz S, et al. . Novel Isoform of Lymphoid Adaptor FYN-T-Binding Protein (FYB-130) Interacts With SLP-76 and Up-Regulates Interleukin 2 Production. J Biol Chem (1999) 274(40):28427–35. doi: 10.1074/jbc.274.40.28427 - DOI - PubMed
    1. Musci MA, Hendricks-Taylor LR, Motto DG, Paskind M, Kamens J, Turck CW, et al. . Molecular Cloning of SLAP-130, an SLP-76-Associated Substrate of the T Cell Antigen Receptor-Stimulated Protein Tyrosine Kinases. J Biol Chem (1997) 272(18):11674–7. doi: 10.1074/jbc.272.18.11674 - DOI - PubMed

Publication types

Substances