. 2021 Oct 6:2021:5170496.
doi: 10.1155/2021/5170496. eCollection 2021.

The Effect of miR-520b on Macrophage Polarization and T Cell Immunity by Targeting PTEN in Breast Cancer

Affiliations

The Effect of miR-520b on Macrophage Polarization and T Cell Immunity by Targeting PTEN in Breast Cancer

Qin Zhu et al. J Oncol. .

Abstract

Background: Breast cancer is the most common cancer in women. miR-520b had binding sites with PTEN through the bioinformatics prediction. But few studies have been conducted on miR-520b and PTEN in breast cancer. We aimed to explore the effect of miR-520b and PTEN on breast cancer and the mechanisms involved.

Methods: Clinical samples of breast cancer were collected. Bioinformatics analysis was performed to screen the differentially expressed miRNAs. CD4 T cells and CD8 T cells were cocultured with MCF-7 cells in the Transwell system. Moreover, MCF-7 cells and M0 macrophage cocultured cell lines were constructed. qRT-PCR, IF, western blot, flow cytometry, and ELISA were performed to detect related factors expression. Starbase and dual-luciferase reporter assay verified the binding of miR-520b to PTEN. The tumor formation model was established to study miR-520b and PTEN effects in vivo.

Results: The differentially expressed miR-520b was screened via miRNAs sequencing and cell verification. miR-520b expression was high, PTEN was low in tumor tissues, T cells and NK cells were inhibited, and macrophages were transformed into M2 type, promoting immune escape. In addition, miR-520b bound to PTEN. Then, splenic CD4 T cells and CD8 T cells were successfully sorted. During CD4 T cell differentiation to Th1 and Treg, Th1 was inhibited, and Treg was activated. We found the polarization of macrophages was related to breast cancer. The proportion of CD206 cells increased and CD68 cells decreased in the miR-520b mimics group compared with the mimic NC group. Compared with the inhibitor NC group, the proportion of CD206 cells decreased, and CD68 cells increased in the miR-520b inhibitor group. In vivo experiments showed that miR-520b inhibitor inhibited tumor growth and promoted PTEN expression. The proportion of CD3, CD4, CD8, NK1.1, CD4+IFNγ, and CD68 cells increased, while FOXP3 and CD206 cells decreased in the miR-520b inhibitor group compared with the inhibitor NC group. However, the proportion of CD3, CD4, CD8, NK1.1, CD4+IFNγ, and CD68 cells decreased, while FOXP3 and CD206 cells increased after the addition of siPTEN.

Conclusions: miR-520b inhibited PTEN and aggravated breast tumors. miR-520b inhibitor enhanced CD4 and CD8 cell populations in the tumor immune microenvironment and inhibited tumor growth.


Conflict of interest statement

The authors declare that there are no conflicts of interest regarding the publication of this paper.

Figures

Figure 1
Figure 1
The screening of miRNA. (a) Volcano map analysis of miRNA differential expression. (b) Differentially expressed miRNA heatmap. (c) hsa-miR-520b expression was high in the breast cancer group compared to the normal group. (d) hsa-miR-520b and PTEN interaction networks. ∗∗∗P < 0.001 vs the normal group.
Figure 2
Figure 2
The expression of miR-520b was high and PTEN was low in tumor tissues, and the immune microenvironment was changed. (a) miR-520b and PTEN expressions in tumor tissues were detected by qRT-PCR. Compared with tumor-adjacent tissues, miR-520b was highly expressed in breast tumor tissues, and PTEN was low expressed in breast tumor tissues. (b) miR-520b and PTEN expressions in breast cancer cells were detected by qRT-PCR. Compared with mammary epithelial cell line MCF-10A, miR-520b was highly expressed in breast cancer cell line MCF-7, and PTEN was low expressed in breast cancer cell line MCF-7. (c) CD45, CD3, CD4, CD8, and NK1.1 expressions in breast tumor tissues were detected by IF. CD45 immune cells were partially positive in breast tumor tissues, naive T cell marker CD3 was inhibited, and CD4, CD8, and NK1.1 were also inhibited. (d) IF detected CD206 and CD68 expression in breast tumor tissues. Compared with adjacent tissue, CD206 was strongly positive and CD68 was suppressed in breast tumor tissues. All experiments were repeated three times; P < 0.05; scale bar = 25 μm; the magnification is 400 times. Differences between the two groups were analyzed using the student's t-test.
Figure 3
Figure 3
miR-520b bound to PTEN, and during CD4 T cell differentiated to Th1 and Treg, Th1 was inhibited, and Treg was activated. (a) The prediction of miR-520b and PTEN binding sites. (b) The binding of miR-520b to PTEN was verified by dual-luciferase reporter assay. P < 0.05 vs the NC group. ns, no significance. (c) Sorting and identification of spleen derived CD4 T cells and CD8 T cells. The positive proportions of CD4 T cells and CD8 T cells were both reached 85.27%. (d) The proportion of CD4+IFNγ cells. (e) The proportion of FOXP3 cells. Compared with the mimic NC group, the proportion of CD4+IFNγ cells decreased and FOXP3 cells increased in miR-520b mimics group, while the proportion of CD4+IFNγ cells increased and FOXP3 cells decreased in miR-520b inhibitor group compared with inhibitor NC group. (f) IFNγ and FOXP3 expressions were verified by WB. Compared with mimic NC group, IFNγ expression was decreased and FOXP3 expression was increased in miR-520b mimics group. Compared with the inhibitor NC group, IFNγ expression was increased and FOXP3 expression was decreased in the miR-520b inhibitor group. (g) The proportion of CD8+IFNγ cells. Compared with mimic NC group, the proportion of CD8+IFNγ cells decreased in miR-520b mimics group. The proportion of CD8+IFNγ cells increased in miR-520b inhibitor group compared with inhibitor NC group. (h) ELISA detected IFNγ levels. IFNγ levels were decreased in miR-520b mimics group compared with mimic NC group. IFNγ levels were increased in the miR-520b inhibitor group compared with the inhibitor NC group. All experiments were repeated three times; P < 0.05 vs the control group, #P < 0.05 vs the mimic NC group, and P < 0.05 vs the inhibitor NC group. Differences between the two groups were analyzed using the student's t-test. One-way analysis of variance (ANOVA) was used for comparison between multiple groups.
Figure 4
Figure 4
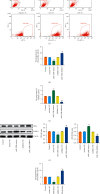
Polarization of macrophage associated with breast cancer. (a) The proportion of CD206 cells. (b) The proportion of CD68 cells. The proportion of CD206 cells increased and CD68 cells decreased in miR-520b mimics group compared with mimic NC group. Compared with inhibitor NC group, the proportion of CD206 cells decreased and CD68 cells increased in miR-520b inhibitor group. (c, d) qRT-PCR and WB measured Arg-1 and TNFα levels, respectively. Compared with mimic NC group, Arg-1 expression in miR-520b mimics group was increased and TNFα was decreased. Compared with inhibitor NC group, miR-520b inhibitor group showed decreased Arg-1 expression and increased TNFα expression. All experiments were repeated three times; P < 0.05 vs the control group, #P < 0.05 vs the mimic NC group, and P < 0.05 vs the inhibitor NC group. Differences between the two groups were analyzed using the student's t-test. One-way analysis of variance (ANOVA) was used for comparison between multiple groups.
Figure 5
Figure 5
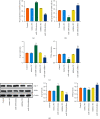
miR-520b inhibitor inhibited tumor growth and promoted PTEN expression. (a) Tumor image of mice. (b) Tumor volume and weight in mice. Compared with the inhibitor NC group, tumor volume and weight were reduced in the miR-520b inhibitor group. The addition of siPTEN was associated with an increase in tumor volume and weight. (c) qRT-PCR was performed to detect miR-520b and PTEN expressions. (d) PTEN and PI3K/Akt pathway-related protein expressions were detected by WB. Compared with the inhibitor NC group, PTEN was increased and miR-520b, p-PI3K, and p-AKT expressions were decreased in miR-520b inhibitor group. After adding siPTEN, PTEN expression decreased, and miR-520b, p-PI3K, and p-AKT expression increased. (e) HE staining measured morphological changes of breast cancer tissues. The inflammatory infiltration of breast cancer tissue was decreased in the miR-520b inhibitor group, while increased after adding siPTEN. The cytoplasm was stained with eosin to different degrees of red or pink, in sharp contrast to the blue nucleus stained with hematoxylin. The red arrows were used to indicate inflammatory cells. All experiments were repeated three times; #P < 0.05 vs the inhibitor NC group, and P < 0.05 vs the miR-520b inhibitor + siNC group. Scale bar = 25 μm, the magnification is 400 times; scale bar = 100 μm, the magnification is 100 times. Differences between the two groups were analyzed using the student's t-test. One-way analysis of variance (ANOVA) was used for comparison between multiple groups.
Figure 6
Figure 6
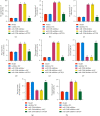
miR-520b inhibitor enhanced T cell activation in the tumor environment and guided the polarization of macrophages to M1, thereby inhibiting tumor growth. (a) The proportion of CD3, CD4, CD8, and NK1.1 cells. (b) The proportion of CD4+IFNγ and FOXP3 cells. (c) The proportion of CD206 and CD68 cells. The proportion of CD3, CD4, CD8, NK1.1, CD4+IFNγ, and CD68 cells increased, while FOXP3 and CD206 cells decreased in miR-520b inhibitor group compared with inhibitor NC group. However, the proportion of CD3, CD4, CD8, NK1.1, CD4+IFNγ, and CD68 cells decreased, while FOXP3 and CD206 cells increased after the addition of siPTEN. All experiments were repeated three times; #P < 0.05 vs the inhibitor NC group, and P < 0.05 vs the miR-520b inhibitor + siNC group. Differences between the two groups were analyzed using the student's t-test. One-way analysis of variance (ANOVA) was used for comparison between multiple groups.

Similar articles

Cited by

References

    1. Fahad Ullah M. Breast cancer: current perspectives on the disease status. Advances in Experimental Medicine & Biology . 2019;1152:51–64. doi: 10.1007/978-3-030-20301-6_4. - DOI - PubMed
    1. Britt K. L., Cuzick J., Phillips K.-A. Key steps for effective breast cancer prevention. Nature Reviews Cancer . 2020;20(8):417–436. doi: 10.1038/s41568-020-0266-x. - DOI - PubMed
    1. Saha T., Makar S., Swetha R., Gutti G., Singh S. K. Estrogen signaling: an emanating therapeutic target for breast cancer treatment. European Journal of Medicinal Chemistry . 2019;177:116–143. doi: 10.1016/j.ejmech.2019.05.023. - DOI - PubMed
    1. Kulkoyluoglu-Cotul E., Arca A., Madak-Erdogan Z. Crosstalk between estrogen signaling and breast cancer metabolism. Trends in Endocrinology and Metabolism . 2019;30(1):25–38. doi: 10.1016/j.tem.2018.10.006. - DOI - PubMed
    1. Yeo S. K., Guan J.-L. Breast cancer: multiple subtypes within a tumor? Trends in Cancer . 2017;3(11):753–760. doi: 10.1016/j.trecan.2017.09.001. - DOI - PMC - PubMed