. 2022;17(4):1459-1472.
doi: 10.1007/s11625-021-01040-8. Epub 2021 Oct 11.

A systems model of SDG target influence on the 2030 Agenda for Sustainable Development

Affiliations

A systems model of SDG target influence on the 2030 Agenda for Sustainable Development

Carl C Anderson et al. Sustain Sci. 2022.

Abstract

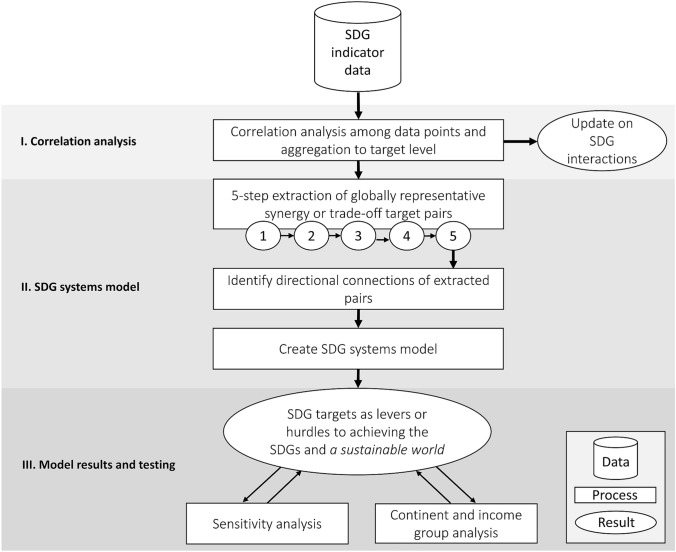
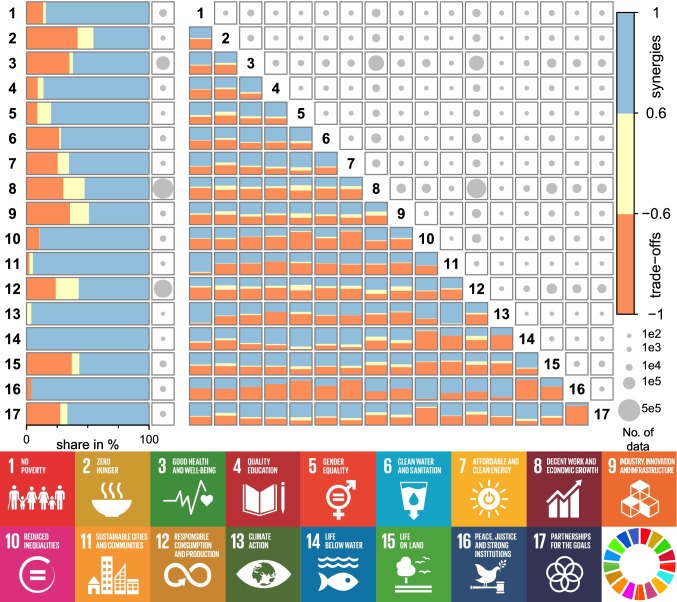
The Sustainable Development Goals (SDGs) were adopted by the United Nations in 2015 as part of the "2030 Agenda for Sustainable Development" and aim to address issues ranging from poverty and economic growth to climate change. Efforts to tackle one issue can support or hinder progress towards others, often with complex systemic interactions. Thus, each of the SDGs and their corresponding targets may contribute as levers or hurdles towards achieving other SDGs and targets. Based on SDG indicator data, we create a systems model considering influence among the SDGs and their targets. Once assessed within a system, we find that more SDGs and their corresponding targets act as levers towards achieving other goals and targets rather than as hurdles. In particular, efforts towards SDGs 5 (Gender Equality) and 17 (Partnerships for the Goals) may accelerate progress, while SDGs 10 (Reduced Inequalities) and 16 (Peace, Justice and Strong Institutions) are shown to create potential hurdles. The model results can be used to help promote supportive interactions and overcome hindering ones in the long term.

Supplementary information: The online version contains supplementary material available at 10.1007/s11625-021-01040-8.

Keywords: Agenda 2030; Sustainable Development Goals; Synergy; Systems model; Trade-off; iMODELER.


Figures

Fig. 1
Fig. 1
Flow diagram of analysis steps starting from Sustainable Development Goal (SDG) indicator data and ending with SDG systems model output (top to bottom). The process, with input SDG indicator data, moves from correlation analysis to SDG systems model creation and finally model testing. The “update on SDG interactions” result replicates work by Pradhan et al. (2017) in which 2016 data were used. Here, we use updated SDG indicator data through 2018
Fig. 2
Fig. 2
Example schematic of the process of building the Sustainable Development Goal (SDG) systems model by adding (in this case positive) ‘explained’ (a) and ‘unexplained’ directional connections (b) in iMODELER. Initial (pre-existing) connections (solid black arrows, from the initial model) link the targets to their respective goals and goals to the final factor of a sustainable world. When a connection is added (solid red arrows), this creates new pathways (dashed red arrows) to the subsequent SDG and a sustainable world. The target from which the added connection originates increases in influence by 25% for ‘explained’ connections (from 25 to 31.25 in absolute influence) (a) on a sustainable world. For new ‘unexplained’ connections (b), a dummy factor is created and the increase in influence for each of the two originating targets is 12.5% (from 25 to 28.125 in absolute influence)
Fig. 3
Fig. 3
Interactions within the 17 Sustainable Development Goals [SDGs] (left) and among 136 SDG pairs (right) based on SDG data from 2018 (United Nations Statistics Division 2019). The shares of synergies (blue), non-classifieds (yellow), and trade-offs (orange) are represented by the color bars. The number of data pairs of SDG indicators is depicted by the areas of the circle in the boxes. Here, 1e2, 1e3, 1e4, 1e5, and 5e5 are 100, 1,000, 10,000, 100,000, and 500,000, respectively. The numbers and icons represent the SDGs
Fig. 4
Fig. 4
Influences of the Sustainable Development Goals (SDGs) and targets in the SDG systems model. All SDG targets that either increased or decreased compared to the initial influence on the final factor of a sustainable world are shown, as well as the net influence at goal level (middle). The percent increase (right) and percent decrease (left) of SDG targets represents their change in influence on the final factor due to the directional connections among targets. The three greatest increases and decreases (only three total) are in bold. SDGs 11 and 12, equally important goals for overall sustainability, had no extracted targets in the SDG systems model because of data availability and the applied exclusionary criteria (“Extracting representative data”)

References

    1. Anderson CC, Denich M, Neumann K, Amankwah K, Tortoe C. Identifying biomass-based value webs for food security in Sub-Saharan Africa: a systems modeling approach. Sustainability. 2019 doi: 10.3390/su11102885. - DOI
    1. Arrow KJ, Dasgupta P, Goulder LH, Mumford KJ, Oleson K. Sustainability and the measurement of wealth. Environ Dev Econ. 2012;17(3):317–353. doi: 10.1017/S1355770X12000137. - DOI
    1. Bennich T, Weitz N, Carlsen H. Deciphering the scientific literature on SDG interactions: a review and reading guide. Sci Total Environ. 2020 doi: 10.1016/j.scitotenv.2020.138405. - DOI - PubMed
    1. Benson E, Best S, del Pozo-Vergnes E, Mohammed B, Essam Yassin Panhuysen S, Piras G, Vorley B, Walnycki A, Wilson E (2014) Informal and Green? The forgotten voice in the transition to a green economy. In: IIED Discussion Paper
    1. Bukachi F, Pakenham-Walsh N. Information technology for health in developing countries. Chest. 2007;132(5):1624–1630. doi: 10.1378/chest.07-1760. - DOI - PubMed

LinkOut - more resources