. 2021 Oct 1:9:689917.
doi: 10.3389/fcell.2021.689917. eCollection 2021.

Novel Corneal Protein Biomarker Candidates Reveal Iron Metabolic Disturbance in High Myopia Eyes

Affiliations

Novel Corneal Protein Biomarker Candidates Reveal Iron Metabolic Disturbance in High Myopia Eyes

Jingyi Chen et al. Front Cell Dev Biol. .

Abstract

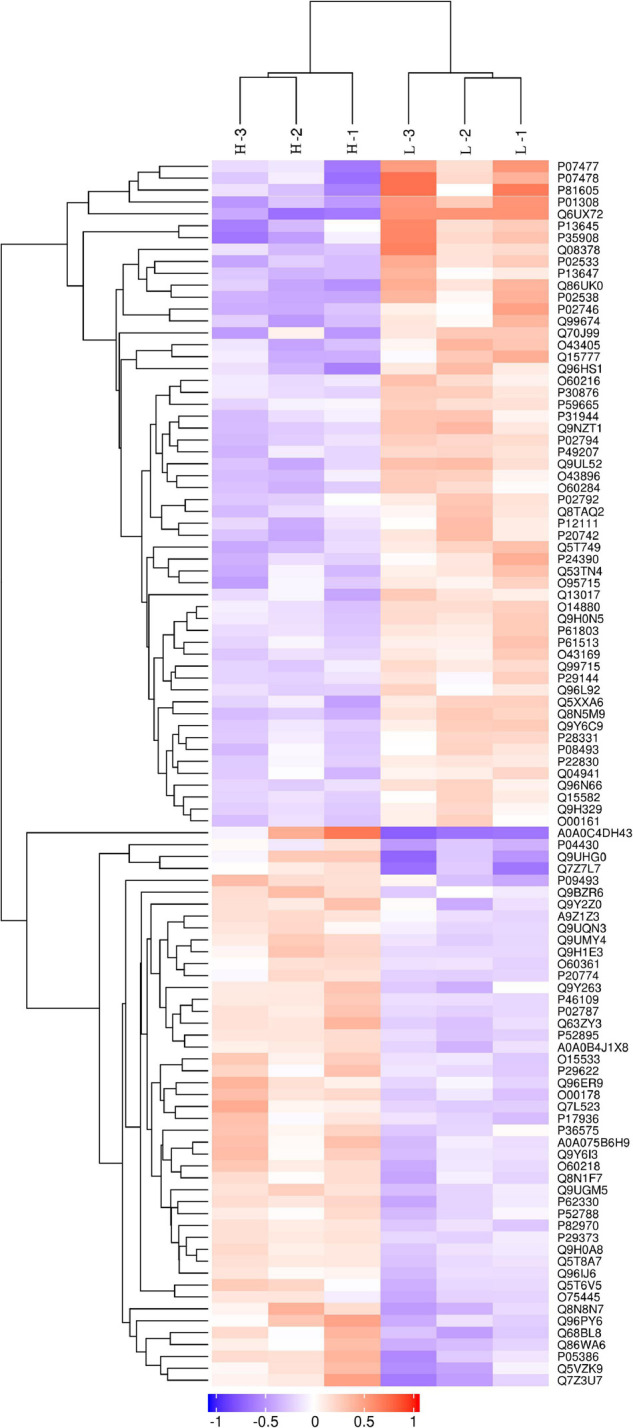
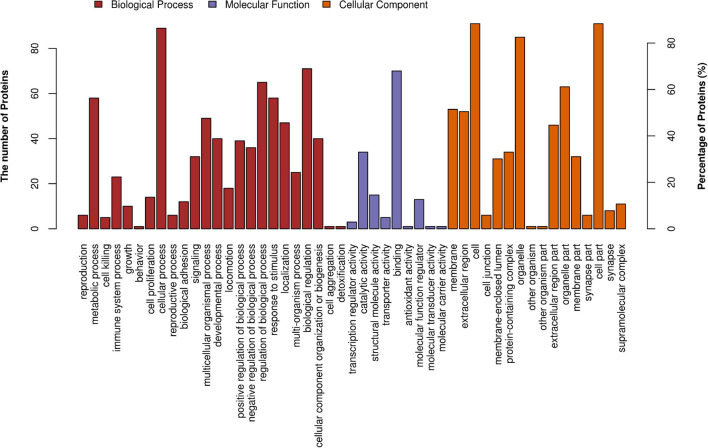
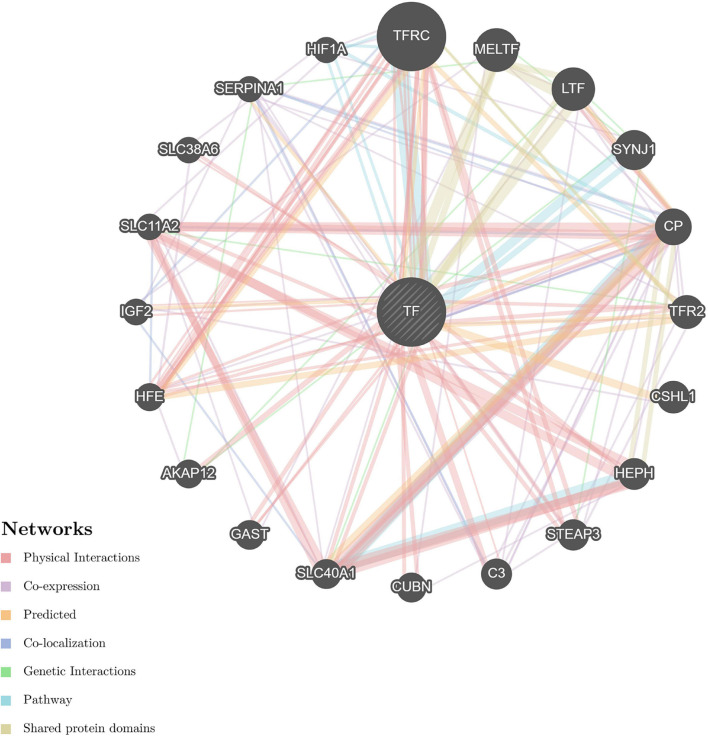
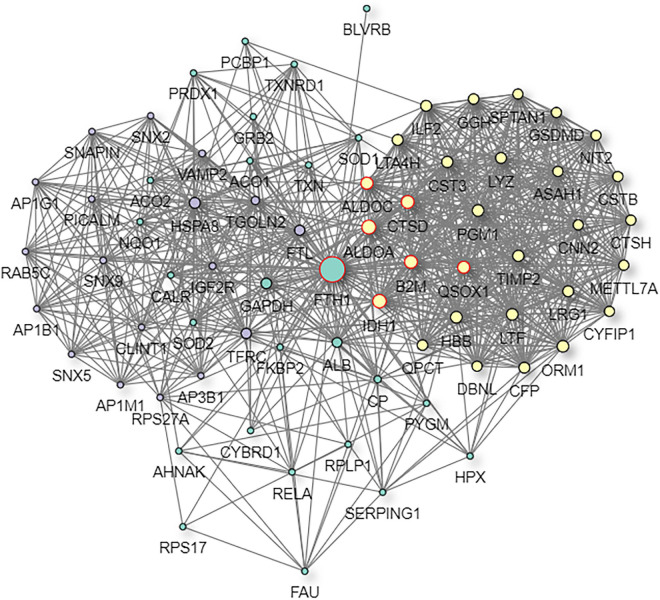
Myopia is a major public health concern with increasing global prevalence and is the leading cause of vision loss and complications. The potential role of the cornea, a substantial component of refractive power and the protective fortress of the eye, has been underestimated in the development of myopia. Our study acquired corneal stroma tissues from myopic patients undergoing femtosecond laser-assisted small incision lenticule extraction (SMILE) surgery and investigated the differential expression of circulating proteins between subjects with low and high myopia by means of high-throughput proteomic approaches-the quantitative tandem mass tag (TMT) labeling method and parallel reaction monitoring (PRM) validation. Across all corneal stroma tissue samples, a total of 2,455 proteins were identified qualitatively and quantitatively, 103 of which were differentially expressed between those with low and high myopia. The differentially abundant proteins (DAPs) between the groups of stroma samples mostly demonstrated catalytic activity and molecular function regulator and transporter activity and participated in metabolic processes, biological regulation, response to stimulus, and so forth. Pathway enrichment showed that mineral absorption, ferroptosis, and HIF-1 signaling pathways were activated in the human myopic cornea. Furthermore, TMT analysis and PRM validation revealed that the expression of ferritin light chain (FTL, P02792) and ferritin heavy chain (FTH1, P02794) was negatively associated with myopia development, while the expression of serotransferrin (TF, P02787) was positively related to myopia status. Overall, our results indicated that subjects with low and high myopia could have different proteomic profiles or signatures in the cornea. These findings revealed disturbances in iron metabolism and corneal oxidative stress in the more myopic eyes. Iron metabolic proteins could serve as an essential modulator in the pathogenesis of myopia.

Keywords: cornea; iron metabolism; myopia; oxidative stress; protein biomarkers; protein–protein interaction; signal.


Conflict of interest statement

The authors declare that the research was conducted in the absence of any commercial or financial relationships that could be construed as a potential conflict of interest.

Figures

FIGURE 1
FIGURE 1
Volcano plot of differentially abundant proteins between the low and high myopia groups. The volcano plot shows a significant difference in differentially abundant proteins (DAPs) between the two groups of samples. The x-axis represents the difference multiple (log2 fold change), and the y-axis represents the p-value of the difference (–log10). The red dots in the figure represent the significant DAPs (multiple changes > 1.2 or < 0.83 and p < 0.05), and the black dots show that there are no differences detected in the proteins between the two groups. H, high myopia group; L, low myopia group.
FIGURE 2
FIGURE 2
Clustering analysis of differentially abundant proteins. Hierarchical clustering analysis was performed using a tree heat map. In the heat map, each row represents a protein [i.e., the ordinate represents the significant differentially abundant proteins (DAPs)], and each column represents a group of samples (the abscissa is the sample information). The logarithm values (log2 expression) of the significant DAPs are displayed in different colors, where red represents significantly upregulated proteins, purple represents significantly downregulated proteins, and gray represents no available protein quantitative information.
FIGURE 3
FIGURE 3
Gene ontology annotation and Kyoto Encyclopedia of Gene and Genomes pathway enrichment analysis between the low and high myopia groups. The ordinate in the figure stands for the enriched gene ontology (GO) functional annotation, which can be divided into (A) BP, (B) MF, and (C) CC or (D) enriched Kyoto Encyclopedia of Genes and Genomes (KEGG) pathways. The abscissa stands for enrichment factors (rich factor ≤ 1). The rich factor represents the proportion of DAPs annotated in a functional ontology to the number of all identified proteins annotated in that functional ontology. The size of the bubbles in the figure indicates the number of differentially expressed proteins in each classified functional ontology. The color of the bubbles indicates the significance of the enriched functional categories. The color gradient displays the p-value, where the closer to red, the smaller the p-value and the higher the significance level of the corresponding ontology.
FIGURE 4
FIGURE 4
GO level 2 functional analysis. The x-axis shows the enriched GO level 2 functional annotation, which was demonstrated as BP (red), MF (purple), and CC (orange). The y-axis shows the number and percentage of proteins detected. BP, biological process; MF, molecular function; CC, cellular component.
FIGURE 5
FIGURE 5
KEGG top 20 pathway enrichment. The x-axis demonstrates the top 20 KEGG enriched pathways. The y-axis demonstrates the number of proteins participating in the enriched pathways.
FIGURE 6
FIGURE 6
The protein–protein interaction network of DAPs. In the protein–protein interaction (PPI) network, the colored nodes stand for differentially altered proteins, and lines are mapped for the interactions between proteins. Larger nodes correspond to a higher degree of protein aggregation in the PPI network.
FIGURE 7
FIGURE 7
Expression patterns of target protein biomarker candidates using tandem mass tag (TMT) analysis and parallel reaction monitoring (PRM) validation with their expression trends compared with SE, (A) TMT expression of serotransferrin (P02787). (B) PRM expression of P02787. (C) TMT expression of ferritin light chain (P02792). (D) PRM expression of P02792. (E) TMT expression of protein ferritin heavy chain (P02794). (F) PRM expression of P02794.
FIGURE 8
FIGURE 8
Predictive PPI network of the validated protein biomarker candidates: TF-FTL-FTH1. In the PPI network prediction, the nodes in the middle with bias represent the validated protein biomarkers, and lines are mapped for the interactions between proteins. Larger nodes correspond to a higher degree of protein aggregation in the PPI network, and different colors correspond to various functional networks.
FIGURE 9
FIGURE 9
Predictive PPI network of the target protein biomarker candidates: TF. In the PPI network prediction, the node in the middle with bias represents the target protein biomarker, and lines are mapped for the interactions between proteins. Larger nodes correspond to a higher degree of protein aggregation in the PPI network, and different colors correspond to various functional networks.
FIGURE 10
FIGURE 10
Predictive PPI network of the target protein biomarker candidate: FTL. In the PPI network prediction, the colored node in the middle represents the target protein biomarker, and lines are mapped for the interactions between proteins. Larger nodes correspond to a higher degree of protein aggregation in the PPI network.
FIGURE 11
FIGURE 11
Predictive PPI network of the target protein biomarker candidate: FTH1. In the PPI network prediction, the colored node in the middle represents the target protein biomarker, and lines are mapped for the interactions between proteins. Larger nodes correspond to a higher degree of protein aggregation in the PPI network.

References

    1. Adhikari S., Nice E. C., Deutsch E. W., Lane L., Omenn G. S., Pennington S. R., et al. (2020). A high-stringency blueprint of the human proteome. Nat. Commun. 11:5301. 10.1038/s41467-020-19045-9 - DOI - PMC - PubMed
    1. Aisen P., Enns C., Wessling-Resnick M. (2001). Chemistry and biology of eukaryotic iron metabolism. Int. J. Biochem. Cell Biol. 33 940–959. 10.1016/s1357-2725(01)00063-2 - DOI - PubMed
    1. Assil K. K., Quantock A. J., Barrett A. M., Schanzlin D. J. (1993). Corneal iron lines associated with the intrastromal corneal ring. Am. J. Ophthalmol. 116 350–356. 10.1016/s0002-9394(14)71353-4 - DOI - PubMed
    1. Bostanci N., Selevsek N., Wolski W., Grossmann J., Bao K., Wahlander A., et al. (2018). Targeted proteomics guided by label-free quantitative proteome analysis in saliva reveal transition signatures from health to periodontal disease. Mol. Cell Proteomics 17 1392–1409. 10.1074/mcp.RA118.000718 - DOI - PMC - PubMed
    1. Cozzi A., Corsi B., Levi S., Santambrogio P., Albertini A., Arosio P. (2000). Overexpression of wild type and mutated human ferritin H-chain in HeLa cells: in vivo role of ferritin ferroxidase activity. J. Biol. Chem. 275 25122–25129. 10.1074/jbc.M003797200 - DOI - PubMed