. 2022 Jan;70(1):173-195.
doi: 10.1002/glia.24101. Epub 2021 Oct 18.

Microglia control glutamatergic synapses in the adult mouse hippocampus

Affiliations

Microglia control glutamatergic synapses in the adult mouse hippocampus

Bernadette Basilico et al. Glia. 2022 Jan.

Abstract

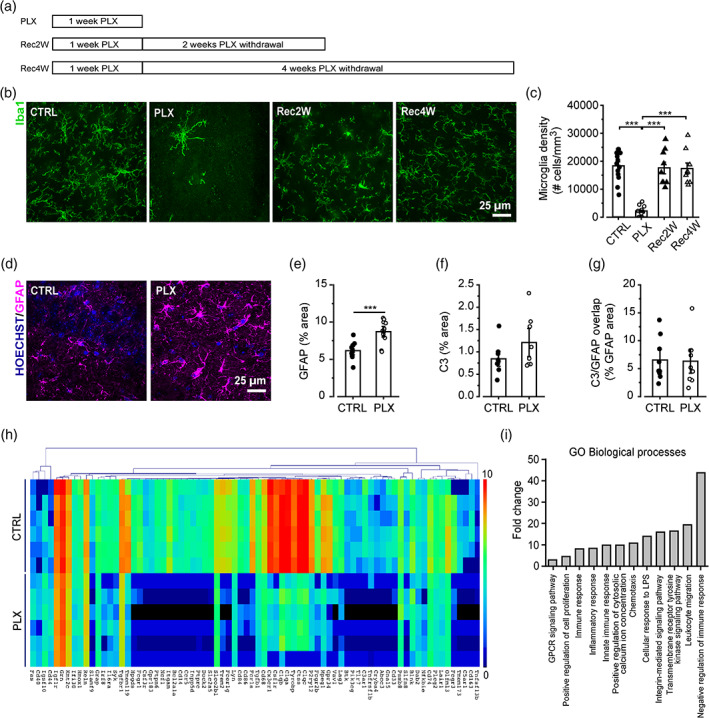
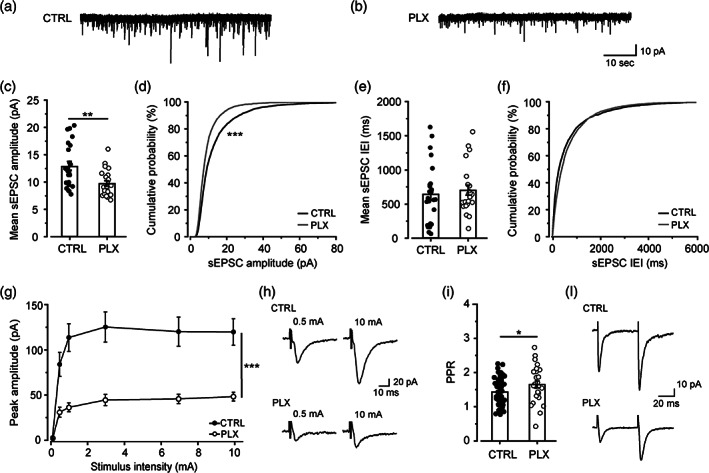
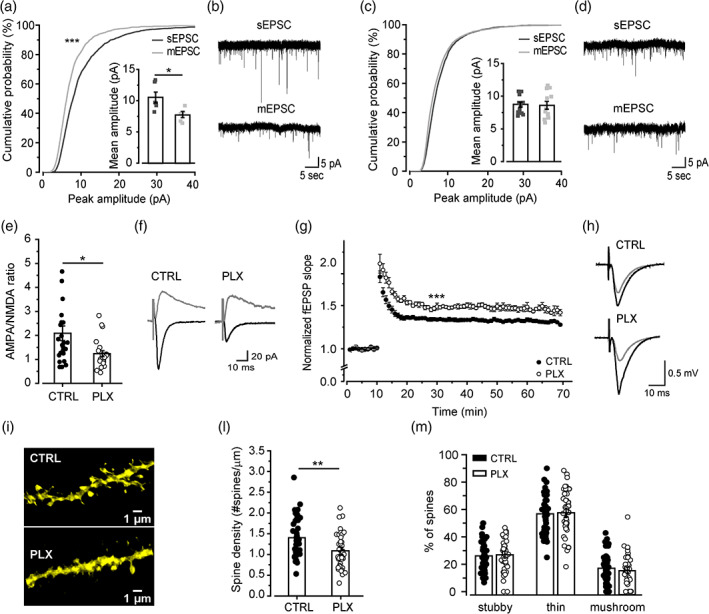
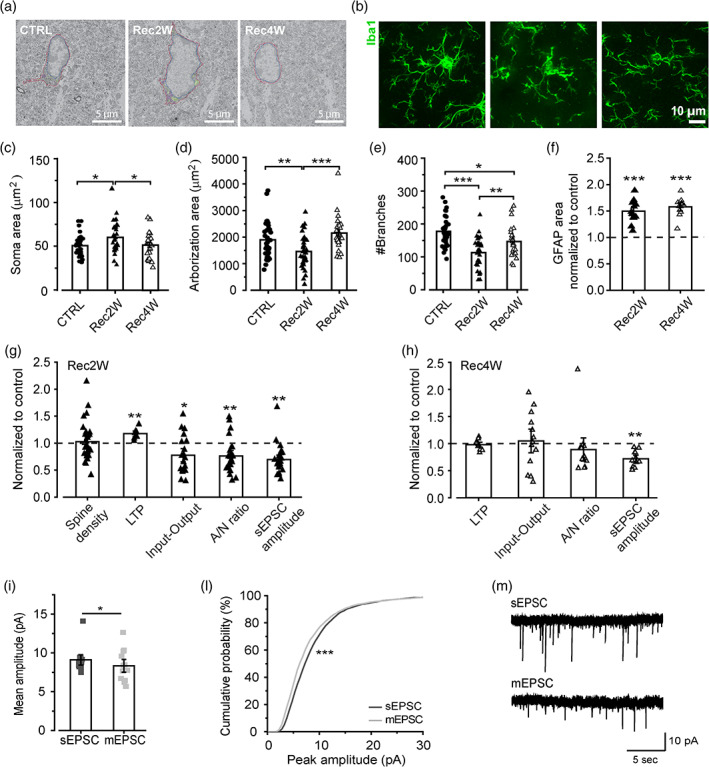
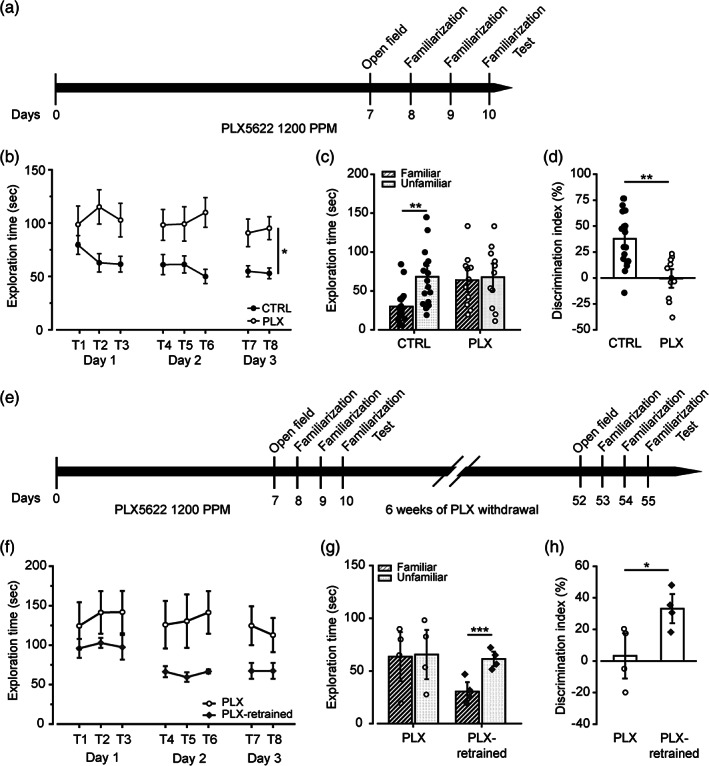
Microglia cells are active players in regulating synaptic development and plasticity in the brain. However, how they influence the normal functioning of synapses is largely unknown. In this study, we characterized the effects of pharmacological microglia depletion, achieved by administration of PLX5622, on hippocampal CA3-CA1 synapses of adult wild type mice. Following microglial depletion, we observed a reduction of spontaneous and evoked glutamatergic activity associated with a decrease of dendritic spine density. We also observed the appearance of immature synaptic features and higher levels of plasticity. Microglia depleted mice showed a deficit in the acquisition of the Novel Object Recognition task. These events were accompanied by hippocampal astrogliosis, although in the absence ofneuroinflammatory condition. PLX-induced synaptic changes were absent in Cx3cr1-/- mice, highlighting the role of CX3CL1/CX3CR1 axis in microglia control of synaptic functioning. Remarkably, microglia repopulation after PLX5622 withdrawal was associated with the recovery of hippocampal synapses and learning functions. Altogether, these data demonstrate that microglia contribute to normal synaptic functioning in the adult brain and that their removal induces reversible changes in organization and activity of glutamatergic synapses.

Keywords: glutamatergic transmission; hippocampus; learning; microglia; neuron-microglia interaction; synapses.


Conflict of interest statement

The authors declare that they have no conflict of interests.

Figures

FIGURE 1
FIGURE 1
CSF1R inhibition leads to microglia depletion without causing neuroinflammation. (a) Experimental design to deplete microglia. C57BL6/J mice are fed for 7 days with 1200 PPM PLX5622. The mice are then returned to standard chow and microglial density is assessed after 2 (Rec2W) and 4 weeks (Rec4W). (b) Representative confocal images of Iba1+ microglial cells in the hippocampal CA1 stratum radiatum. (c) Quantification of microglial density in the hippocampal CA1 stratum radiatum in control condition (n = 13 fields/3 mice), after PLX5622 treatment (n = 14 fields/4 mice), 2 weeks (n = 9 fields/3 mice), and 4 weeks (n = 9 fields/3 mice) after PLX5622 withdrawal. One‐way ANOVA: F(3,44) = 33.96, p < .001; Holm‐Sidak post hoc: ***p < .001. (d) Representative images of astrocytes identified in hippocampal slices from control and PLX‐treated mice immunolabeled with anti‐GFAP antibody (magenta) and Hoechst for nuclei visualization (blue). ×60 objective (scale bar = 25 μm), acquisition from the stratum radiatum. (e) The quantification of GFAP signal, expressed as the percentual area occupied by fluorescent GFAP+ cells versus total field of view, revealed astrogliosis in PLX‐treated mice (n = 34/9/2 fields/slices/mice) versus control (n = 54/14/3). t test: t = −3.08, ***p < .001. (f) Histogram representing the quantification of the area occupied by the C3 signal in control (n = 31/9/4 FOV/slices/mice) and PLX‐treated mice (n = 26/8/4). t test t = 1.59065, p = .13254. (g) Analysis of C3 and GFAP signals overlap expressed as percentage of GFAP signal area occupied by C3 signal in control (n = 31/9/4 FOV/slices/mice) and PLX‐treated mice (n = 26/8/4). t test, t = −0.16827, p = .86862. (h) Heat map of unsupervised hierarchical clustering of the 76 differentially expressed genes in control and PLX hippocampal samples (n = 6) analyzed by Nanostring (72 genes downregulated and 4 upregulated in PLX samples). Colors in the heatmap indicate log2 counts normalized to housekeeping genes. (i) Gene ontology enrichment analysis in “Biological Process” categories for the 72 genes downregulated in PLX samples and identified according to Database for Annotation, Visualization and Integrated Discovery (DAVID) functional annotation. Data presented as Mean ± SEM (c,e) or in Log2 scale (h)
FIGURE 2
FIGURE 2
Microglia depletion impairs glutamatergic transmission in hippocampus. (a, b) Representative traces of sEPSC recorded at −70 mV from CA1 pyramidal neurons in control (CTRL) (a) and PLX‐treated mice (b). (c) Bar graph of mean sEPSC amplitudes in control (n = 25 cells/6 mice) and PLX neurons (n = 23 cells/9 mice). t test: t = 3.22, **p < .01. (d) Cumulative distributions of sEPSC amplitudes as in (c). K‐S test: D = .15, ***p < .001. (e) Bar graph of mean sEPSC interevent interval in control (n = 25 cells/6 mice) and PLX neurons (n = 23 cells/9 mice). (f) Cumulative distributions of sEPSC interevent interval as in (e). (g) Input–output curve of evoked EPSC peak amplitudes recorded at −70 mV from control (n = 24 cells/8 mice) and PLX neurons (n = 24 cells/7 mice). Note that in PLX‐treated mice, neurons show significantly lower peak amplitudes compared to control. Two‐way ANOVA: treatment F(1,275) = 105.06 ***p < .001; stimulation F = (5,275) = 20.46 ***p < .001; interaction F(5,275) = 4.44 p*** < .001. (h) Representative EPSCs were recorded at −70 mV from control and PLX neurons following Schaffer collateral stimulation at 0.5 and 10 mA, respectively. (i) Bar graph showing the PPR, determined by dividing the amplitude of the second EPSC by the first, recorded in control (n = 58 cells/20 mice) and PLX‐treated mice (n = 26 cells/10 mice). t test: t = −2.16, *p < .05. (l) Representative eEPSC induced by paired‐pulse stimulation of Schaffer collateral. Data presented as Mean ± SEM
FIGURE 3
FIGURE 3
Microglia depletion causes the reappearance of immature properties and the reduction of spine density at CA3‐CA1 synapses. (a) Cumulative distribution and scatter plot showing a significant difference between mEPSC and sEPSC amplitudes in control mice (n = 6 cells/3 mice). Paired t test: t = 3.47, *p < .05. K‐S test: D = .22, ***p < .001. (b) Representative sEPSC and mEPSC traces recorded at −70 mV from pyramidal neurons of control mice. (c) In PLX‐treated mice (n = 12 cells/8 mice), the difference observed in control mice for sEPSC and mEPSC amplitudes was lost (cumulative distribution and scatter plot), indicating a defect in synaptic multiplicity. (d) Representative sEPSC and mEPSC traces recorded at −70 mV from pyramidal neurons of PLX‐treated mice. (e) The AMPA/NMDA ratio is significantly lower in PLX (n = 23 cells/10 mice) compared with control neurons (n = 26 cells/10 mice). t test: t = −2.47, *p < .05. (f) Representative traces of AMPA‐mediated currents, elicited at −70 mV, and NMDA‐mediated currents (+40 mV) evoked by Schaffer collateral stimulation. (g) Time course of fEPSP slope responses evoked at 0.05 Hz and normalized. Note that fEPSP amplitudes are higher in PLX‐treated mice after LTP induction (CTRL, n = 14 slices/6 mice; PLX, n = 8 slices/4 mice). t test: t = −6.79, ***p < .001. The absolute amplitude values of baseline fEPSP did not differ in average between control (−0.59 ± 0.04 mV, n = 19) and PLX‐treated mice (−0.55 ± 0.06 mV, n = 14; p = .6). (h) Representative field potential waveforms before (gray) and after (black) 30 min of HFS induction, for each condition as indicated. (i) Representative confocal images of dendritic segments belonging to control and PLX pyramidal neurons from CA1 stratum radiatum. (l) Bar graph showing the reduction of the overall spine density in PLX neurons (n = 46 dendrites/5 mice; control n = 46 dendrites/5 mice). t test: t = 3.28, **p < .01. (m) Quantification of the percentage of stubby, thin, and mushroom spines does not reveal any difference between the two experimental conditions. Data presented as Mean ± SEM
FIGURE 4
FIGURE 4
Effects of microglia repopulation on synaptic functions. (a) Electron micrograph of microglia in control (CTRL), 2 and 4 weeks recovery groups in the stratum radiatum of the hippocampal CA1. Red line = cytoplasm, blue line = nucleus, purple = mitochondria, green = phagocytic elements. Scale bar = 5 μm. (b) Representative confocal images showing morphological features of Iba1+ microglia in control, 2 and 4 weeks recovery groups in the stratum radiatum of the hippocampal CA1. Scale bar = 10 μm. (c–e) Quantitative analysis of microglial soma area (c; One‐way ANOVA: F[2,90] = 4.06, p < .05. Holm‐Sidak post hoc: *p < .05), arborization area (d; One‐way ANOVA: F[2,90] = 8.1, p < .001. Holm‐Sidak post hoc: **p < .01 ***p < .001) and a number of branches (e; One‐way ANOVA: F(2,90) = 16.06, p < .001. Holm‐Sidak post hoc: *p < .05 **p < .01 ***p < .001) in control (n = 34 cells/13 slices/3 mice), 2 weeks recovery (n = 34 cells/7 slices/3 mice) and 4 weeks recovery (n = 27 cells/7 slices/3 mice) groups. (f) Analysis of GFAP signal after 2 weeks (t test Rec2W vs. ctrl: t = −6.61, ***p < .001) and 4 weeks (t test Rec4W vs. ctrl: t = −7.92, ***p < .001) of PLX5622 withdrawal. (g) Analysis of synaptic parameters recovery after 2 weeks of PLX5622 withdrawal: dendritic spine density, LTP (t test Rec2W vs. ctrl: t = −6.19, ***p < .001), input–output (t test Rec2W vs. ctrl: t = −2.74, *p < .05), AMPA/NMDA ratio (t test Rec2W vs. ctrl: t = −3.53, **p < .01) and sEPSC amplitude during microglia repopulation. (h) Analysis of synaptic parameters recovery after 4 weeks of PLX5622 withdrawal: dendritic spine density, LTP, input output, AMPA/NMDA ratio and sEPSC amplitude (t test Rec4W vs. ctrl: t = −7.92, ***p < .001). Data in f–h presented as normalized to control values. Data shown as Mean ± SEM. (i‐l) Histogram and cumulative distribution of EPSCs amplitudes after 4 weeks PLX5622 withdrawal, showing a significant difference between mEPSC and sEPSC amplitudes (n = cells/mice). paired t test: t = 2.183 *p < .05. K‐S test: D = 0.101 ***p < .001. (m) Representative sEPSC and mEPSC traces recorded at −70 mV from pyramidal neurons of Rec4W mice. Data in (f–h) presented as normalized to control values. Data shown as Mean ± SEM
FIGURE 5
FIGURE 5
Microglia‐depleted mice show learning deficits in the NOR task.(a) Experimental design for behavioral analysis in (b–d). Thirty‐five‐days‐old mice (control n = 18, PLX‐treated n = 11) were fed with PLX5622 chow for 10 consecutive days. After 7 days of treatment, mice were placed in the open field arena to evaluate the locomotor activity. From day 8 to 10, mice were allowed to familiarize with two identical objects during repeated training sessions. On day 10, 1 h after the last training session, mice were tested in the NOR task. (b) Exploration time of the two objects across the familiarization sessions. As shown in the graph, PLX‐treated mice show increased exploratory behavior compared with control mice. ANOVA for repeated measures, F(1,182) = 11.652; p = .002; Tukey's test p < .05. (c) Bar graph representing the exploration time for the familiar and unfamiliar object during the acquisition test. (Two‐way ANOVA, objects F(1,46) = 4.031; p = .05; Tukey's test **p < .01. (d) Control mice show a higher discrimination index (D.I.) compared to PLX‐treated mice, demonstrating to distinguish between novel and familiar object. (Unpaired t test, t(27) = 4.107; **p < .01). (e) Experimental design for behavioral analysis in (f–h). (f) Exploration time of the two objects across the familiarization sessions. As shown in the graph, microglia‐repopulated mice recovered the ability to familiarize with objects across the training trials (ANOVA for repeated measures: groups F(1,42) = 3.865; p = .09; object exploration F(7,42) = 3.260; p = .007; Tukey's test p < .05). (g) Bar graph showing the exploration time for the familiar and unfamiliar object during the acquisition test. (Two‐way ANOVA, objects F(1,6) = 16.975; p = .001; Tukey's test ***p < .001). (h) Retrained mice (n = 4) show a higher discrimination index (D.I.) compared with the first training, demonstrating to distinguish between novel and familiar object. Unpaired t test, t(6) = − 2.618; *p < .05. Data presented as Mean ± SEM

References

    1. Akiyoshi, R. , Wake, H. , Kato, D. , Horiuchi, H. , Ono, R. , Ikegami, A. , Haruwaka, K. , Omori, T. , Tachibana, Y. , Moorhouse, A. J. , & Nabekura, J. (2018). Microglia Enhance Synapse Activity to Promote Local Network Synchronization. eNeuro, 5(5), 88–106. 10.1523/ENEURO.0088-18.2018 - DOI - PMC - PubMed
    1. Allen, N. J. , & Barres, B. A. (2005). Signaling between glia and neurons: Focus on synaptic plasticity. Current Opinion in Neurobiology, 15(5), 542–548. 10.1016/j.conb.2005.08.006 - DOI - PubMed
    1. Badimon, A. , Strasburger, H. J. , Ayata, P. , Chen, X. , Nair, A. , Ikegami, A. , Hwang, P. , Chan, A. T. , Graves, S. M. , Uweru, J. O. , Ledderose, C. , Kutlu, M. G. , Wheeler, M. A. , Kahan, A. , Ishikawa, M. , Wang, Y. C. , Loh, Y. H. E. , Jiang, J. X. , Surmeier, D. J. , … Schaefer, A. (2020). Negative feedback control of neuronal activity by microglia. Nature, 10, 1–7. 10.1038/s41586-020-2777-8 - DOI - PMC - PubMed
    1. Barnes, C. A. , Jung, M. W. , McNaughton, B. L. , Korol, D. L. , Andreasson, K. , & Worley, P. F. (1994). LTP saturation and spatial learning disruption: Effects of task variables and saturation levels. Journal of Neuroscience, 14(10), 5793–5806. 10.1523/jneurosci.14-10-05793.1994 - DOI - PMC - PubMed
    1. Basilico, B. , Pagani, F. , Grimaldi, A. , Cortese, B. , di Angelantonio, S. , Weinhard, L. , Gross, C. , Limatola, C. , Maggi, L. , & Ragozzino, D. (2019). Microglia shape presynaptic properties at developing glutamatergic synapses. Glia, 67(1), 53–67. 10.1002/glia.23508 - DOI - PubMed

Publication types