Observational Study
. 2021 Dec 1;78(12):1471-1483.
doi: 10.1001/jamaneurol.2021.3671.

Differences Between Plasma and Cerebrospinal Fluid Glial Fibrillary Acidic Protein Levels Across the Alzheimer Disease Continuum

Collaborators, Affiliations
Observational Study

Differences Between Plasma and Cerebrospinal Fluid Glial Fibrillary Acidic Protein Levels Across the Alzheimer Disease Continuum

Andréa L Benedet et al. JAMA Neurol. .

Abstract

Importance: Glial fibrillary acidic protein (GFAP) is a marker of reactive astrogliosis that increases in the cerebrospinal fluid (CSF) and blood of individuals with Alzheimer disease (AD). However, it is not known whether there are differences in blood GFAP levels across the entire AD continuum and whether its performance is similar to that of CSF GFAP.

Objective: To evaluate plasma GFAP levels throughout the entire AD continuum, from preclinical AD to AD dementia, compared with CSF GFAP.

Design, setting, and participants: This observational, cross-sectional study collected data from July 29, 2014, to January 31, 2020, from 3 centers. The Translational Biomarkers in Aging and Dementia (TRIAD) cohort (Montreal, Canada) included individuals in the entire AD continuum. Results were confirmed in the Alzheimer's and Families (ALFA+) study (Barcelona, Spain), which included individuals with preclinical AD, and the BioCogBank Paris Lariboisière cohort (Paris, France), which included individuals with symptomatic AD.

Main outcomes and measures: Plasma and CSF GFAP levels measured with a Simoa assay were the main outcome. Other measurements included levels of CSF amyloid-β 42/40 (Aβ42/40), phosphorylated tau181 (p-tau181), neurofilament light (NfL), Chitinase-3-like protein 1 (YKL40), and soluble triggering receptor expressed on myeloid cells 2 (sTREM2) and levels of plasma p-tau181 and NfL. Results of amyloid positron emission tomography (PET) were available in TRIAD and ALFA+, and results of tau PET were available in TRIAD.

Results: A total of 300 TRIAD participants (177 women [59.0%]; mean [SD] age, 64.6 [17.6] years), 384 ALFA+ participants (234 women [60.9%]; mean [SD] age, 61.1 [4.7] years), and 187 BioCogBank Paris Lariboisière participants (116 women [62.0%]; mean [SD] age, 69.9 [9.2] years) were included. Plasma GFAP levels were significantly higher in individuals with preclinical AD in comparison with cognitively unimpaired (CU) Aβ-negative individuals (TRIAD: Aβ-negative mean [SD], 185.1 [93.5] pg/mL, Aβ-positive mean [SD], 285.0 [142.6] pg/mL; ALFA+: Aβ-negative mean [SD], 121.9 [42.4] pg/mL, Aβ-positive mean [SD], 169.9 [78.5] pg/mL). Plasma GFAP levels were also higher among individuals in symptomatic stages of the AD continuum (TRIAD: CU Aβ-positive mean [SD], 285.0 [142.6] pg/mL, mild cognitive impairment [MCI] Aβ-positive mean [SD], 332.5 [153.6] pg/mL; AD mean [SD], 388.1 [152.8] pg/mL vs CU Aβ-negative mean [SD], 185.1 [93.5] pg/mL; Paris: MCI Aβ-positive, mean [SD], 368.6 [158.5] pg/mL; AD dementia, mean [SD], 376.4 [179.6] pg/mL vs CU Aβ-negative mean [SD], 161.2 [67.1] pg/mL). Plasma GFAP magnitude changes were consistently higher than those of CSF GFAP. Plasma GFAP more accurately discriminated Aβ-positive from Aβ-negative individuals than CSF GFAP (area under the curve for plasma GFAP, 0.69-0.86; area under the curve for CSF GFAP, 0.59-0.76). Moreover, plasma GFAP levels were positively associated with tau pathology only among individuals with concomitant Aβ pathology.

Conclusions and relevance: This study suggests that plasma GFAP is a sensitive biomarker for detecting and tracking reactive astrogliosis and Aβ pathology even among individuals in the early stages of AD.


Conflict of interest statement

Conflict of Interest Disclosures: Dr Vrillon reported receiving grants from Fondation Ophtalmologique Adolphe de Rothschild, Fondation Philipe Chatrier, Amicale des Anciens Internes des Hôpitaux de Paris, and Fondation Vaincre Alzheimer during the conduct of the study. Dr Gispert reported receiving grants from GE Healthcare, Roche Diagnostics, and F. Hoffman-La Roche; and speaker’s fees from Philips and Biogen during the conduct of the study. Dr Suridjan reported being an employee of and owning stocks in Roche Diagnostics. Dr Zetterberg reported receiving personal fees from Alector, Eisai, Denali, Roche Diagnostics, Wave, Samumed, Siemens Healthineers, Pinteon Therapeutics, Nervgen, AZTherapies, CogRx, Red Abbey Labs, Cellectricon, Alzecure, Fujirebio, and Biogen and also reported being cofounder of and holding stock in Brain Biomarker Solutions in Gothenburg AB outside the submitted work. Dr Molinuevo reported receiving in-kind reagents from Roche Diagnostics and GE Healthcare and grants from “La Caixa” Foundation NA and Alzheimer’s Association NA during the conduct of the study as well as being an employee of Lundbeck A/S and serving on the advisory board for Genentech, Roche Diagnostics, Novartis, Genentech, Oryzon, Biogen, Lilly, Janssen, Green Valley, MSD, Eisai, Alector, BioCross, and ProMis Neurosciences outside the submitted work. Dr Paquet reported receiving personal fees from Roche, Biogen, and Lilly during the conduct of the study. Dr Blennow reported personal fees from Abcam, Axon, Biogen, JOMDD/Shimadzu, Lilly, MagQu, Novartis, Roche Diagnostics, and Siemens outside the submitted work and being cofounder of Brain Biomarker Solutions in Gothenburg AB, which is a part of the GU Ventures Incubator Program. Dr Suárez-Calvet reported receiving personal fees from Roche Diagnostics International and Roche Farma, SA outside the submitted work. No other disclosures were reported.

Figures

Figure 1.
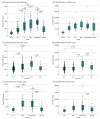
Figure 1.. Plasma and Cerebrospinal Fluid (CSF) Glial Fibrillary Acidic Protein (GFAP) Group Comparisons
Box plots depict median (horizontal bar), IQR (hinges), and 1.5 × IQR (whiskers). Group comparisons were computed with a 1-way analysis of covariance adjusting for age and sex. The Tukey honestly significant difference test was used for post hoc pairwise comparisons in all cohorts. Fold changes are depicted for the Alzheimer disease (AD) continuum groups and were calculated using amyloid-β (Aβ)–negative cognitively unimpaired (CU−) individuals (Translational Biomarkers in Aging and Dementia [TRIAD] and BioCogBank Paris Lariboisière [Paris] cohorts) or Aβ-negative and tau-negative (A–T–) individuals (Alzheimer’s and Families [ALFA+] cohort) as the reference group. Aβ status was defined by Aβ positron emission tomography in the TRIAD cohort and CSF Aβ42/40 ratio in the ALFA+ and Paris cohorts. The non-AD group included 21 individuals with Aβ-negative mild cognitive impairment (MCI), 4 individuals with Aβ-negative AD dementia syndrome in the TRIAD cohort, and 48 individuals with MCI− in the Paris cohort. A+T– indicates Aβ-positive and tau-negative; A+T+, Aβ-positive and tau-positive; A–T+, Aβ-negative and tau-positive; CU+, Aβ-positive cognitively unimpaired; MCI+, Aβ-positive MCI.
Figure 2.
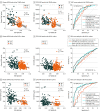
Figure 2.. Associations of Plasma and Cerebrospinal Fluid Glial Fibrillary Acidic Protein Levels With Aβ Pathology and Discriminative Accuracy
Individuals are color coded by amyloid-β (Aβ) status (as defined by Aβ positron emission tomography in the Translational Biomarkers in Aging and Dementia [TRIAD] cohort and cerebrospinal fluid (CSF) Aβ42/40 ratio in the Alzheimer’s and Families [ALFA+] and BioCogBank Paris Lariboisière [Paris] cohorts). Solid lines indicate the regression line and 95% CIs. P values were computed with linear models adjusted by age, sex, and clinical diagnosis (the latter only for the TRIAD and Paris cohorts). Sizes of the associations between variables are shown by the partial η2p2). For comparative purposes, we also included plasma tau phosphorylated at threonine 181 (p-tau181) and plasma neurofilament light chain (NfL) in these analyses. AUC indicates area under the curve; GFAP, glial fibrillary acidic protein; ROC, receiver operating characteristic.
Figure 3.
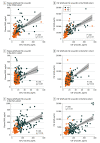
Figure 3.. Association of Plasma and Cerebrospinal Fluid (CSF) Glial Fibrillary Acidic Protein (GFAP) Levels With Tau Phosphorylated at Threonine 181 (p-tau181)
A, Association of plasma GFAP with CSF p-tau181 in the Translational Biomarkers in Aging and Dementia (TRIAD) cohort. B, Association of CSF GFAP with CSF p-tau181 in the TRIAD cohort. C, Association of plasma GFAP with CSF p-tau181 in the Alzheimer’s and Families (ALFA+) cohort. D, Association of CSF GFAP with CSF p-tau181 in the ALFA+ cohort. E, Association of plasma GFAP with CSF p-tau181 in the BioCogBank Paris Lariboisière (Paris) cohort. F, Association of CSF GFAP with CSF p-tau181 in the Paris cohort. Individuals are colored by amyloid-β (Aβ) status (as defined by Aβ positron emission tomography in the TRIAD cohort or CSF Aβ42/40 in the ALFA+ and Paris cohorts). The solid lines indicate the regression line and the 95% CIs. P values were computed with linear models adjusted by age, sex, and clinical diagnosis (the latter only for the TRIAD and Paris cohorts). The sizes of the associations between variables are shown by the partial η2p2).

References

    1. Janelidze S, Mattsson N, Palmqvist S, et al. . Plasma p-tau181 in Alzheimer’s disease: relationship to other biomarkers, differential diagnosis, neuropathology and longitudinal progression to Alzheimer’s dementia. Nat Med. 2020;26(3):379-386. doi:10.1038/s41591-020-0755-1 - DOI - PubMed
    1. Karikari TK, Pascoal TA, Ashton NJ, et al. . Blood phosphorylated tau 181 as a biomarker for Alzheimer’s disease: a diagnostic performance and prediction modelling study using data from four prospective cohorts. Lancet Neurol. 2020;19(5):422-433. doi:10.1016/S1474-4422(20)30071-5 - DOI - PubMed
    1. Thijssen EH, La Joie R, Wolf A, et al. ; Advancing Research and Treatment for Frontotemporal Lobar Degeneration (ARTFL) investigators . Diagnostic value of plasma phosphorylated tau181 in Alzheimer’s disease and frontotemporal lobar degeneration. Nat Med. 2020;26(3):387-397. doi:10.1038/s41591-020-0762-2 - DOI - PMC - PubMed
    1. Lantero Rodriguez J, Karikari TK, Suárez-Calvet M, et al. . Plasma p-tau181 accurately predicts Alzheimer’s disease pathology at least 8 years prior to post-mortem and improves the clinical characterisation of cognitive decline. Acta Neuropathol. 2020;140(3):267-278. doi:10.1007/s00401-020-02195-x - DOI - PMC - PubMed
    1. Ashton NJ, Pascoal TA, Karikari TK, et al. . Plasma p-tau231: a new biomarker for incipient Alzheimer’s disease pathology. Acta Neuropathol. 2021;141(5):709-724. doi:10.1007/s00401-021-02275-6 - DOI - PMC - PubMed

Publication types