. 2022 Jan;48(1):67-77.
doi: 10.1007/s00134-021-06546-4. Epub 2021 Oct 18.

Variation in severity-adjusted resource use and outcome in intensive care units

Affiliations

Variation in severity-adjusted resource use and outcome in intensive care units

Jukka Takala et al. Intensive Care Med. 2022 Jan.

Abstract

Purpose: Intensive care patients have increased risk of death and their care is expensive. We investigated whether risk-adjusted mortality and resources used to achieve survivors change over time and if their variation is associated with variables related to intensive care unit (ICU) organization and structure.

Methods: Data of 207,131 patients treated in 2008-2017 in 21 ICUs in Finland, Estonia and Switzerland were extracted from a benchmarking database. Resource use was measured using ICU length of stay, daily Therapeutic Intervention Scoring System Scores (TISS) and purchasing power parity-adjusted direct costs (2015-2017; 17 ICUs). The ratio of observed to severity-adjusted expected resource use (standardized resource use ratio; SRUR) was calculated. The number of expected survivors and the ratio of observed to expected mortality (standardized mortality ratio; SMR) was based on a mortality prediction model covering 2015-2017. Fourteen a priori variables reflecting structure and organization were used as explanatory variables for SRURs in multivariable models.

Results: SMR decreased over time, whereas SRUR remained unchanged, except for decreased TISS-based SRUR. Direct costs of one ICU day, TISS score and ICU admission varied between ICUs 2.5-5-fold. Differences between individual ICUs in both SRUR and SMR were up to > 3-fold, and their evolution was highly variable, without clear association between SRUR and SMR. High patient turnover was consistently associated with low SRUR but not with SMR.

Conclusion: The wide and independent variation in both SMR and SRUR suggests that they should be used together to compare the performance of different ICUs or an individual ICU over time.

Keywords: Cost control; Health care benchmarking; Health resources; Hospital mortality; Intensive care unit; Resource allocation.


Conflict of interest statement

On behalf of all authors, the corresponding author states that there is no conflict of interest.

Figures

Fig. 1
Fig. 1
Flowchart showing study populations and exclusions
Fig. 2
Fig. 2
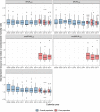
Changes over time in standardised mortality ratio (SMR) and standardised resource use ratios (SRURLOS. SRURTISS, costSRURLOS, costSRURTISS); box plots show the median, the first and third quartiles, and whiskers defined by 1.5 times the interquartile range; two-sided p value testing of no linear time trend: SRURTISS (Overall population) p = 0.02, SMR (Overall population) p < 0.001
Fig. 3
Fig. 3
Standardised resource use ratios (SRURLOS, SRURTISS) in relation to standardised mortality ratio (SMR) from 2008 to 2017. Filled circles: an ICU, circle size is proportional to the number of ICU admissions. Solid lines: Gaussian linear regression lines. Dashed lines: their 95% confidence intervals (slope estimates in eTable 4). Dotted horizontal and vertical lines: SRUR = 1 and SMR = 1
Fig. 4
Fig. 4
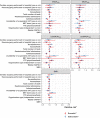
Bivariable and multivariable analyses of variables associated with standardised resource utilization ratios (SRURLOS, SRURTISS, costSRURLOS, costSRURTISS) and standardised mortality ratio (SMR). The main finding was that higher number of admissions/bed was consistently associated with lower SRUR but not with SMR: A one SD increase in admissions/bed was associated with a reduction of SRURLOS by 21.0%, 95% CI (27.1%, 14.4%), SRURTISS by 19.9%, 95% CI (27.4%, 11.6%), costSRURLOS by 22.5%, 95% CI (28.2%, 16.4%), costSRURTISS by 21.9%, 95% CI (27.5%, 15.8%).; admissions/bed was not significantly associated with SMR [effect estimate 2.0%, 95% CI (-8.2%, 5.5%)]. *Relative risk with 95% confidence intervals (values outside x-axis range are capped). Values > 1 indicate higher SRUR or SMR. The relative risk of 1.0 (dotted line) indicates an SRUR or SMR of 1. **reported variables adjusted for calendar year (bivariable), and in addition for all other listed variables (multivariable). Details for all variables in eTable8

References

    1. Halpern NA, Pastores SM. Critical care medicine in the United States 2000–2005: an analysis of bed numbers, occupancy rates, payer mix, and costs. Crit Care Med. 2010;38:65–71. doi: 10.1097/CCM.0b013e3181b090d0. - DOI - PubMed
    1. Knaus WA, Draper EA, Wagner DP, Zimmerman JE. APACHE II: A severity of disease classification system. Crit Care Med. 1985;13:818–829. doi: 10.1097/00003465-198603000-00013. - DOI - PubMed
    1. Knaus WA, Wagner DP, Draper EA, et al. The APACHE III prognostic system. Risk prediction of hospital mortality for critically ill hospitalized adults. Chest. 1991;100:1619–1636. doi: 10.1378/chest.100.6.1619. - DOI - PubMed
    1. Le Gall J-R, Lemeshow S, Saulnier F. Simplified Acute Physiology Score (SAPS II) based on a European / North American multicenter study. JAMA. 1993;270:2957–2963. doi: 10.1001/jama.270.24.2957. - DOI - PubMed
    1. Metnitz PGH, Moreno RP, Almeida E, et al. SAPS 3 from evaluation of the patient to evaluation of the intensive care unit. Part 1: Objectives, methods and cohort description. Intensive Care Med. 2005;31:1336–1344. doi: 10.1007/s00134-005-2762-6. - DOI - PMC - PubMed

Associated data