. 2021 Oct 18;17(10):e1008755.
doi: 10.1371/journal.pcbi.1008755. eCollection 2021 Oct.

Network potential identifies therapeutic miRNA cocktails in Ewing sarcoma

Affiliations

Network potential identifies therapeutic miRNA cocktails in Ewing sarcoma

Davis T Weaver et al. PLoS Comput Biol. .

Abstract

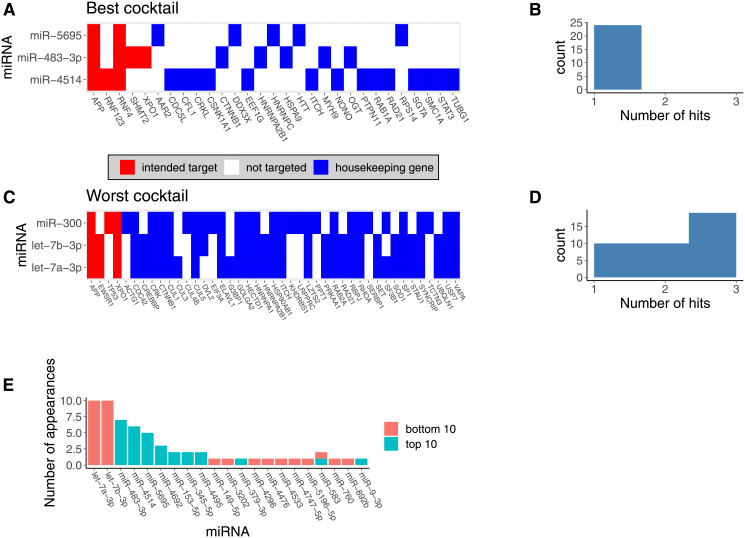
MicroRNA (miRNA)-based therapies are an emerging class of targeted therapeutics with many potential applications. Ewing Sarcoma patients could benefit dramatically from personalized miRNA therapy due to inter-patient heterogeneity and a lack of druggable (to this point) targets. However, because of the broad effects miRNAs may have on different cells and tissues, trials of miRNA therapies have struggled due to severe toxicity and unanticipated immune response. In order to overcome this hurdle, a network science-based approach is well-equipped to evaluate and identify miRNA candidates and combinations of candidates for the repression of key oncogenic targets while avoiding repression of essential housekeeping genes. We first characterized 6 Ewing sarcoma cell lines using mRNA sequencing. We then estimated a measure of tumor state, which we term network potential, based on both the mRNA gene expression and the underlying protein-protein interaction network in the tumor. Next, we ranked mRNA targets based on their contribution to network potential. We then identified miRNAs and combinations of miRNAs that preferentially act to repress mRNA targets with the greatest influence on network potential. Our analysis identified TRIM25, APP, ELAV1, RNF4, and HNRNPL as ideal mRNA targets for Ewing sarcoma therapy. Using predicted miRNA-mRNA target mappings, we identified miR-3613-3p, let-7a-3p, miR-300, miR-424-5p, and let-7b-3p as candidate optimal miRNAs for preferential repression of these targets. Ultimately, our work, as exemplified in the case of Ewing sarcoma, describes a novel pipeline by which personalized miRNA cocktails can be designed to maximally perturb gene networks contributing to cancer progression.


Conflict of interest statement

The authors have declared that no competing interests exist.

Figures

Fig 1
Fig 1. Cartoon describing rationale for focusing on miRNA combination therapy.
With single-agent therapy, both target mRNA and non-target mRNA are inhibited an equal amount, potentially resulting in toxicity due to off-target effects. With miRNA combination therapy, the common target mRNA is inhibited to a greater degree than any individual non-target miRNA.
Fig 2
Fig 2. Simplified schematic of our computational pipeline.
We defined a measure of tumor state, which we term network potential (Eq 1), based on both mRNA gene expression and the underlying protein-protein interaction (PPI) network. Next, we ranked mRNA targets based on their contribution to network potential of each cell line, aiming to approximate the relative importance of each mRNA to network stability. After identifying these mRNA targets, we then identified miRNA and miRNA cocktails that preferentially acted to repress the most influential of the ranked mRNA targets, with the aim of defining synthetic miRNA-based therapy for down-regulation of these targets.
Fig 3
Fig 3. Network potential demonstrates a different distribution compared to mRNA expression.
Main panel: scatterplot comparing mRNA expression and network potential for all genes in our 18 Ewing Sarcoma cell lines. For each gene, we averaged across all samples for both mRNA expression and network potential. Unlike network potential (top axis histogram), mRNA expression (right axis histogram) has a bimodal distribution.
Fig 4
Fig 4. TRIM25, APP, ELAVL1, AND RNF4, and XPO1 are the top protein targets ranked by predicted disruption following in silico repression.
Panel A: Box and whisker plot describing the change in network potential following in silico repression for each of the top 50 proteins. 99.99% confidence interval from the permutation test are displayed alongside the box and whisker plots. It is notable that EWSR1, the kinase associated with Ewing sarcoma development, is considered highly influential in the cell signaling network by this method, even in comparison to the computed null distribution. Genes that have previously been causally implicated in cancer according to the Cosmic database are highlighted in red [41]. Essential housekeeping genes (excluding those that are causally implicated in cancer) are highlighted in blue. The heat-map on the x-axis corresponds to the protein-mRNA correlation of each gene in the Cancer Cell Line Encyclopedia [34]. Panel B: Histogram depicting the distribution of Pearson correlation between mRNA expression and protein expression from the Cancer Cell Line Encyclopedia for all nodes included in our final Ewing sarcoma cell signaling networks. Proteins that were ranked particularly highly in panel A were labeled in panel B. Pancel C: Bar chart describing the most frequently observed genes among the top projected targets for the 15 patient tumor samples we analyzed. There was very little overlap in top projected targets between the cell line and patient data, reflecting the transcriptional heterogeneity present in Ewing Sarcoma.
Fig 5
Fig 5. Many of the most promising miRNA candidates repress large numbers of essential housekeeping genes.
We identified the top miRNA for treatment of Ewing sarcoma, ranked by their predicted disruption of the Ewing sarcoma cell signaling network. A: Boxplot showing the projected disruption in network potential for the top miRNA candidates (averaged across all samples). The heatmap on the x-axis describes the number of essential housekeeping genes that each miRNA is predicted to target. B: Scatterplot showing the relationship between projected network disruption and the number of putative mRNA targets for a given miRNA. C: Heatmap showing z-score normalized miRNA expression for 622 of the evaluated miRNA for the 6 cell lines under study. The Y axis is clustered by the projected ΔG associated with a given miRNA. There doesn’t seem to be a clear pattern of miRNA expression based on projected ΔG.
Fig 6
Fig 6. We identified miR-483–3p, miR-5695, and miR-4514s as the optimal 3-miRNA cocktail for Ewing Sarcoma therapy.
We identified cocktails that are predicted to maximally downregulate target genes (red shading on the figure), while avoiding downregulation of essential housekeeping genes to limit toxicity (blue shading on the figure). Panel A. shows the targeting heatmap for the best predicted cocktail for cell line A673. The miRNA that make up the cocktail are presented on the y-axis. Putative gene targets are highlighted on the x-axis. Lines that span multiple miRNAs occur when a gene is downregulated by 2 or more miRNAs in the cocktail. Panel B. shows a histogram of the number of microRNA that target a given housekeeping gene in the best cocktail. Panel C. displays the targeting heatmap for the worst-performing cocktail for cell line A673 among those tested for reference. Panel D. shows a histogram of the number of microRNA that target a given housekeeping gene in the worst predicted cocktail. Panel E shows a bar graph showing the miRNA that most frequently appear in either the bottom or top 10 predicted cocktails (averaged across cell lines) for Ewing Sarcoma therapy.

References

    1. Mackintosh C, Madoz-Gúrpide J, Ordóñez JL, Osuna D, Herrero-Martín D. The molecular pathogenesis of Ewing’s sarcoma. Cancer biology & therapy. 2010;9(9):655–67. doi: 10.4161/cbt.9.9.11511 - DOI - PubMed
    1. Esiashvili N, Goodman M, Marcus RB. Changes in Incidence and Survival of Ewing Sarcoma Patients Over the Past 3 Decades. Journal of Pediatric Hematology/Oncology. 2008;30(6):425–430. doi: 10.1097/MPH.0b013e31816e22f3 - DOI - PubMed
    1. Lawlor ER, Sorensen PH. Twenty Years On—What Do We Really Know About Ewing Sarcoma And What Is The Path Forward? Critical reviews in oncogenesis. 2015;20(0):155. doi: 10.1615/CritRevOncog.2015013553 - DOI - PMC - PubMed
    1. Riggi N, Suvà ML, De Vito C, Provero P, Stehle JC, Baumer K, et al.. EWS-FLI-1 modulates miRNA145 and SOX2 expression to initiate mesenchymal stem cell reprogramming toward Ewing sarcoma cancer stem cells. Genes & development. 2010;24(9):916–32. doi: 10.1101/gad.1899710 - DOI - PMC - PubMed
    1. Rupaimoole R, Slack FJ. MicroRNA therapeutics: towards a new era for the management of cancer and other diseases. Nature Reviews Drug Discovery. 2017;16(3):203–222. doi: 10.1038/nrd.2016.246 - DOI - PubMed

Publication types