. 2022 Mar 10;139(10):1557-1563.
doi: 10.1182/blood.2021012890.

High-risk subtypes of chronic lymphocytic leukemia are detectable as early as 16 years prior to diagnosis

Affiliations

High-risk subtypes of chronic lymphocytic leukemia are detectable as early as 16 years prior to diagnosis

P Martijn Kolijn et al. Blood. .

Abstract

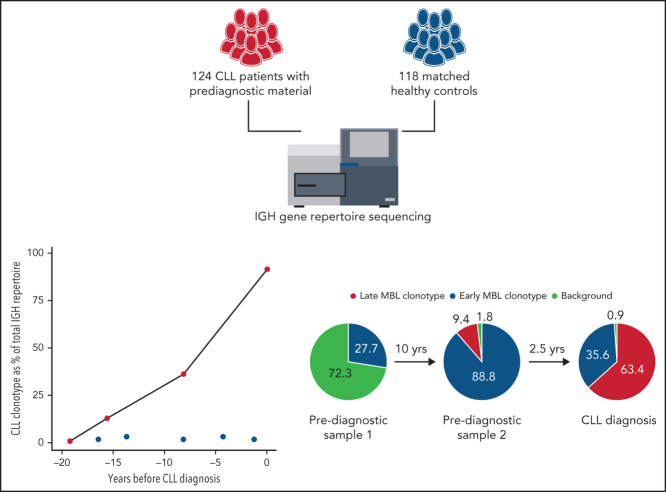
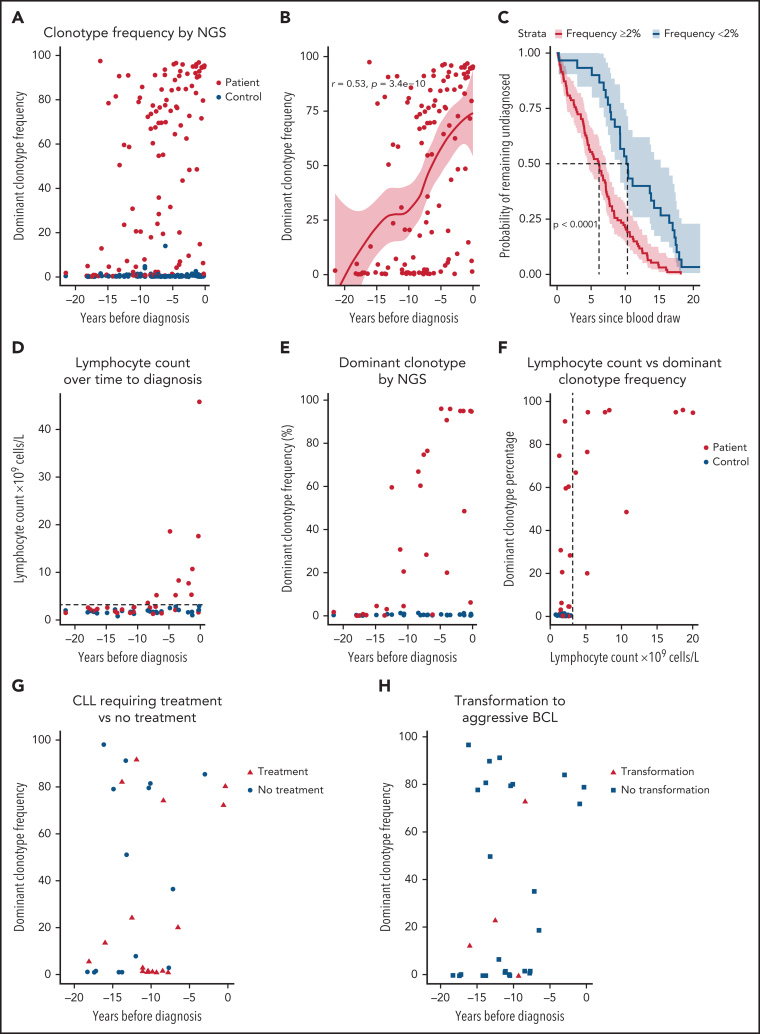
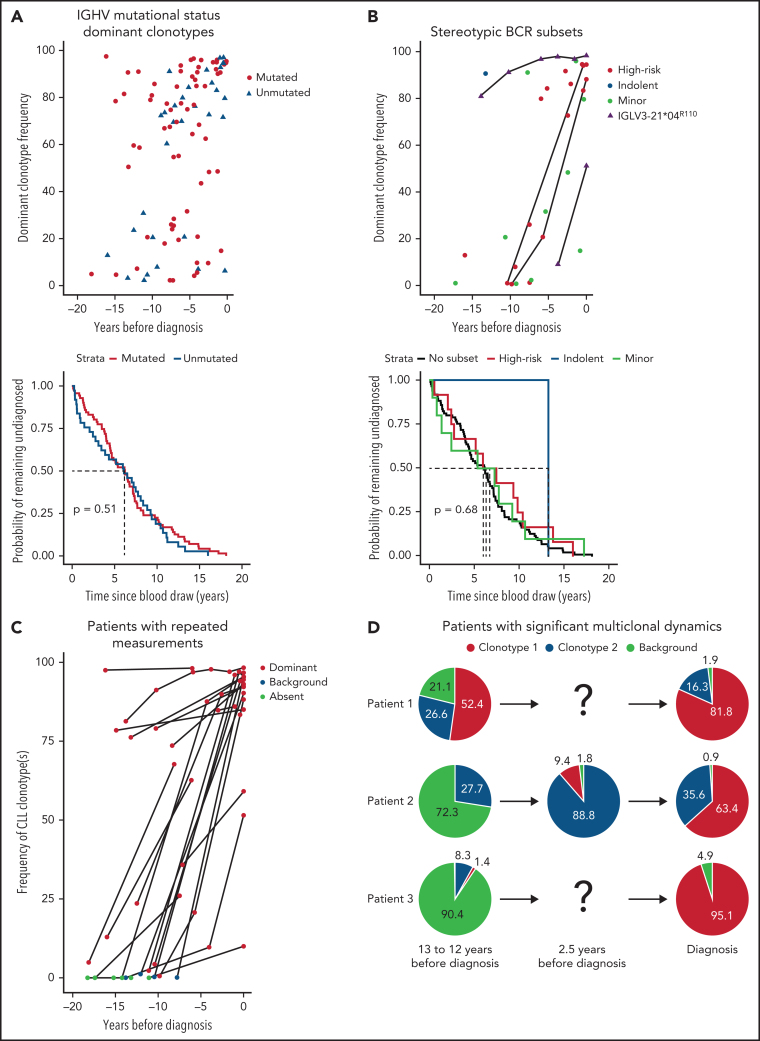
Chronic lymphocytic leukemia (CLL) is preceded by monoclonal B-cell lymphocytosis (MBL), a CLL precursor state with a prevalence of up to 12% in aged individuals; however, the duration of MBL and the mechanisms of its evolution to CLL remain largely unknown. In this study, we sequenced the B-cell receptor (BcR) immunoglobulin heavy chain (IGH) gene repertoire of 124 patients with CLL and 118 matched controls in blood samples taken up to 22 years prior to diagnosis. Significant skewing in the BcR IGH gene repertoire was detected in the majority of patients, even before the occurrence of lymphocytosis and irrespective of the clonotypic IGH variable gene somatic hypermutation status. Furthermore, we identified dominant clonotypes belonging to major stereotyped subsets associated with poor prognosis up to 16 years before diagnosis in 14 patients with CLL. In 22 patients with longitudinal samples, the skewing of the BcR IGH gene repertoire increased significantly over time to diagnosis or remained stable at high levels. For 14 of 16 patients with available samples at diagnosis, the CLL clonotype was already present in the prediagnostic samples. Overall, our data indicate that the preclinical phase of CLL could be longer than previously thought, even in adverse-prognostic cases.


Figures

None
Graphical abstract
Figure 1
Figure 1
Skewing of the BcR IGH gene repertoire is detectable by next-generation sequencing up to 16 years before CLL diagnosis. Dominant clonotype frequency represents the size of the largest (most frequent) productive clonotype as a percentage of the total productive IGH gene reads in each given sample. Time to diagnosis for controls reflects the time from sampling of the control to the diagnosis of the matched case. One sample was taken from each patient. (A) Dominant clonotype frequency for patients with CLL and matched controls over time to CLL diagnosis. (B) Positive correlation between time to diagnosis (TTD) and the dominant clonotype frequency as determined by Spearman correlation. The red line represents Loess regression, with 95% confidence intervals (CIs) marked around. (C) Kaplan-Meier (survival) analysis for TTD from prediagnostic sample collection stratified by clonotype frequency. TTD of patients with a dominant clonotype frequency ≥2% of the productive IGH gene repertoire is depicted in red, whereas TTD of patients with a dominant clonotype frequency <2% is depicted in blue. The 95% CI is marked for each line. Significance was determined by the log-rank test. (D) Lymphocyte counts in patients with future CLL and matched controls. (E) Dominant clonotype frequency for the same samples and individuals as in panel D. (F) Lymphocyte counts plotted against dominant clonotype frequency. The lymphocyte count of 1 outlier at 45 × 109/L was winsorized to 20 × 109/L to preserve visibility of low-level dynamics. Dashed line indicates cutoff for abnormal lymphocyte counts. (G) Skewing of the BcR IGH repertoire was detectable for CLL requiring treatment (red triangles) and indolent CLL during follow-up (blue circles), with a median follow-up period of 8.7 years. (H) Skewing of the IGH repertoire was detectable for patients with a transformation to an aggressive B-cell lymphoma and those without transformation during follow-up.
Figure 2
Figure 2
Characterization of prediagnostic and diagnostic samples. (A) IGHV mutational status determination of all samples from patients with future CLL with a dominant clonotype frequency >2%. If no clonotype > 2% dominant clonotype frequency was present in the earliest sample of a patient, dominant clonotypes from any later measurements were used. Mutated clonotypes are shown as red circles, whereas unmutated clonotypes (IGHV mutational status >98% germline sequence identity) are shown as blue triangles (upper panel). A Kaplan-Meier (survival) curve for time until CLL diagnosis stratified by IGHV mutational status, indicating that the log-rank test does not find any significant difference (lower panel). (B) Overview of all CLL subsets identified in the data; major subsets were divided by subsets associated with aggressive or indolent disease course. Minor subsets are shown separately in light green. Samples in which the K16 and YDSD motifs and the R110 mutation of light chain subset 2L were confirmed are shown as purple triangles. Patients with repeated samples are connected by a black line (upper panel). A Kaplan-Meier (survival) curve for the time to CLL diagnosis from prediagnostic sample collection stratified by BcR stereotyped CLL subsets, indicating that the log-rank test does not find any significant difference (lower panel). (C) Cumulative frequency of clonotypes detected at CLL diagnosis for the prediagnostic sample(s) and diagnostic sample. Cumulative indicates that if >1 clonotype was shared in the prediagnostic sample and diagnostic sample [eg, patient 1 and 2 in panel D], their frequency was summed up. For patients for whom no diagnostic sample was available, the most skewed clonotype in the sample closest to diagnosis was traced instead. (D) The distribution of the BcR IGH gene repertoire of 3 patients with multiple clonotypes that underwent significant shifts over time to diagnosis. Dominant clonotype at CLL diagnosis is shown in red for each sample, with any secondary clonotype at diagnosis shown in blue. All small unrelated clonotypes (frequency <5%) were summed up and shown as background in light green. For more information on all patients with diagnostic material, see supplemental Tables 1 and 3.

Comment in

References

    1. Hallek M, Cheson BD, Catovsky D, et al. International Workshop on Chronic Lymphocytic Leukemia Guidelines for the diagnosis and treatment of chronic lymphocytic leukemia: a report from the International Workshop on Chronic Lymphocytic Leukemia updating the National Cancer Institute-Working Group 1996 guidelines. Blood. 2008;111(12):5446–5456. - PMC - PubMed
    1. Hallek M. Chronic lymphocytic leukemia: 2020 update on diagnosis, risk stratification and treatment. Am J Hematol. 2019;94(11):1266–1287. - PubMed
    1. Landgren O, Albitar M, Ma W, et al. B-cell clones as early markers for chronic lymphocytic leukemia. N Engl J Med. 2009;360(7):659–667. - PMC - PubMed
    1. Strati P, Shanafelt TD. Monoclonal B-cell lymphocytosis and early-stage chronic lymphocytic leukemia: diagnosis, natural history, and risk stratification. Blood. 2015;126(4):454–462. - PMC - PubMed
    1. Henriques A, Rodríguez-Caballero A, Nieto WG, et al. Combined patterns of IGHV repertoire and cytogenetic/molecular alterations in monoclonal B lymphocytosis versus chronic lymphocytic leukemia. PLoS One. 2013;8(7):e67751. - PMC - PubMed

Publication types

MeSH terms

Substances