. 2022 Jan 7;39(1):msab304.
doi: 10.1093/molbev/msab304.

Detection of Neanderthal Adaptively Introgressed Genetic Variants That Modulate Reporter Gene Expression in Human Immune Cells

Affiliations

Detection of Neanderthal Adaptively Introgressed Genetic Variants That Modulate Reporter Gene Expression in Human Immune Cells

Evelyn Jagoda et al. Mol Biol Evol. .

Abstract

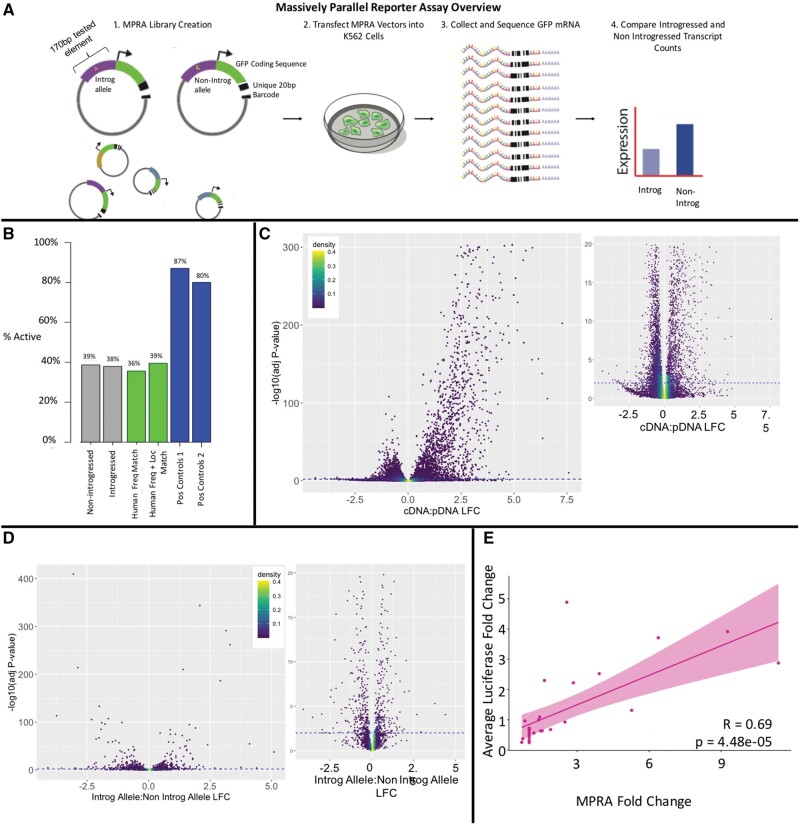
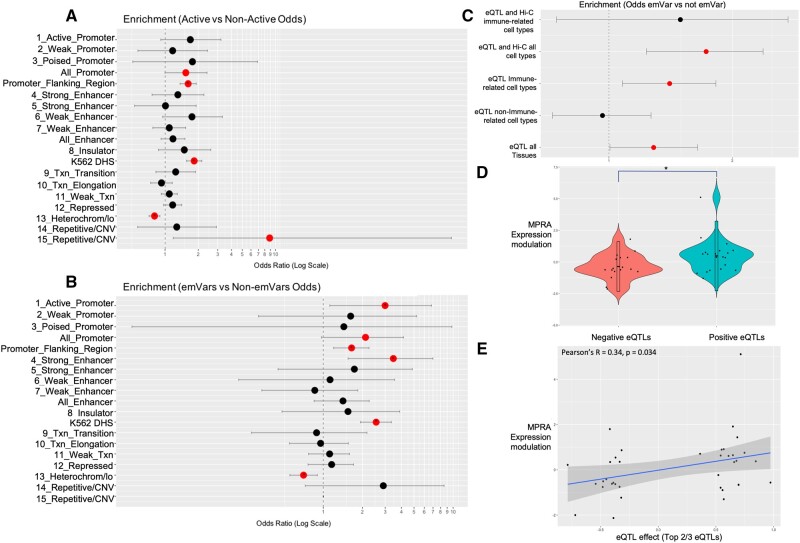
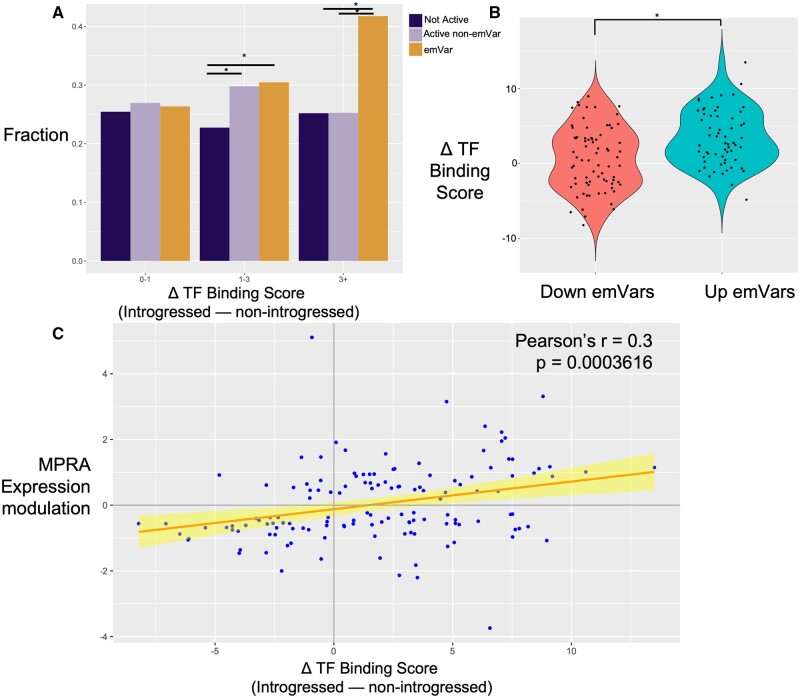
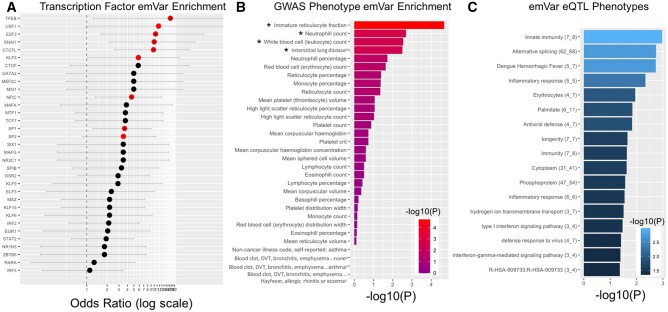
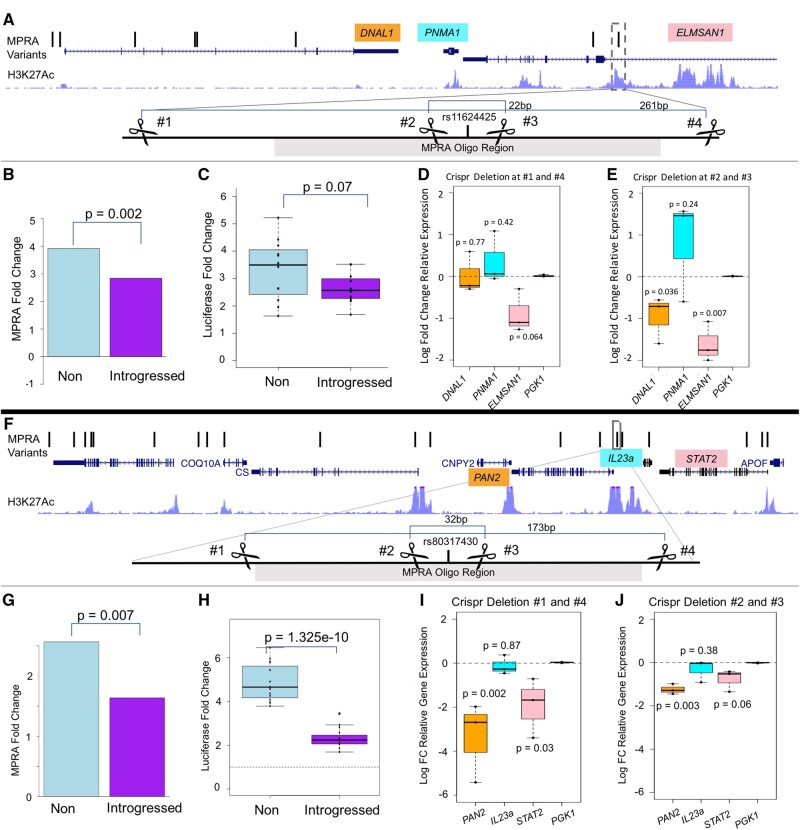
Although some variation introgressed from Neanderthals has undergone selective sweeps, little is known about its functional significance. We used a Massively Parallel Reporter Assay (MPRA) to assay 5,353 high-frequency introgressed variants for their ability to modulate the gene expression within 170 bp of endogenous sequence. We identified 2,548 variants in active putative cis-regulatory elements (CREs) and 292 expression-modulating variants (emVars). These emVars are predicted to alter the binding motifs of important immune transcription factors, are enriched for associations with neutrophil and white blood cell count, and are associated with the expression of genes that function in innate immune pathways including inflammatory response and antiviral defense. We combined the MPRA data with other data sets to identify strong candidates to be driver variants of positive selection including an emVar that may contribute to protection against severe COVID-19 response. We endogenously deleted two CREs containing expression-modulation variants linked to immune function, rs11624425 and rs80317430, identifying their primary genic targets as ELMSAN1, and PAN2 and STAT2, respectively, three genes differentially expressed during influenza infection. Overall, we present the first database of experimentally identified expression-modulating Neanderthal-introgressed alleles contributing to potential immune response in modern humans.

Keywords: adaptation; immune; introgression; massively parallel reporter assay; neandertal; positive selection.


Figures

Fig. 1.
Fig. 1.
Massively parallel reporter assay overview and results. (A) Experimental overview. Following Tewhey et al. (2016), MPRA was conducted through the creation of reporter vectors containing either the introgressed or nonintrogressed allele at a locus along with 85 bp of endogenous flanking sequence on either side including any variants linked at r2>0.9 to the variant of interest. These experimental oligo sequences are fixed with unique 20 bp barcode sequences and cloned into reporter vectors containing the GFP coding sequence and a minimal promoter. The whole vector pool is transfected into K562 cells and resultant GFP mRNA is collected and sequenced. Transcripts are linked to the experimental sequence via the transcribed barcode and normalized introgressed and nonintrogressed transcript counts are compared. (B) MPRA activity results. Number of active putative CREs across tested categories as defined in text. Pos Control 1 are active sequences from a prior MPRA in LCL cells (Ulirsch et al. 2016) and Pos Control 2 are active sequences from a prior MPRA in K562 cells (Sloan et al. 2016). (C) Volcano plots showing the distribution of activity for all tested elements sequences by comparing the cDNA:pDNA ratio LFC and calculating the adjusted P value. The blue dotted line represents the P value threshold −log10(0.01). Points about the line are considered significantly active CREs. The plot to the right is a zoomed-in version, showing just sequences with −log10(P)<20. (D) Volcano plots showing the distribution of expression modulation for variants in active CREs determined by comparing the introgressed to nonintrogressed allelic ratio LFC and calculating the adjusted P value. Points above the line are considered significantly emVars. The plot to the right is a zoomed-in version, showing just sequences with −log10(P)<20. (E) SLRA luciferase validation. X axis—activity results from MPRA reported as fold change RNA:DNA. Y axis—average luciferase activity normalized to empty luciferase vector across replicates. Pearson’s r = 0.6922, P = 4.479e-05.
Fig. 2.
Fig. 2.
Active CREs and emVars display prosperities of endogenous K562 biology. (A) Enrichment of active CREs in K562 genomic features relative to nonactive sequences. (B) Enrichment of emVar sequences in K562 genomic features relative to non-emVar sequences. (C) Enrichment of emVars acting as eQTLs and eQTLs in the presence of evidence that they reside in a regulatory element that interacts with a target gene via Hi-C chromatin interaction data in immunological or any cell type. (AC) Enrichments are reported as Fisher’s OR with lines indicating confidence intervals. Significant enrichments (P < 0.05) are colored in red. (D) Violin plots of MPRA expression modulation for emVars acting as downregulatory (negative) or upregulatory (positive) eQTLs (top two-third of eQTL signals). Positively associating eQTLs show significantly higher MPRA skew values than negatively associated eQTLs (t-test, P = 0.038). (E) Correlation between eQTL effect (top two-third of eQTLs) and MPRA expression modulation. We note there is an overall significant correlation between the eQTL effect and MPRA skew for this set (Pearson’s r = 0.34, P = 0.034).
Fig. 3.
Fig. 3.
Transcription factor-binding site analysis of emVars. (A) After curating a set of predicted TF-binding motifs in K562 cells (see Materials and Methods) and examining at each introgressed and nonintrogressed sequence how each variant alters binding strength (deltaTF Binding score), we compared different classes of variants (not-active variants, active non-emVars, and emVars) for their overall impacts on differential binding. In general, emVars are more likely to lead to both large changes (3+) in predicted binding strength than either nonactive sequences (OR=1.91, P = 2.1×10⁻⁵) or active sequences with no emVar (OR=1.93, P = 2.9×10⁻⁵). emVars and active sequences with no emVar are both more likely than nonactive sequences to have moderate changes (1–3) in predicted binding strength (OR emVar vs. nonactive=1.42, P = 2.4×10⁻⁵, OR active vs. nonactive=1.36, P = 0.002). (B) We then compared binding affinities at each variant in each emVar to their direction of effect on expression in MPRA. In general, emVars that upregulated expression in the MPRA were predicted to have stronger binding to TFs than those that downregulated in the MRPA (t-test P = 6.9×10⁻⁵). (C) Correlation analysis between emVar MPRA expression modulating effect (LFC cDNA:pDNA) and the predicted change in TF-binding score, noting a significant moderate correlation between (r = 0.3, P = 0.0004). In all three panels, delta (Δ) TF-binding score is calculated as the introgressed TF-binding score minus the nonintrogressed binding score.
Fig. 4.
Fig. 4.
Phenotypic analysis of emVars. (A) Transcription factor-binding site enrichment analysis comparing the number of predicted changes to TF-binding motifs by emVars compared with non-emVars. Enrichments are reported as Fisher’s OR with lines indicating confidence intervals. Significant enrichments (P < 0.05) are colored in red, those surviving FDR correction (FDR<0.1) are denoted with an asterisk. (B) Enrichment analysis of all tested alleles and emVars with GWAS data acquired from the Neale Labe (http://www.nealelab.is/uk-biobank/, last accessed November 19, 2021) (see Materials and Methods). Asterisks indicate four phenotypes for which emVars are significantly enriched relative to tested non-emVars after FDR correction (P < 0.05, FDR<0.05). (C) Enrichment analysis using DAVID (Huang et al. 2009a, 2009b) of emVar response genes determined via eQTL analyses in immunologically relevant cell lines. The background set is the entire human genome. A number of highly relevant immunological phenotypes are observed as significantly enriched. The number of response genes and emVars is denoted next to each phenotype in the form “Phenotype Name (#Genes_#emVars).”
Fig. 5.
Fig. 5.
Functional experiments on rs11624425 and rs80317430 emVars. (A) rs11624425 locus plot and CRISPR-cas9 targeting strategy. All eight MPRA variants associated with PNAM1 expression are plotted as ticks along a minimal schematic of the region chr14-74,096,432–74,265,785 with the three genes of interest noted. The location of the region surround rs11624425 is boxed and the below schematic indicates the relative location of the crispr guides and the sizes of the two deletions created. (B) rs11624425 MPRA activity results. (C) rs11624425 SLRA results. (D, E) qPCR results for CRISPR-deleted cells surrounding rs11624425. (F) rs80317430 locus plot and CRISPR-cas9 targeting strategy. The location of the region surround rs80317430 is boxed within the minial schematic of the region chr12:56,695,000–56,765,000 with the genes of interest noted. The other two Il23a-associated MPRA tested variants fall outside the bounds of this graph. The below schematic indicates the relative location of the CRISPR guides and the sizes of the two deletions created. (G) rs80317430 MPRA activity results. (H) rs80317430 SLRA results. (I, J) qPCR results for CRISPR-deleted cells surrounding rs80317430.

References

    1. 1000 Genomes Project Consortium. 2015. A global reference for human genetic variation. Nature 526:68–74. - PMC - PubMed
    1. Astle WJ, Elding H, Jiang T, Allen D, Ruklisa D, Mann AL, Mead D, Bouman H, Riveros-Mckay F, Kostadima MA, et al. 2016. The allelic landscape of human blood cell trait variation and links to common complex disease. Cell 167(5):1415–1429. - PMC - PubMed
    1. Bath P, Algert C, Chapman N, Neal B, PROGRESS Collaborative Group. 2004. Association of mean platelet volume with risk of stroke among 3134 individuals with history of cerebrovascular disease. Stroke 35(3):622–626. - PubMed
    1. Benson G. 1999. Tandem repeats finder: a program to analyze DNA sequences. Nucleic Acids Res. 27(2):573–580. - PMC - PubMed
    1. Bett JS, Ibrahim AFM, Garg AK, Kelly V, Pedrioli P, Rocha S, Hay RT.. 2013. The P-body component USP52/PAN2 is a novel regulator of HIF1A mRNA stability. Biochem J. 451(2):185–194. - PMC - PubMed

Publication types