. 2021 Oct 18;16(1):435.
doi: 10.1186/s13023-021-02058-y.

Eat, breathe, sleep with Osteogenesis Imperfecta

Affiliations

Eat, breathe, sleep with Osteogenesis Imperfecta

Antonella LoMauro et al. Orphanet J Rare Dis. .

Abstract

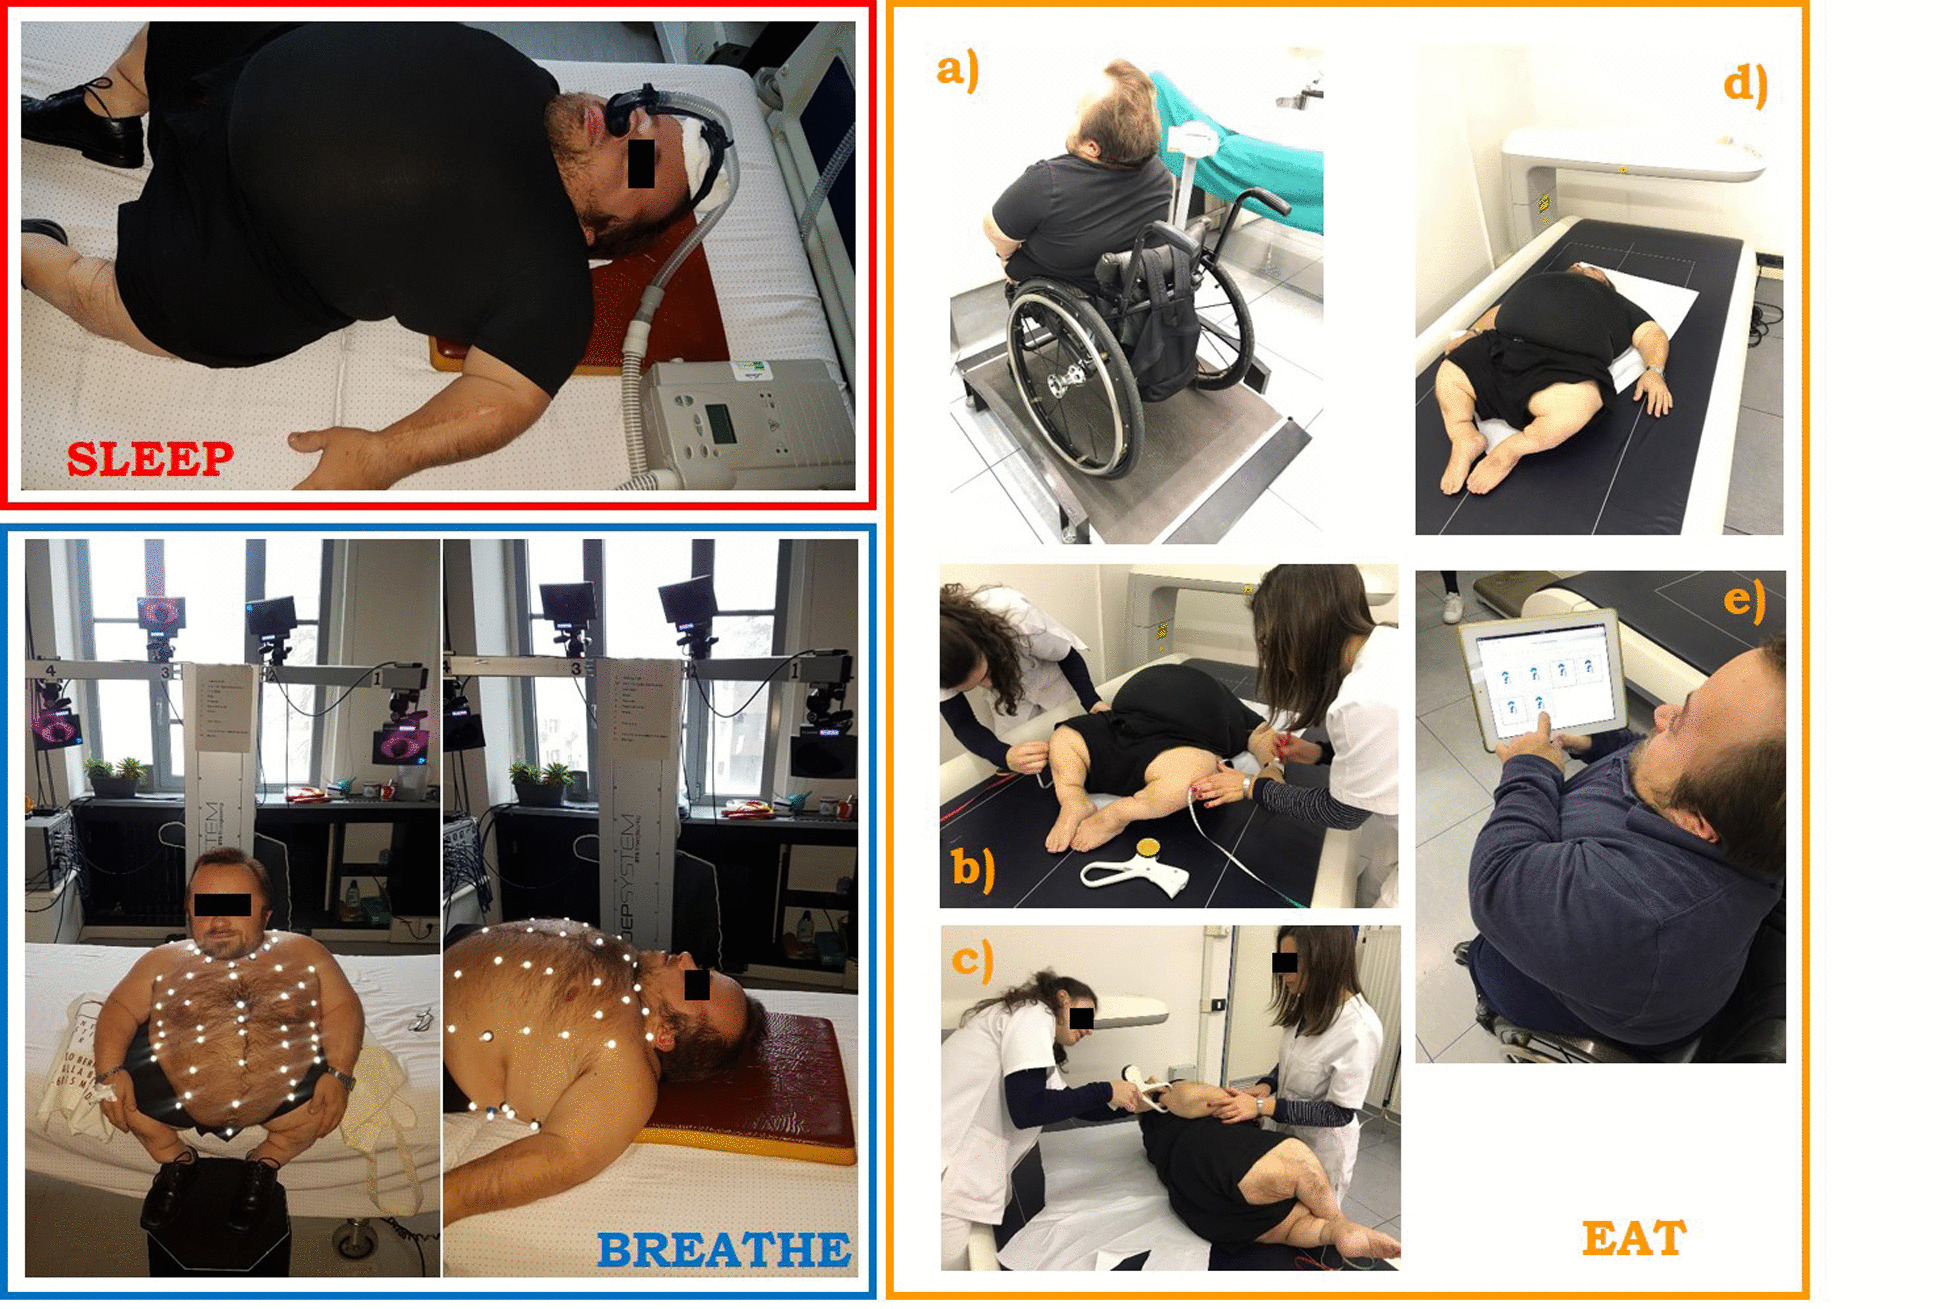
Background: Although Osteogenesis Imperfecta (OI) affects the connective tissue causing extremely brittle bones with consequent skeletal deformities, it is important to go beyond bones. Indeed, the quality of life in OI does not only depend on bones status, as OI might affect also other important functions. We have therefore implemented a multidisciplinary study to assess lung function, breathing pattern, sleep quality and nutritional status in 27 adult OI type III and IV patients (median age: 34.6 years; 19 women; 14 type III).

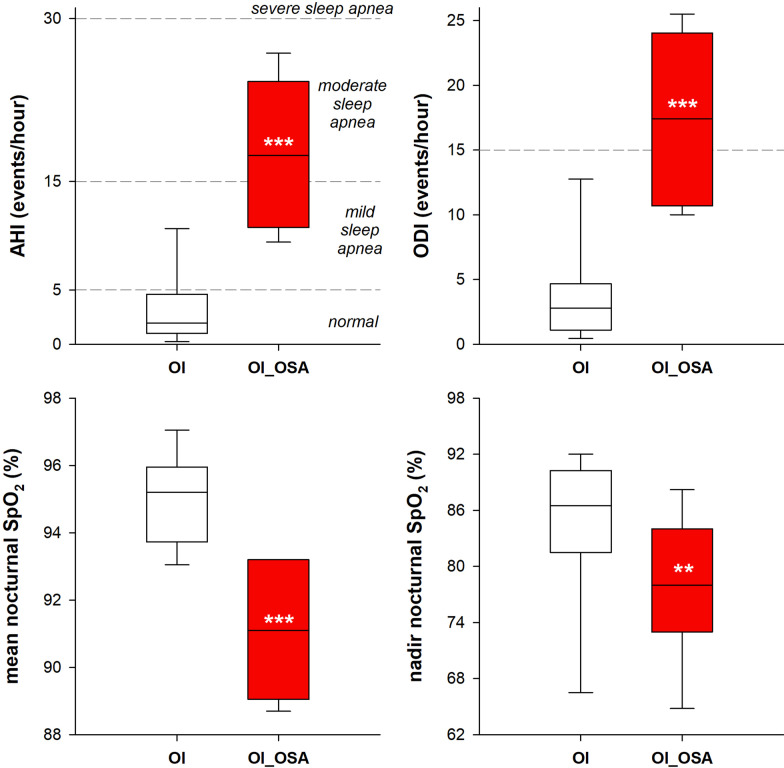
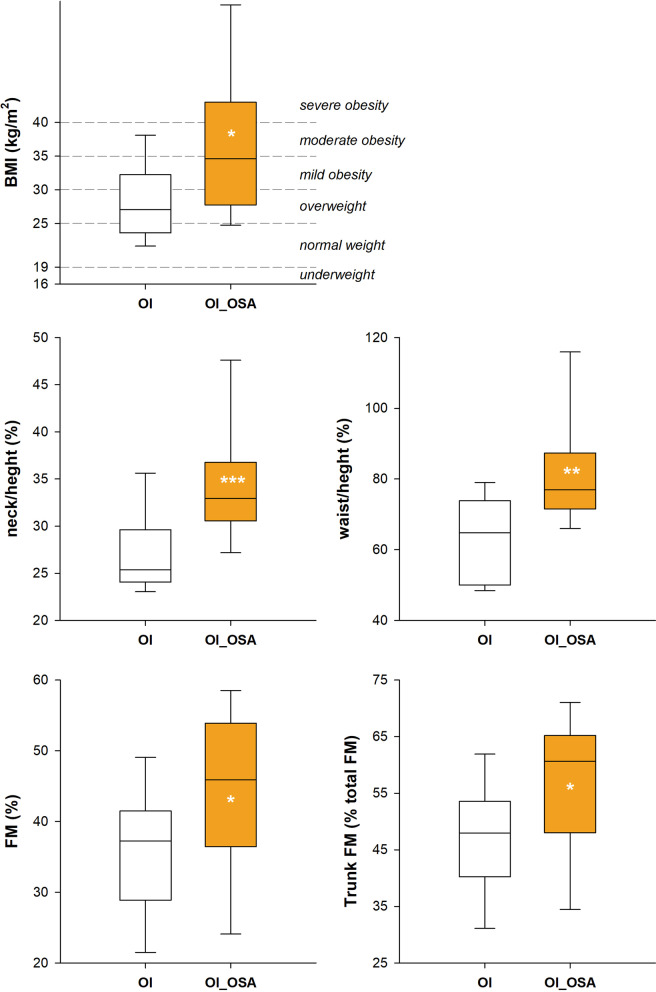
Results: According to nocturnal oxygen desaturation, two groups were identified: 13 patients with (OI_OSA, incidence: 48.2%) and 14 without (no_OSA) obstructive sleep apnea. The former was characterized by higher spinal and ribcage deformity, by more restrictive lung function, by paradoxical thoracic breathing in supine position, by rapid and shallow breathing, by higher body mass index, by longer neck and waist circumferences; by higher abdominal volume and by greater percentage of body fat mass, particularly localized in the trunk. The best predictor of OI_OSA was the negative value of the supine ribcage contribution to tidal volume, followed by the ratio between the neck and the waist circumferences with body height and the supine thoraco-abdominal volumes phase shift angle.

Conclusions: The pathophysiology of OI ensued a dangerous vicious circle, in which breathing, sleep and nutritional status are tightly linked, and they might all end up in negatively affecting the quality of life. The vicious circle is fed by some intrinsic characteristics of the disease (thoracic, cranial and mandibular deformities) and some bad daily habits of the patients (i.e. physical inactivity and low dietary quality). The former impacts on restricting the respiratory function, the latter makes Olers more prone to experience overweight or obesity. The main consequence is a high incidence of obstructive sleep apnea, which remains an underdiagnosed disorder in individuals with severe OI who are obese, with a neck to height ratio over than 31.6%, and characterized by paradoxical breathing in supine position. A multidisciplinary approach, including evaluations of breathing, sleep and nutrition, is required to better manage the disease and fulfil the maximizing well-being of OI patients.

Keywords: AHI index; Body composition; Fat mass; Mediterranean diet; Non-invasive ventilation; Obstructive sleep apnea; Opto-electronic plethysmography; Osteogenesis Imperfecta; Scoliosis; Spirometry.


Conflict of interest statement

The authors have no conflict of interest to declare.

Figures

Fig. 1
Fig. 1
Protocol of measurement: sleep study in a patient already using nocturnal non-invasive mechanical ventilation (SLEEP, red); breathing pattern assessment through opto-electronic plethysmography (BREATHE, blue) and weight, height, anthropometric measurements, MED questionnaire (EAT, yellow)
Fig. 2
Fig. 2
Box-plot representing the median (line within the box), the 10th (whisker below the box), 25th (boundary of the box closest to zero), the 75th (boundary of the box farthest from zero) and the 90th (whisker above the box) percentiles of AHI index (top left), ODI index (top right), mean (bottom left) and nadir (bottom right) nocturnal saturation in patients with (OI_OSA, red) and without (OI, white) obstructive sleep apnea. **p < 0.01; ***p < 0.001
Fig. 3
Fig. 3
Box-plot representing the median (line within the box), the 10th (whisker below the box), 25th (boundary of the box closest to zero), the 75th (boundary of the box farthest from zero) and the 90th (whisker above the box) percentiles of forced vital capacity (top), forced expiratory volume in the first second (middle) and total lung capacity (bottom) in patients with (OI_OSA, blue) and without (OI, white) obstructive sleep apnea. Data are expressed both as litres (left panels) and as percentage of the predicted values (right panels). *p < 0.05; **p < 0.01; ***p < 0.001
Fig. 4
Fig. 4
Box-plot representing the median (line within the box), the 10th (whisker below the box), 25th (boundary of the box closest to zero), the 75th (boundary of the box farthest from zero) and the 90th (whisker above the box) percentiles of minute ventilation (top left), rapid and shallow breathing index (top right), breathing frequency (middle left), tidal volume (middle right), pulmonary ribcage percentage contribution to tidal volume (bottom left) and thoraco-abdominal phase shift angle (bottom right) at rest in supine position in patients with (OI_OSA, blue) and without (OI, white) obstructive sleep apnea. *p < 0.05; ***p < 0.001
Fig. 5
Fig. 5
Box-plot representing the median (line within the box), the 10th (whisker below the box), 25th (boundary of the box closest to zero), the 75th (boundary of the box farthest from zero) and the 90th (whisker above the box) percentiles of minute ventilation (top left), rapid and shallow breathing index (top right), breathing frequency (middle left), tidal volume (middle right), pulmonary ribcage percentage contribution to tidal volume (bottom left) and thoraco-abdominal phase shift angle (bottom right) at rest in seated position in patients with (OI_OSA, blue) and without (OI, white) obstructive sleep apnea. *p < 0.05; **p < 0.01
Fig. 6
Fig. 6
Box-plot representing the median (line within the box), the 10th (whisker below the box), 25th (boundary of the box closest to zero), the 75th (boundary of the box farthest from zero) and the 90th (whisker above the box) percentiles of body mass index (top left), neck circumference to height ratio (middle left), waist circumference to height ratio (middle right), total percentage of fat mass (bottom left) and the percentage of trunk fat mass (bottom right) in patients with (OI_OSA, yellow) and without (OI, white) obstructive sleep apnea. *p < 0.05; **p < 0.01; ***p < 0.001
Fig. 7
Fig. 7
Diagram of the dangerous vicious circle, ensued by the pathophysiology of OI, in which breathing, sleep and body composition are tightly linked, and they all negatively affect the quality of life in OI patients.: ↓ reduced. ↑: increased
Fig. 8
Fig. 8
Volume variations of the ribcage (VRC) and total chest wall (VCW) in an OI type III patient during one minute of spontaneous quite breathing (QB) followed by five minutes of noninvasive ventilation and again one minute of spontaneous breathing after switching off the ventilator (top two tracings). The single breaths indicated by thick lines in the top tracings are shown zoomed in the bottom panels. Data recorded in supine position. Note the presence of an inspiratory paradoxical inward motion of RC during QB (A), its reduction immediately after the connection to the ventilator (B), the in-phase inspiratory expansion of RC after about 5 min of connection to the ventilator (C) and the reappearance of the paradoxical motion of RC immediately after the switching off the ventilator (D)

References

    1. Subramanian S, Viswanathan VK. Osteogenesis Imperfecta. StatPearls. 2021 [cited 2021 Jun 1]. - PubMed
    1. Rauch F, Glorieux FH. Osteogenesis imperfecta. Lancet. 2004;363:1377–1385. - PubMed
    1. Van Dijk FS, Pals G, Van Rijn RR, Nikkels PGJ, Cobben JM. Classification of Osteogenesis imperfecta revisited. Eur J Med Genet. 2010;53:1–5. - PubMed
    1. McAllion SJ, Paterson CR. Causes of death in osteogenesis imperfecta. J Clin Pathol. 1996;49:627–630. - PMC - PubMed
    1. Paterson CR, Ogston SA, Henry RM. Life expectancy in osteogenesis imperfecta. BMJ. 1996;312:351. - PMC - PubMed

Publication types