

Differential enrichment of H3K9me3 at annotated satellite DNA repeats in human cell lines and during fetal development in mouse
- PMID: 34663449
- PMCID: PMC8524813
- DOI: 10.1186/s13072-021-00423-6
Differential enrichment of H3K9me3 at annotated satellite DNA repeats in human cell lines and during fetal development in mouse
Abstract
Background: Trimethylation of histone H3 on lysine 9 (H3K9me3) at satellite DNA sequences has been primarily studied at (peri)centromeric regions, where its level shows differences associated with various processes such as development and malignant transformation. However, the dynamics of H3K9me3 at distal satellite DNA repeats has not been thoroughly investigated.
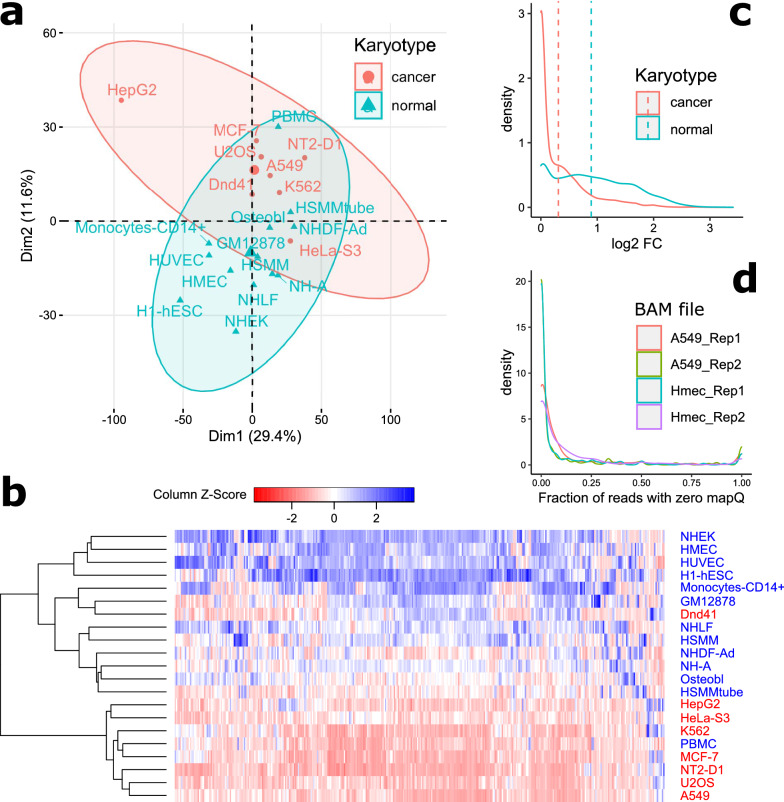
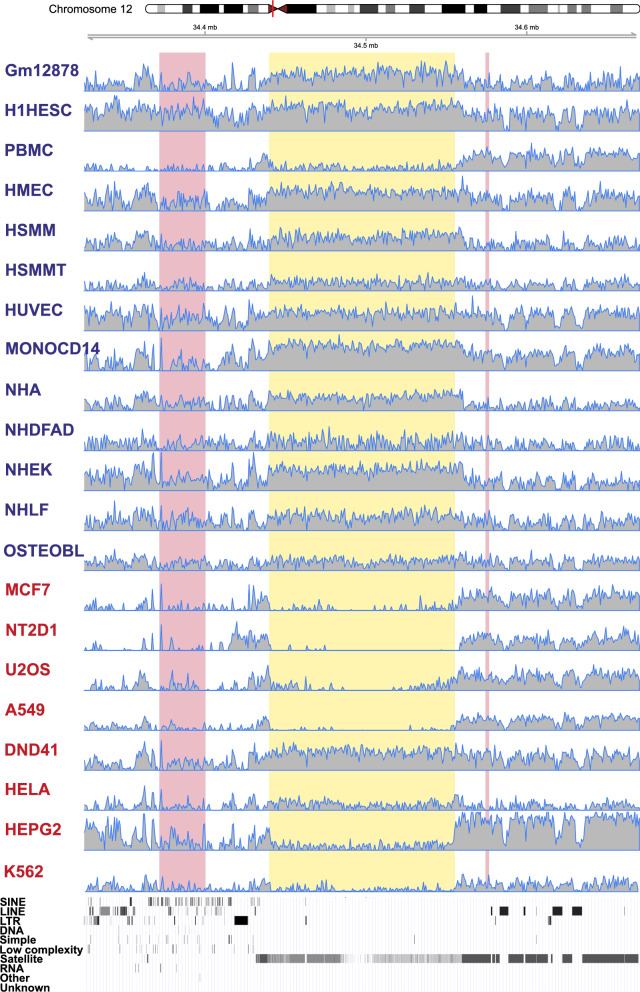
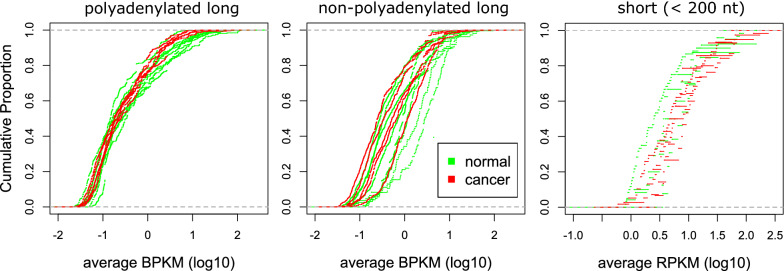
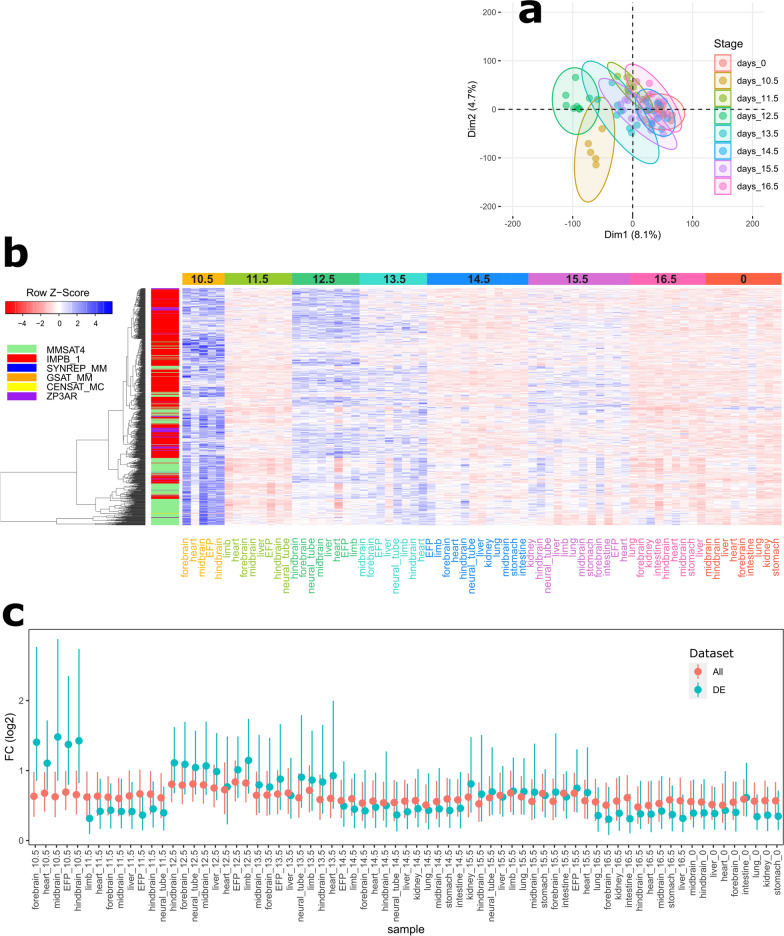
Results: We exploit the sets of publicly available data derived from chromatin immunoprecipitation combined with massively parallel DNA sequencing (ChIP-Seq), produced by the The Encyclopedia of DNA Elements (ENCODE) project, to analyze H3K9me3 at assembled satellite DNA repeats in genomes of human cell lines and during mouse fetal development. We show that annotated satellite elements are generally enriched for H3K9me3, but its level in cancer cell lines is on average lower than in normal cell lines. We find 407 satellite DNA instances with differential H3K9me3 enrichment between cancer and normal cells including a large 115-kb cluster of GSATII elements on chromosome 12. Differentially enriched regions are not limited to satellite DNA instances, but instead encompass a wider region of flanking sequences. We found no correlation between the levels of H3K9me3 and noncoding RNA at corresponding satellite DNA loci. The analysis of data derived from multiple tissues identified 864 instances of satellite DNA sequences in the mouse reference genome that are differentially enriched between fetal developmental stages.
Conclusions: Our study reveals significant differences in H3K9me3 level at a subset of satellite repeats between biological states and as such contributes to understanding of the role of satellite DNA repeats in epigenetic regulation during development and carcinogenesis.
Keywords: Cell lines; ChIP-Seq; Development; Epigenetics; H3K9me3; Heterochromatin; Histone marks; Human genome; Mouse genome; Satellite DNA.
© 2021. The Author(s).
Conflict of interest statement
The authors declare that they have no competing interests.
Figures
Similar articles
-
Heat Stress Affects H3K9me3 Level at Human Alpha Satellite DNA Repeats.Genes (Basel). 2020 Jun 18;11(6):663. doi: 10.3390/genes11060663. Genes (Basel). 2020. PMID: 32570830 Free PMC article.
-
HP1 recruits activity-dependent neuroprotective protein to H3K9me3 marked pericentromeric heterochromatin for silencing of major satellite repeats.PLoS One. 2011 Jan 18;6(1):e15894. doi: 10.1371/journal.pone.0015894. PLoS One. 2011. PMID: 21267468 Free PMC article.
-
The profile of repeat-associated histone lysine methylation states in the mouse epigenome.EMBO J. 2005 Feb 23;24(4):800-12. doi: 10.1038/sj.emboj.7600545. Epub 2005 Jan 27. EMBO J. 2005. PMID: 15678104 Free PMC article.
-
Role of H3K9me3 heterochromatin in cell identity establishment and maintenance.Curr Opin Genet Dev. 2019 Apr;55:1-10. doi: 10.1016/j.gde.2019.04.013. Epub 2019 May 16. Curr Opin Genet Dev. 2019. PMID: 31103921 Free PMC article. Review.
-
Sequence, Chromatin and Evolution of Satellite DNA.Int J Mol Sci. 2021 Apr 21;22(9):4309. doi: 10.3390/ijms22094309. Int J Mol Sci. 2021. PMID: 33919233 Free PMC article. Review.
Cited by
-
Long-read genome assembly of the insect model organism Tribolium castaneum reveals spread of satellite DNA in gene-rich regions by recurrent burst events.Genome Res. 2024 Nov 20;34(11):1878-1894. doi: 10.1101/gr.279225.124. Genome Res. 2024. PMID: 39438111 Free PMC article.
-
Human Satellite 1A analysis provides evidence of pericentromeric transcription.BMC Biol. 2023 Feb 8;21(1):28. doi: 10.1186/s12915-023-01521-5. BMC Biol. 2023. PMID: 36755311 Free PMC article.
-
Satellite DNAs in Health and Disease.Genes (Basel). 2022 Jun 26;13(7):1154. doi: 10.3390/genes13071154. Genes (Basel). 2022. PMID: 35885937 Free PMC article. Review.
-
Alpha Satellite DNA in Targeted Drug Therapy for Prostate Cancer.Int J Mol Sci. 2023 Oct 25;24(21):15585. doi: 10.3390/ijms242115585. Int J Mol Sci. 2023. PMID: 37958565 Free PMC article.
References
-
- Burton A, Brochard V, Galan C, Ruiz-morales ER, Rovira Q, Rodriguez-terrones D, et al. Heterochromatin establishment during early mammalian development is regulated by pericentromeric RNA and characterized by non-repressive H3K9me3. Nat Cell Biol. 2020;22:767–778. doi: 10.1038/s41556-020-0536-6. - DOI - PMC - PubMed
-
- Pavlek M, Gelfand Y, Plohl M, Meštrović N. Genome-wide analysis of tandem repeats in Tribolium castaneum genome reveals abundant and highly dynamic tandem repeat families with satellite DNA features in euchromatic chromosomal arms. DNA Res. 2015;22:387–401. doi: 10.1093/dnares/dsv021. - DOI - PMC - PubMed
Publication types
MeSH terms
Substances
LinkOut - more resources
Full Text Sources
