. 2021 Oct 19;118(42):e2108856118.
doi: 10.1073/pnas.2108856118.

Molecular insights into mechanisms of GPCR hijacking by Staphylococcus aureus

Affiliations

Molecular insights into mechanisms of GPCR hijacking by Staphylococcus aureus

Claire M Grison et al. Proc Natl Acad Sci U S A. .

Abstract

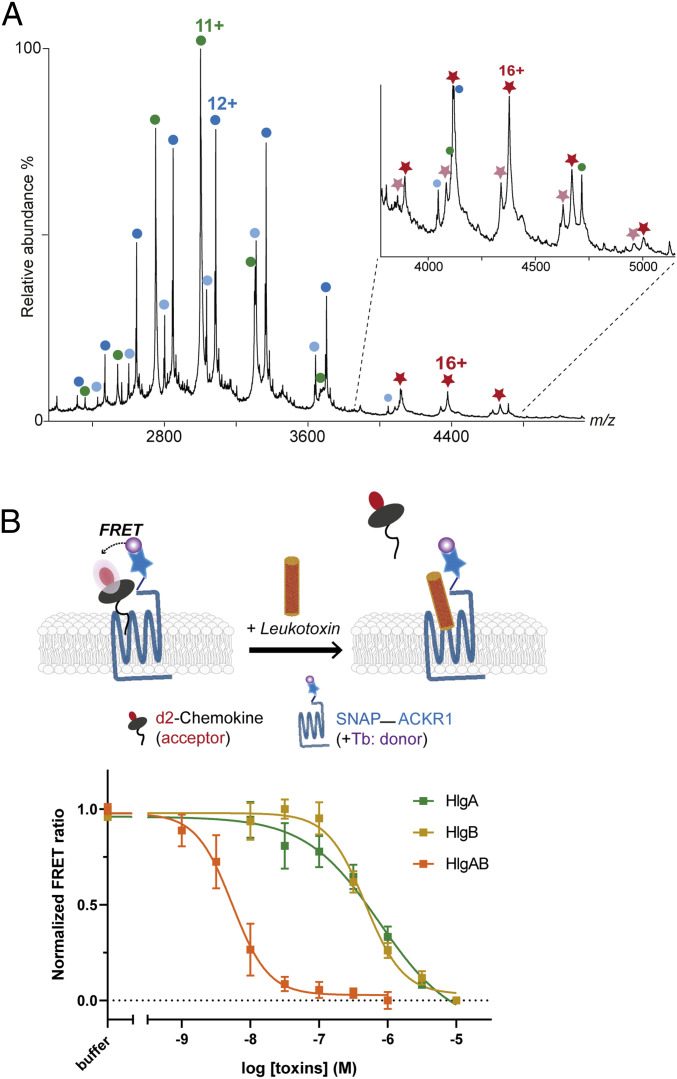
Atypical chemokine receptor 1 (ACKR1) is a G protein-coupled receptor (GPCR) targeted by Staphylococcus aureus bicomponent pore-forming leukotoxins to promote bacterial growth and immune evasion. Here, we have developed an integrative molecular pharmacology and structural biology approach in order to characterize the effect of leukotoxins HlgA and HlgB on ACKR1 structure and function. Interestingly, using cell-based assays and native mass spectrometry, we found that both components HlgA and HlgB compete with endogenous chemokines through a direct binding with the extracellular domain of ACKR1. Unexpectedly, hydrogen/deuterium exchange mass spectrometry analysis revealed that toxin binding allosterically modulates the intracellular G protein-binding domain of the receptor, resulting in dissociation and/or changes in the architecture of ACKR1-Gαi1 protein complexes observed in living cells. Altogether, our study brings important molecular insights into the initial steps of leukotoxins targeting a host GPCR.

Keywords: GPCR; host–pathogen interactions; pharmacology; structural mass spectrometry.


Conflict of interest statement

The authors declare no competing interest.

Figures

Fig. 1.
Fig. 1.
nMS spectra of leukotoxins and ACKR1. (A) nMS spectrum of 30 µM HlgA and (B) 15 µM HlgB showing the presence of both monomeric (33,004 ± 1 Da and 34,943 ± 1 Da, respectively) and dimeric (66,061 ± 14 Da and 69,972 ± 10 Da, respectively) species. Several sodium adducts were visible with both toxins and could be resolved for the monomeric but not for the dimeric peaks due to the decay in the apparent resolution when working in nMS mode (67). Theoretical masses of HlgA monomer and dimer: 33,004 and 66,008 Da. Theoretical masses of HlgB monomer and dimer are 34,943 and 69,886 Da. Single and double circles shown at similar m/z regions correspond to overlapping signals coming from monomers and homodimers. (C) nMS spectrum of a mixture of 10 µM HlgA and 10 µM HlgB showing the additional presence of HlgAB heterodimers (69,925 ± 9 Da). Overlapping signal from HlgB 9+, HlgBB 18+, and HlgAA 17+ is visible at m/z around 3,885. Bar diagram shows the relative quantification in this equimolar mixture relative to the most intense species in the spectrum (i.e., HlgA monomer). (D) SEC profile of purified ACKR1 showing the ultraviolet (UV) absorbance at 280 nm as a function of the elution volume. (E) nMS spectrum of monomeric and (F) dimeric ACKR1 produced in HEK GnTI cells (40,531 ± 32 Da and 81,032 ± 50 Da, respectively) showing an additional ∼3.5 kDa glycosylations per monomer. All samples were buffer exchanged in 200 mM ammonium acetate pH 7.4 supplemented with 2 CMC DDM prior to nMS analysis. Single green circles: HlgA; double green circles: HlgAA; single yellow circles: HlgB; double yellow circles: HlgBB; double green and yellow circles: HlgAB; single blue circles: ACKR1 WT; double blue circles: ACKR1 homodimer.
Fig. 2.
Fig. 2.
Binding of leukotoxins to ACKR1 in vitro and in living cells. (A) nMS spectrum of a mixture of 2 µM HlgA and 5 µM ACKR1 treated with PNGaseF, showing the presence of monomeric HlgA (green circles, 33,004 ± 1 Da), deglycosylated ACKR1 (blue circles, 37,022 ± 1 Da), and partially hydrolyzed deglycosylated ACKR1 (light blue circles, 36,411 ± 1 Da). Complexes formed between HlgA and both forms of deglycosylated ACKR1 are labeled with dark and clear red stars (70,029 ± 2 Da and 69,421 ± 7 Da, respectively). (B) Scheme explaining TR-FRET competitive binding assay (Top) and dose–response curves showing the decrease in the TR-FRET ratio between ACKR1 and d2-CCL5 upon addition of HlgA, HlgB, and HlgAB equimolar mixture (Bottom). Data shown are the mean ± SEM of one experiment performed in triplicate and are representative of three independent experiments. Hill slope values: HlgA, −1.1 ± 0.08; HlgB, −2.0 ± 0.34; HlgAB, −2.1 ± 0.29. IC50 values: HlgA, 577 ± 93 nM; HlgB, 376 ± 105 nM; HlgAB, 6.2 ± 2.7 nM. Values represents the average ± SD of three independent experiments performed in triplicate.
Fig. 3.
Fig. 3.
ACKR1 conformational changes upon binding to leukotoxins probed by HDX. HDX results showing statistically significant ΔHDX regions from all biological replicates color coded onto the snake plot of ACKR1 adapted from GPCRdb as well as on the structural model generated for ACKR1 in which the long N-terminal domain is missing (c.f. Materials and Methods). Blue: protected regions; gray: regions with no statistically significant ΔHDX; and white: regions with no HDX data. Deuterium uptake of selected peptides is shown for the apo receptor (black) and the receptor bound to HlgA (green) or to HlgB (yellow). Uptake plot data are the average and SD for timepoints from n = 3 replicate measurements for one biological preparation of ACKR1.
Fig. 4.
Fig. 4.
HlgB and HlgAB interfere with preassembled ACKR1−Gαi1 complexes in living cells. (A) Scheme explaining the BRET assay used to probe ACKR1−Gα interactions. (B) Net BRET assay between ACKR1-YFP and Gαi1-RLuc showing that CCL5 and HlgA have no specific effect on ACKR1−Gαi1 interactions at the tested concentrations, whereas adding HlgB or HlgAB resulted in the dissociation of ACKR1−Gαi1 complexes in living cells. EC50 was 796 ± 110 nM for HlgB and 13.5 ± 3.2 nM for HlgAB. (C) Net BRET assay showing the effect of the HlgAB mixture on ACKR1−Gαi1 interactions for WT, Y30F, and Y41F ACKR1. Effect of HlgAB on the dissociation between ACKR1 and Gαi1 decreased when mutating Y41, evidenced by an EC50 increase up to 106 ± 42 nM, whereas the EC50 did not change significantly when mutating Y30 (21.7 ± 5.3 nM). Cell-based assays data shown are the mean ± SEM of one experiment performed in triplicate and are representative of three independent experiments. Reference SI Appendix, Fig. S7 for additional data.
Fig. 5.
Fig. 5.
Effect of leukotoxins on ACKR1−ACKR1 interactions in living cells. (A) BRET assay showing receptor−receptor interactions at the carboxyl-terminal intracellular side of ACKR1. A constitutive BRET signal is visible prior to adding the different ligands. Adding HlgA (green) does not affect the BRET signal at the tested conditions, whereas HlgB (yellow) and equimolar mixture of HlgAB (orange) induced an increased BRET. Average EC50 of all independent experiments was: 178 ± 28 nM in the presence of HlgB and 18.6 ± 2.5 nM in the presence of HlgAB. (B) TR-FRET showing receptor−receptor interactions at the N-terminal extracellular side of ACKR1. A constitutive TR-FRET signal is visible prior to adding the different ligands. Adding HlgA (green) does not affect the TR-FRET at the tested conditions, whereas HlgB (yellow) and equimolar mixture of HlgAB (orange) induced a decreased TR-FRET. Average EC50 of all independent experiments was 429 ± 138 nM in the presence of HlgB and 47 ± 15 nM in the presence of HlgAB. ST, SNAP Tag. ACKR3 was used as control. All data shown are the mean ± SEM of one experiment performed in triplicate and are representative of at least three independent experiments.
Fig. 6.
Fig. 6.
Proposed first steps of pore formation by HlgAB. ACKR1 (blue) is present in both monomeric and dimeric forms in cellular membranes. Soluble HlgA (green) and HlgB (olive) secreted by SA can be present in monomeric and dimeric forms. Both leukotoxins recognize the cellular membrane by specific interactions with ACKR1, and interaction of each toxin with ACKR1 will lead to conformational changes at both N and carboxyl termini of the GPCR. HlgB homodimers and HlgAB heterodimers could interfere with receptor−receptor interactions, but only the HlgAB−(ACKR1)2 complex will lead to the formation of the pore.

References

    1. Turner N. A., et al. ., Methicillin-resistant Staphylococcus aureus: An overview of basic and clinical research. Nat. Rev. Microbiol. 17, 203–218 (2019). - PMC - PubMed
    1. Foster T. J., The Staphylococcus aureus “superbug”. J. Clin. Invest. 114, 1693–1696 (2004). - PMC - PubMed
    1. Assis L. M., Nedeljković M., Dessen A., New strategies for targeting and treatment of multi-drug resistant Staphylococcus aureus. Drug Resist. Updat. 31, 1–14 (2017). - PubMed
    1. Kong C., Neoh H. M., Nathan S., Targeting Staphylococcus aureus toxins: A potential form of anti-virulence therapy. Toxins (Basel) 8, 72 (2016). - PMC - PubMed
    1. Seilie E. S., Bubeck Wardenburg J., Staphylococcus aureus pore-forming toxins: The interface of pathogen and host complexity. Semin. Cell Dev. Biol. 72, 101–116 (2017). - PMC - PubMed

Publication types

MeSH terms

LinkOut - more resources