. 2021 Nov 1;66(21):10.1088/1361-6560/ac30a0.
doi: 10.1088/1361-6560/ac30a0.

Noise2Void: unsupervised denoising of PET images

Affiliations

Noise2Void: unsupervised denoising of PET images

Tzu-An Song et al. Phys Med Biol. .

Abstract

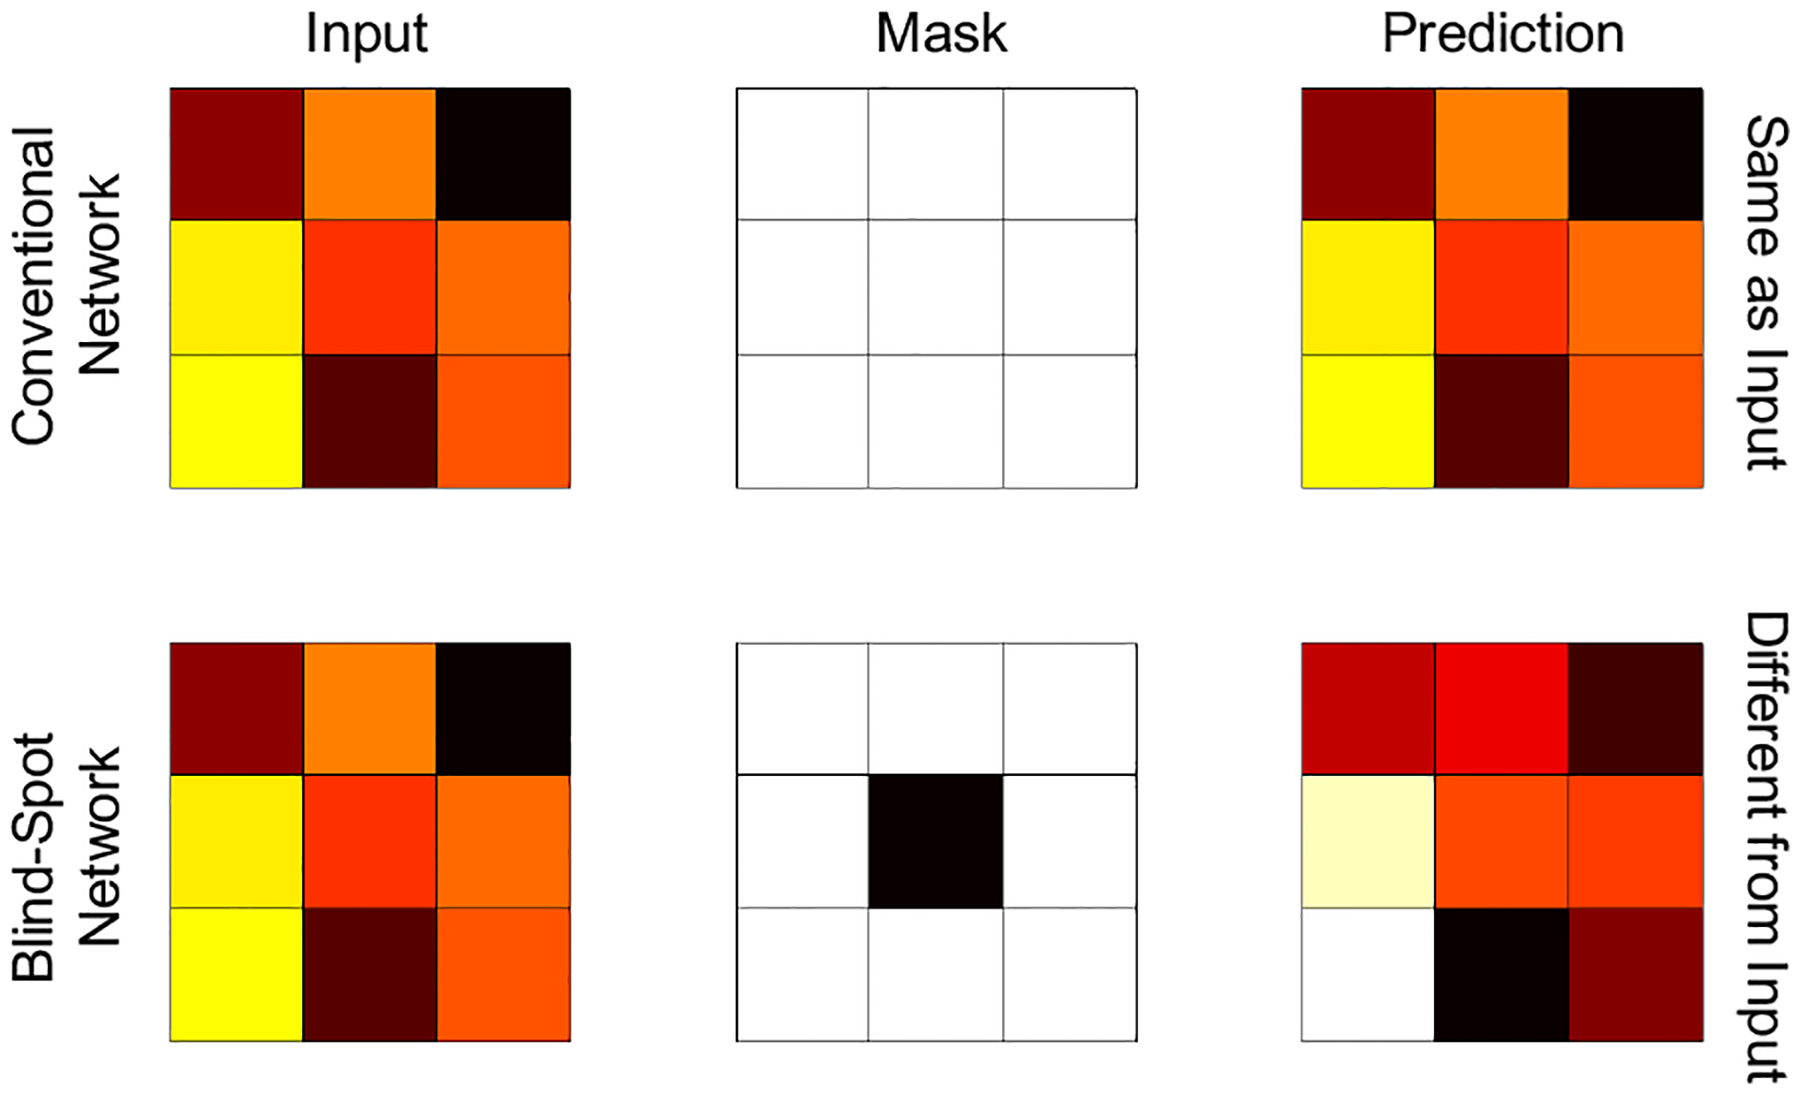
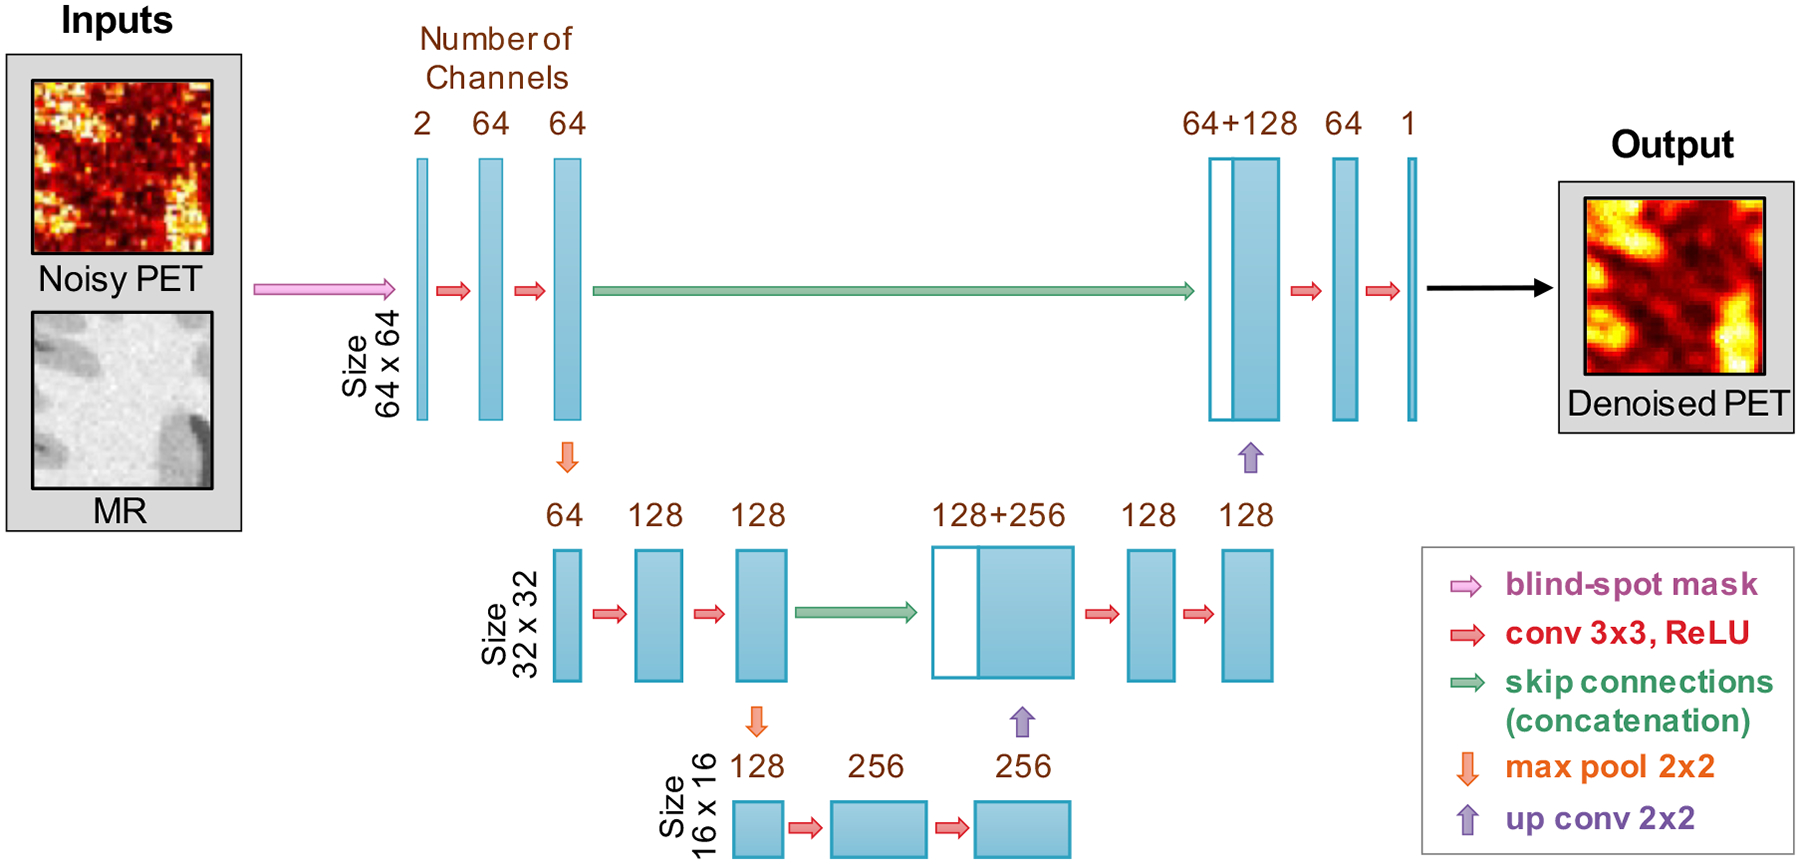
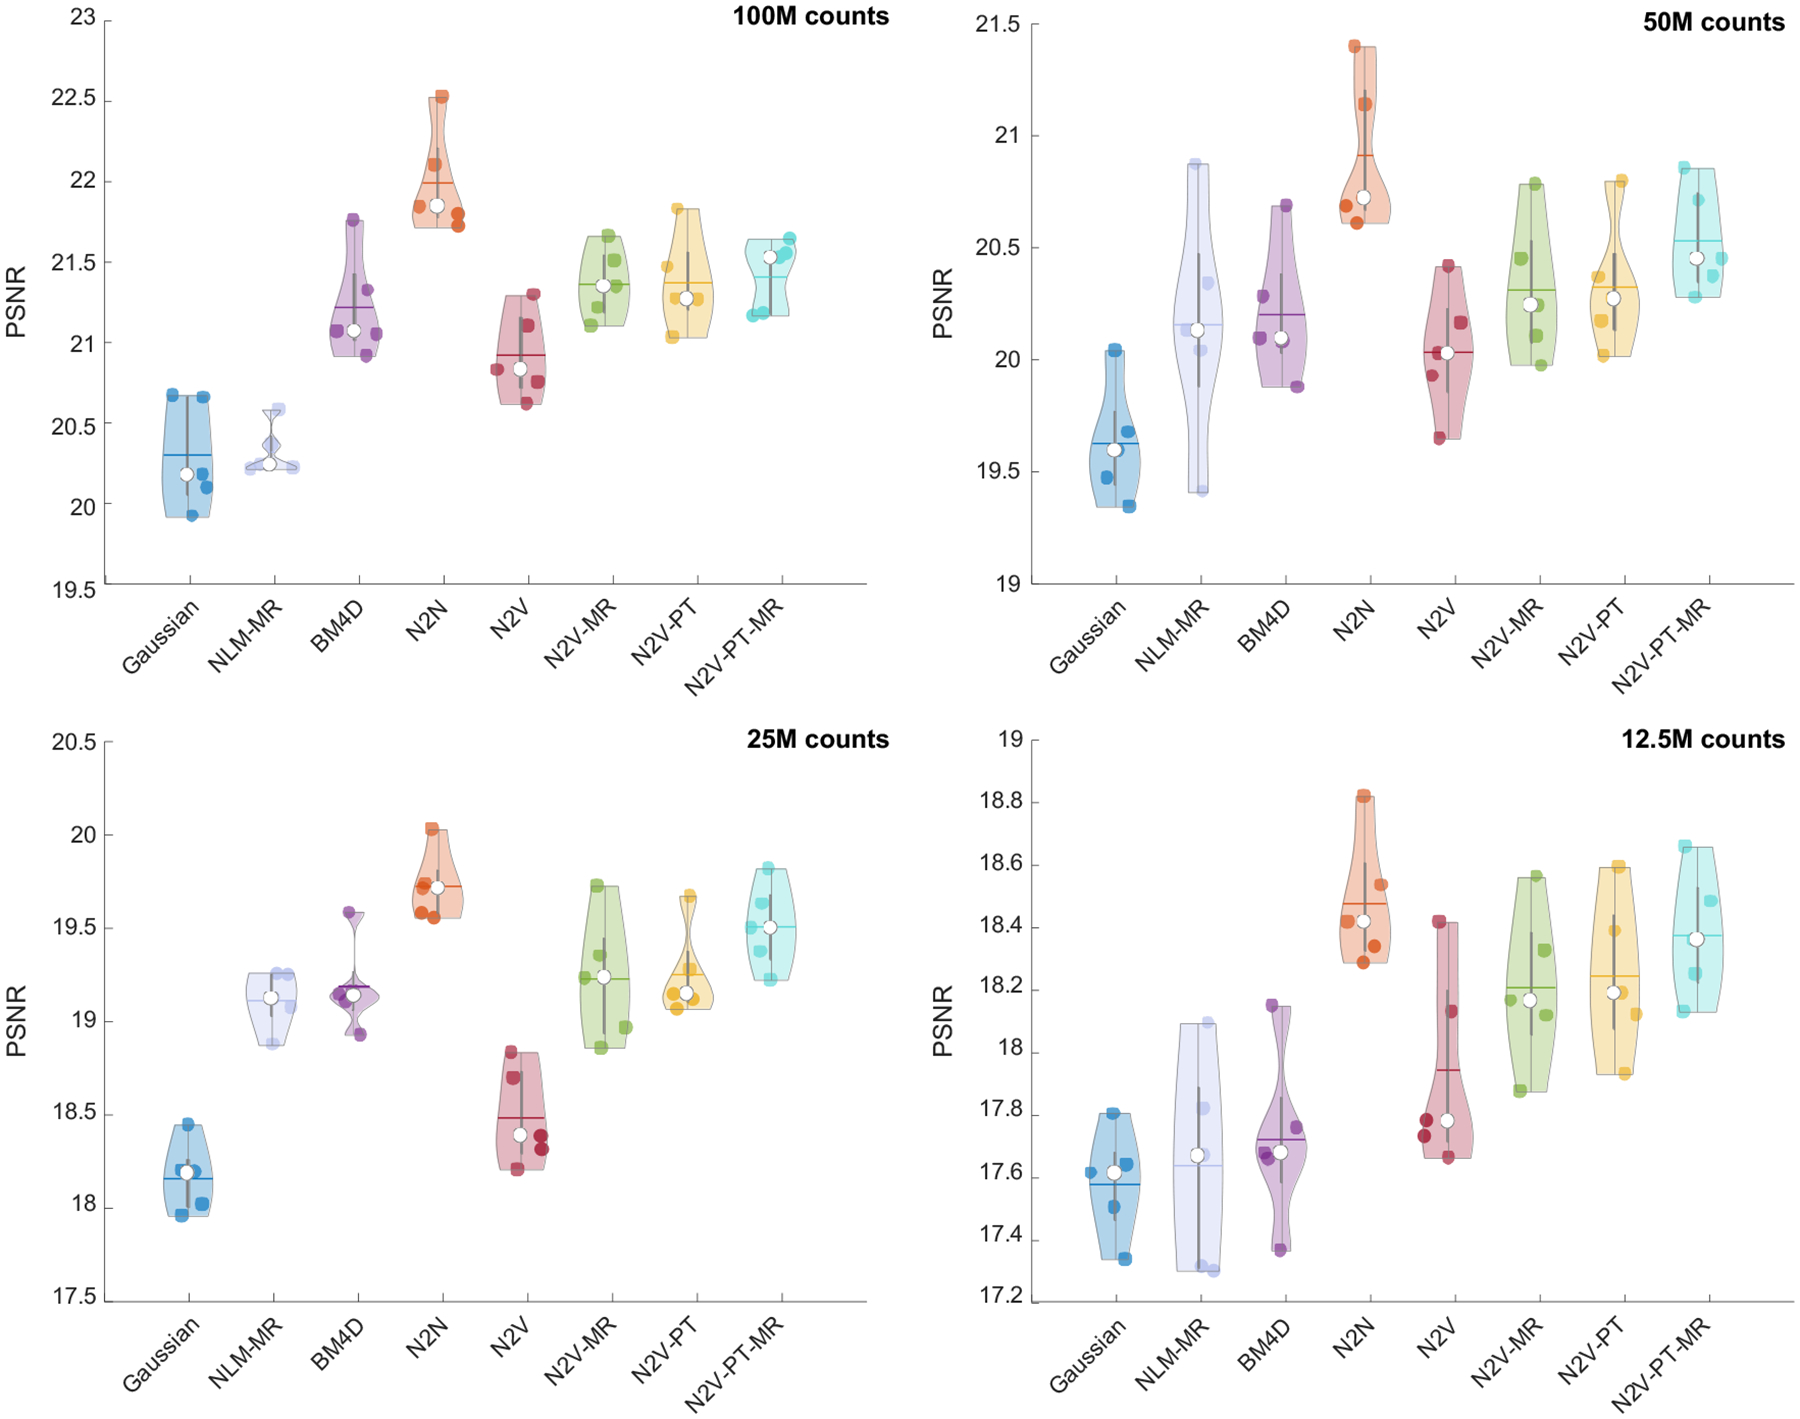
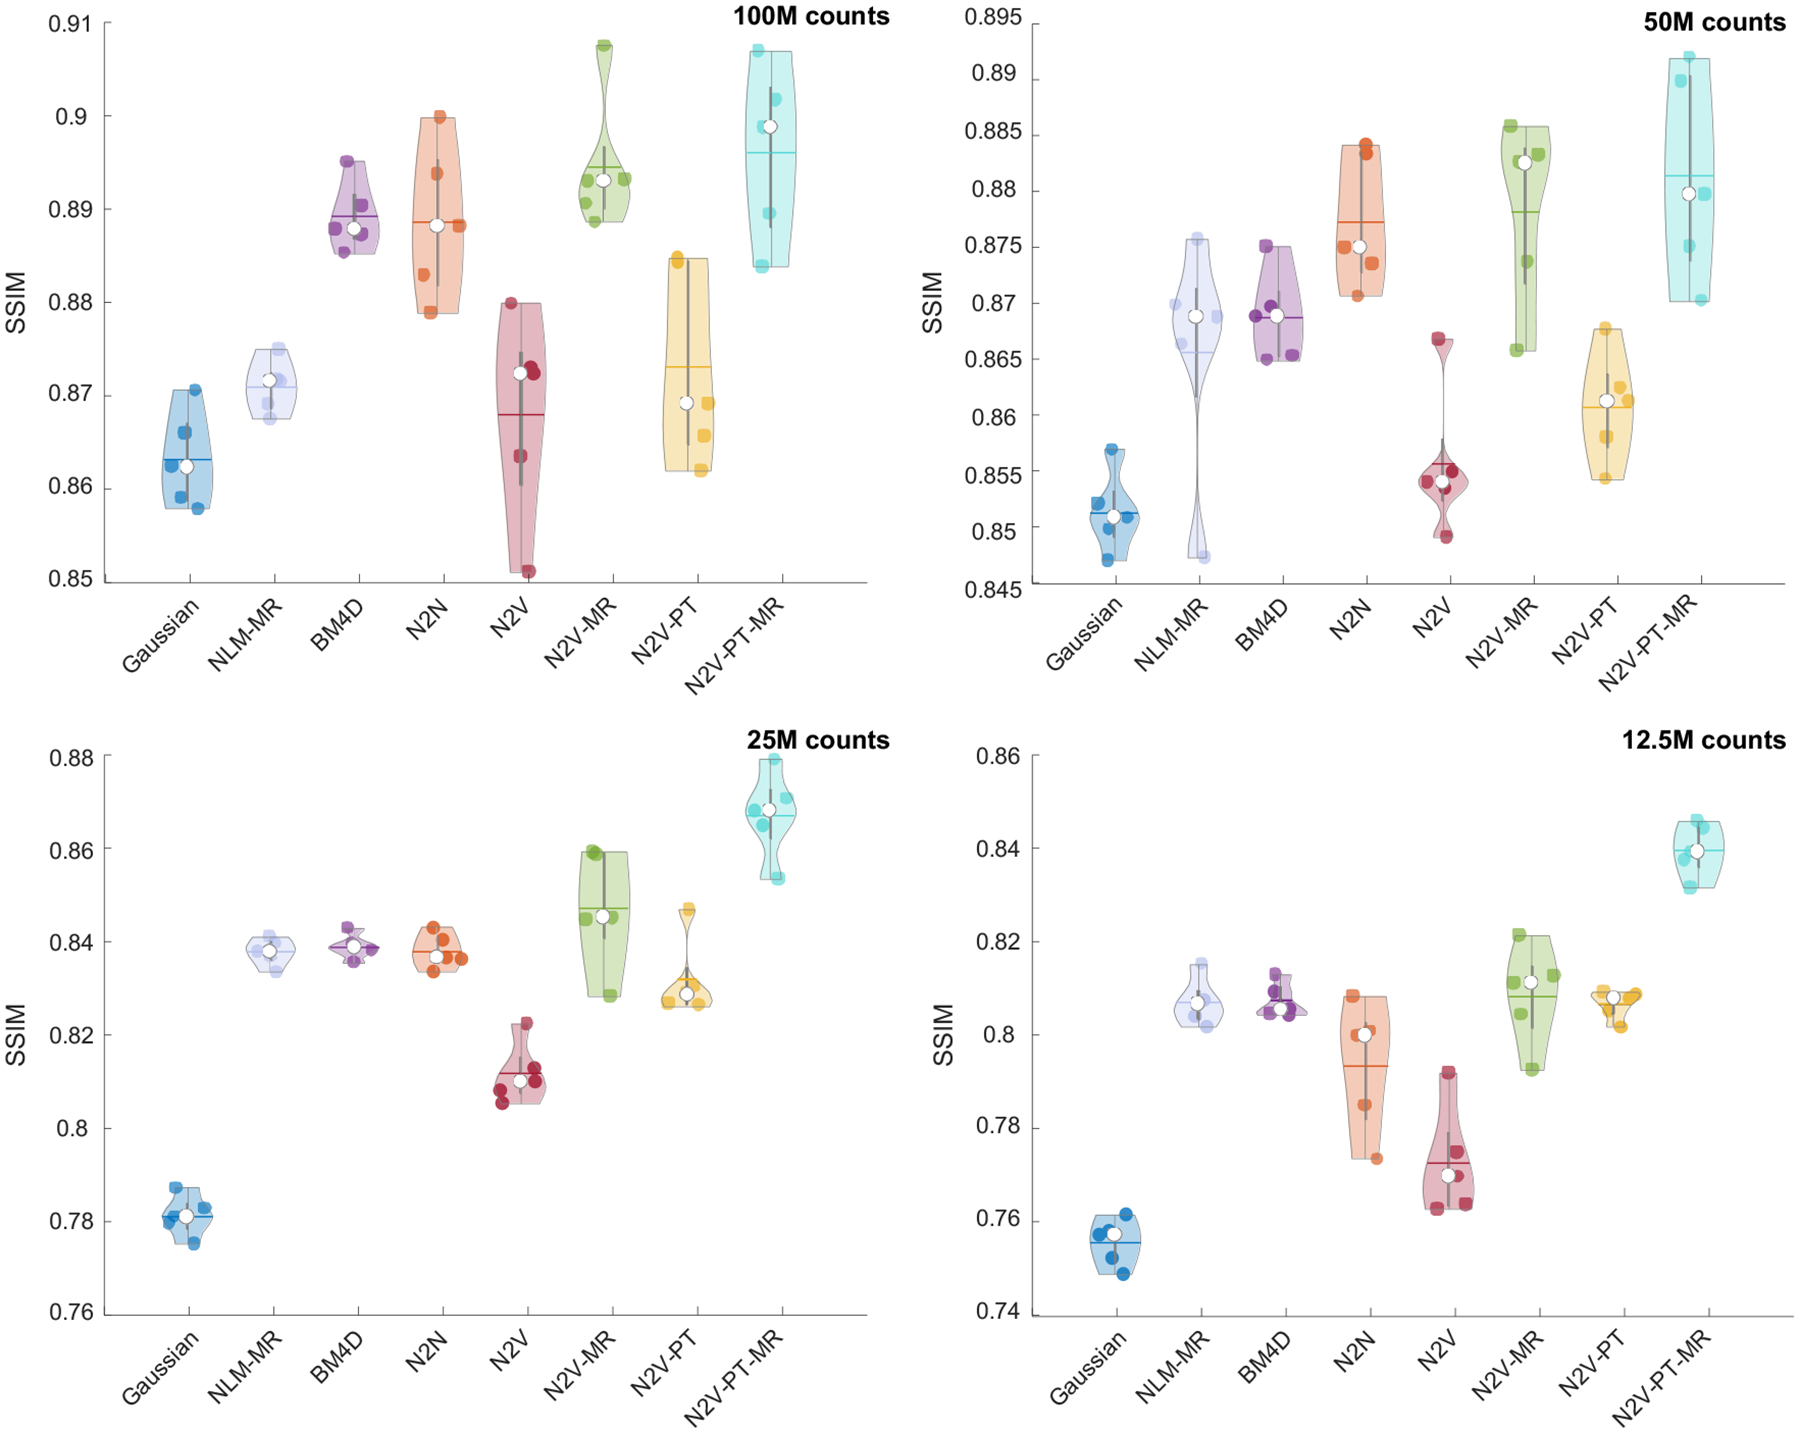
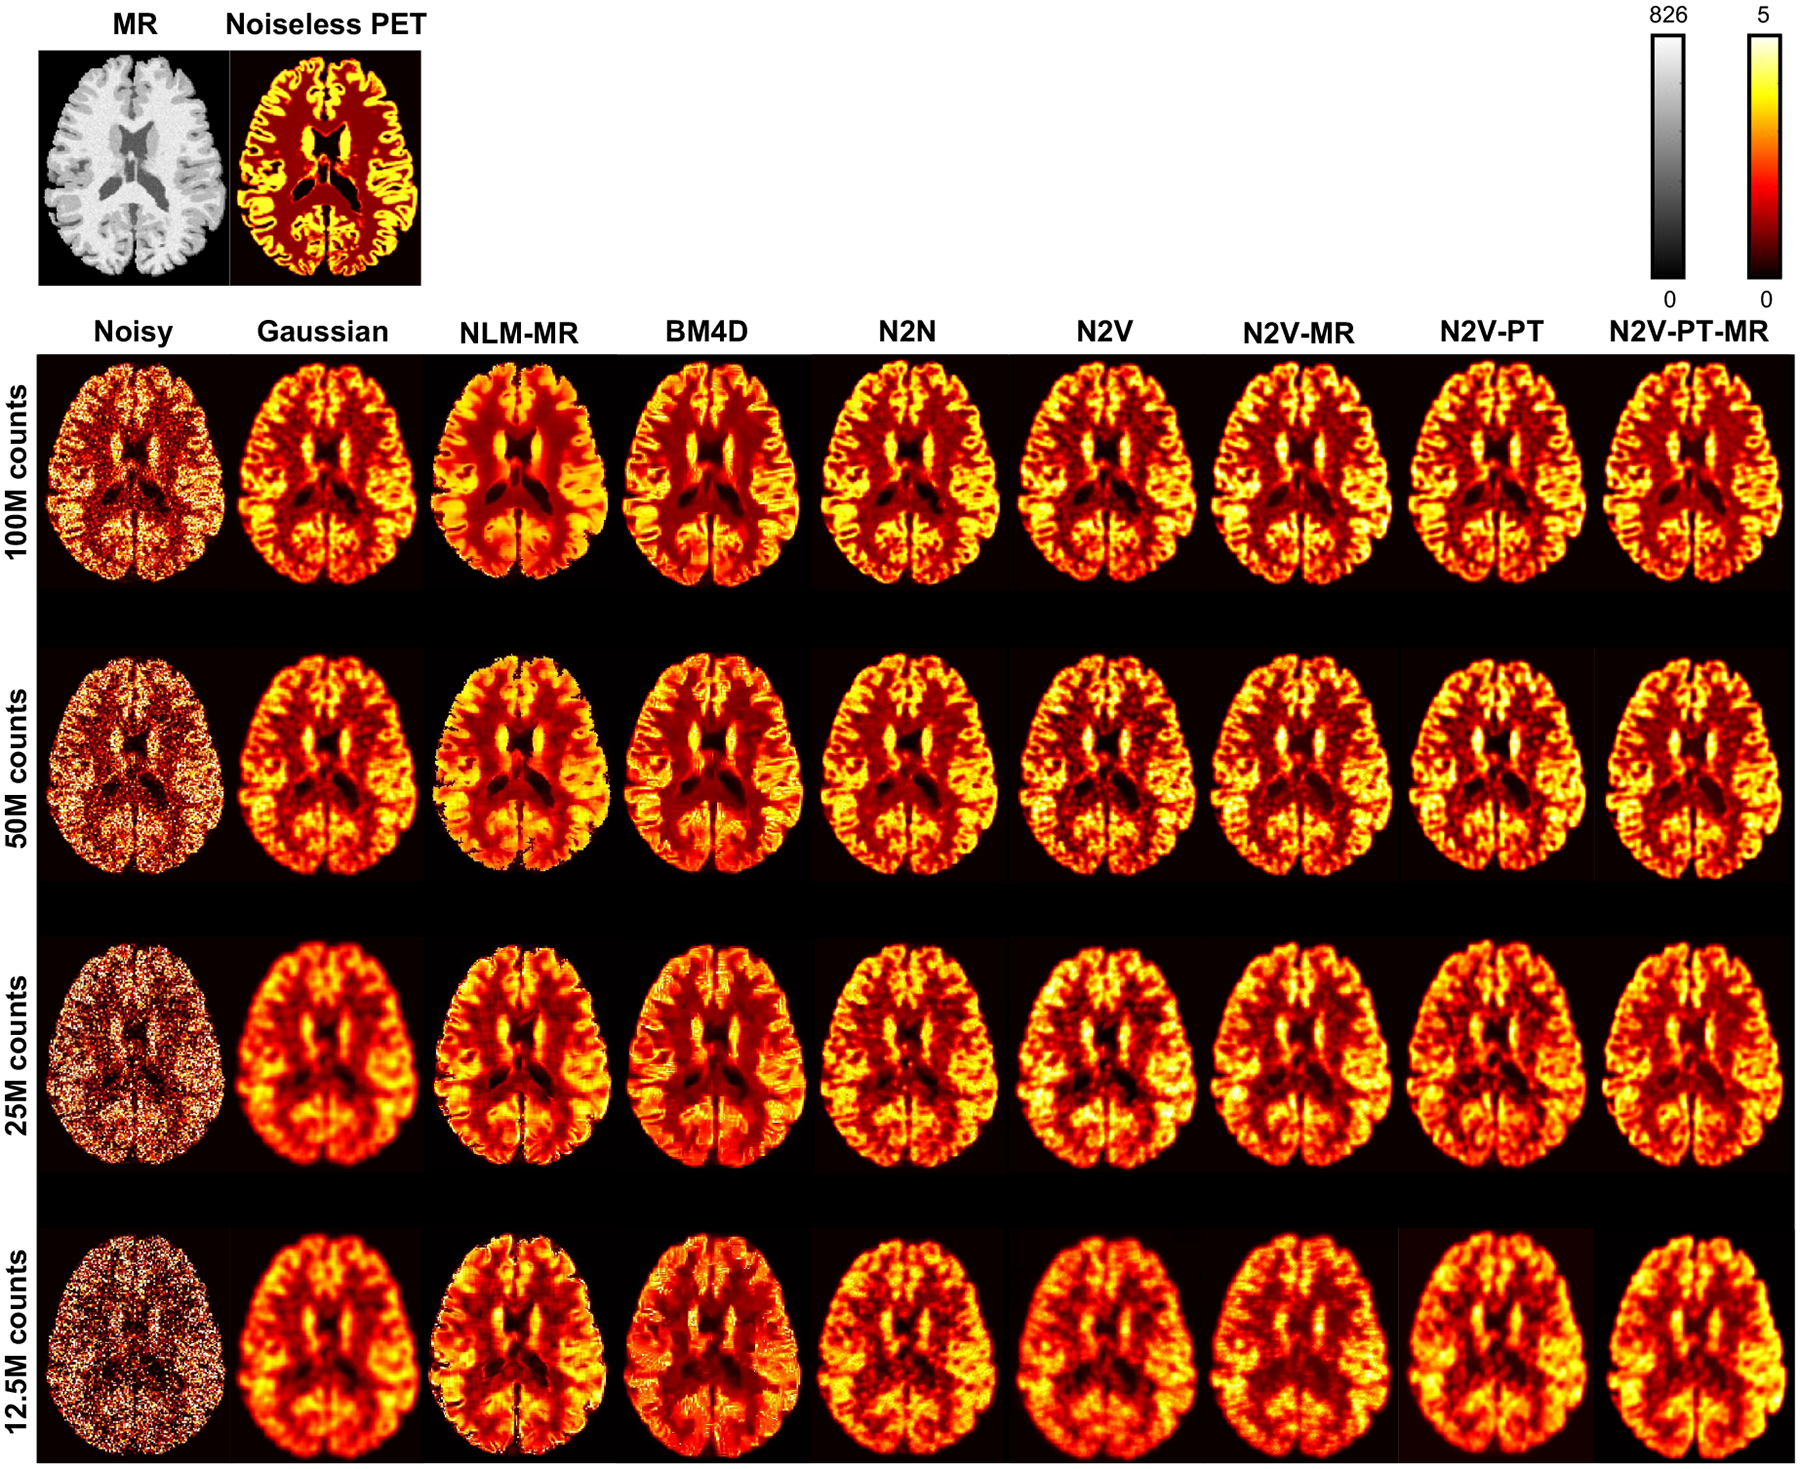
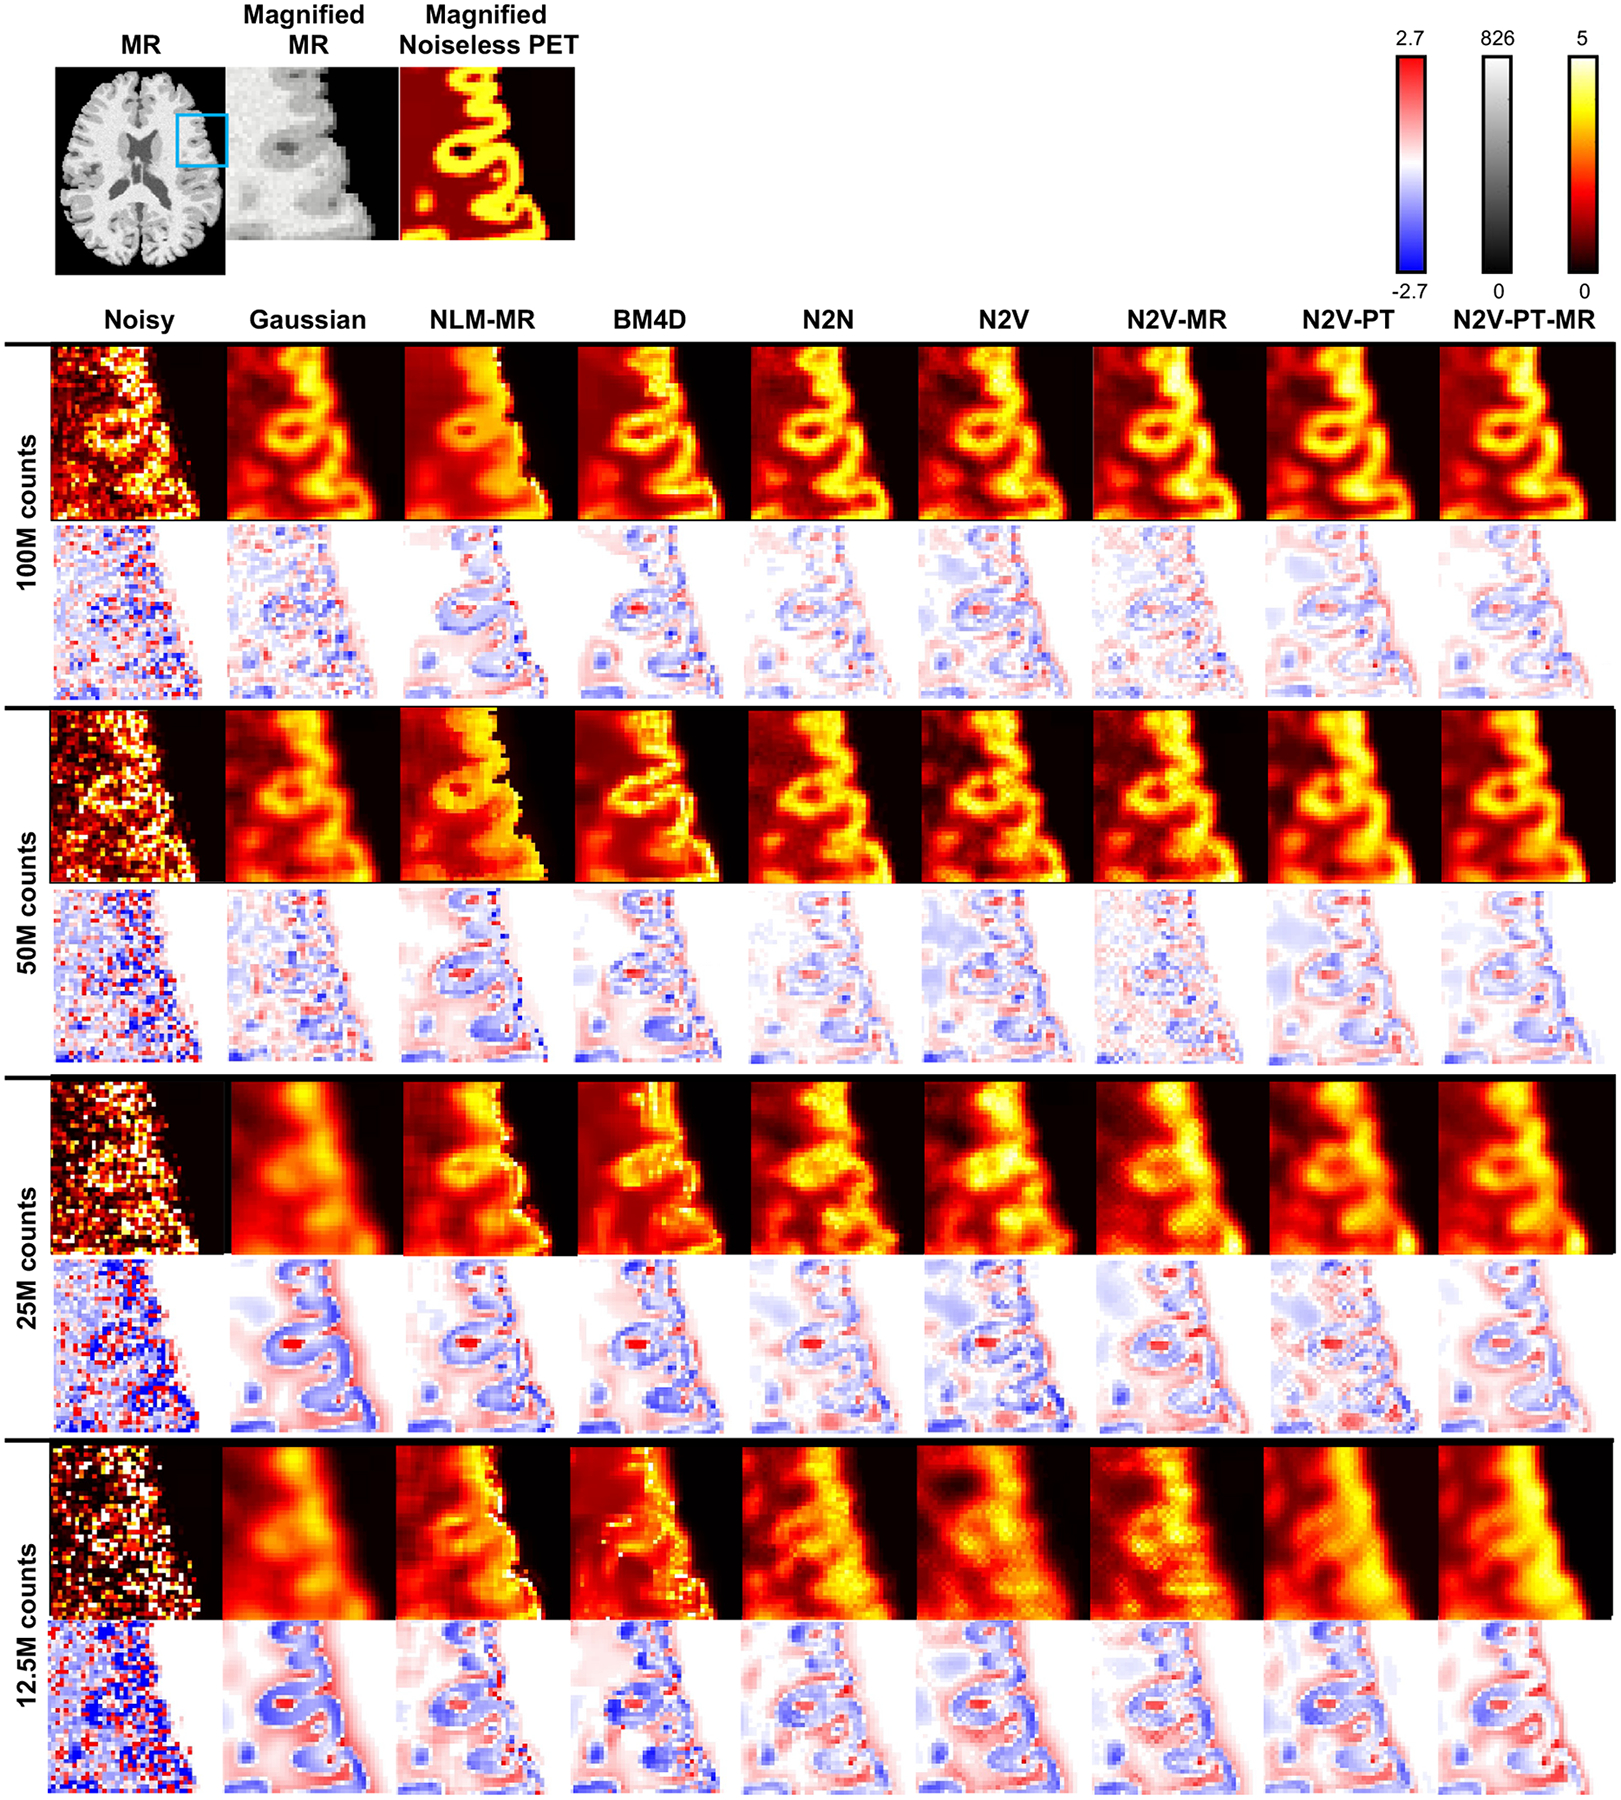
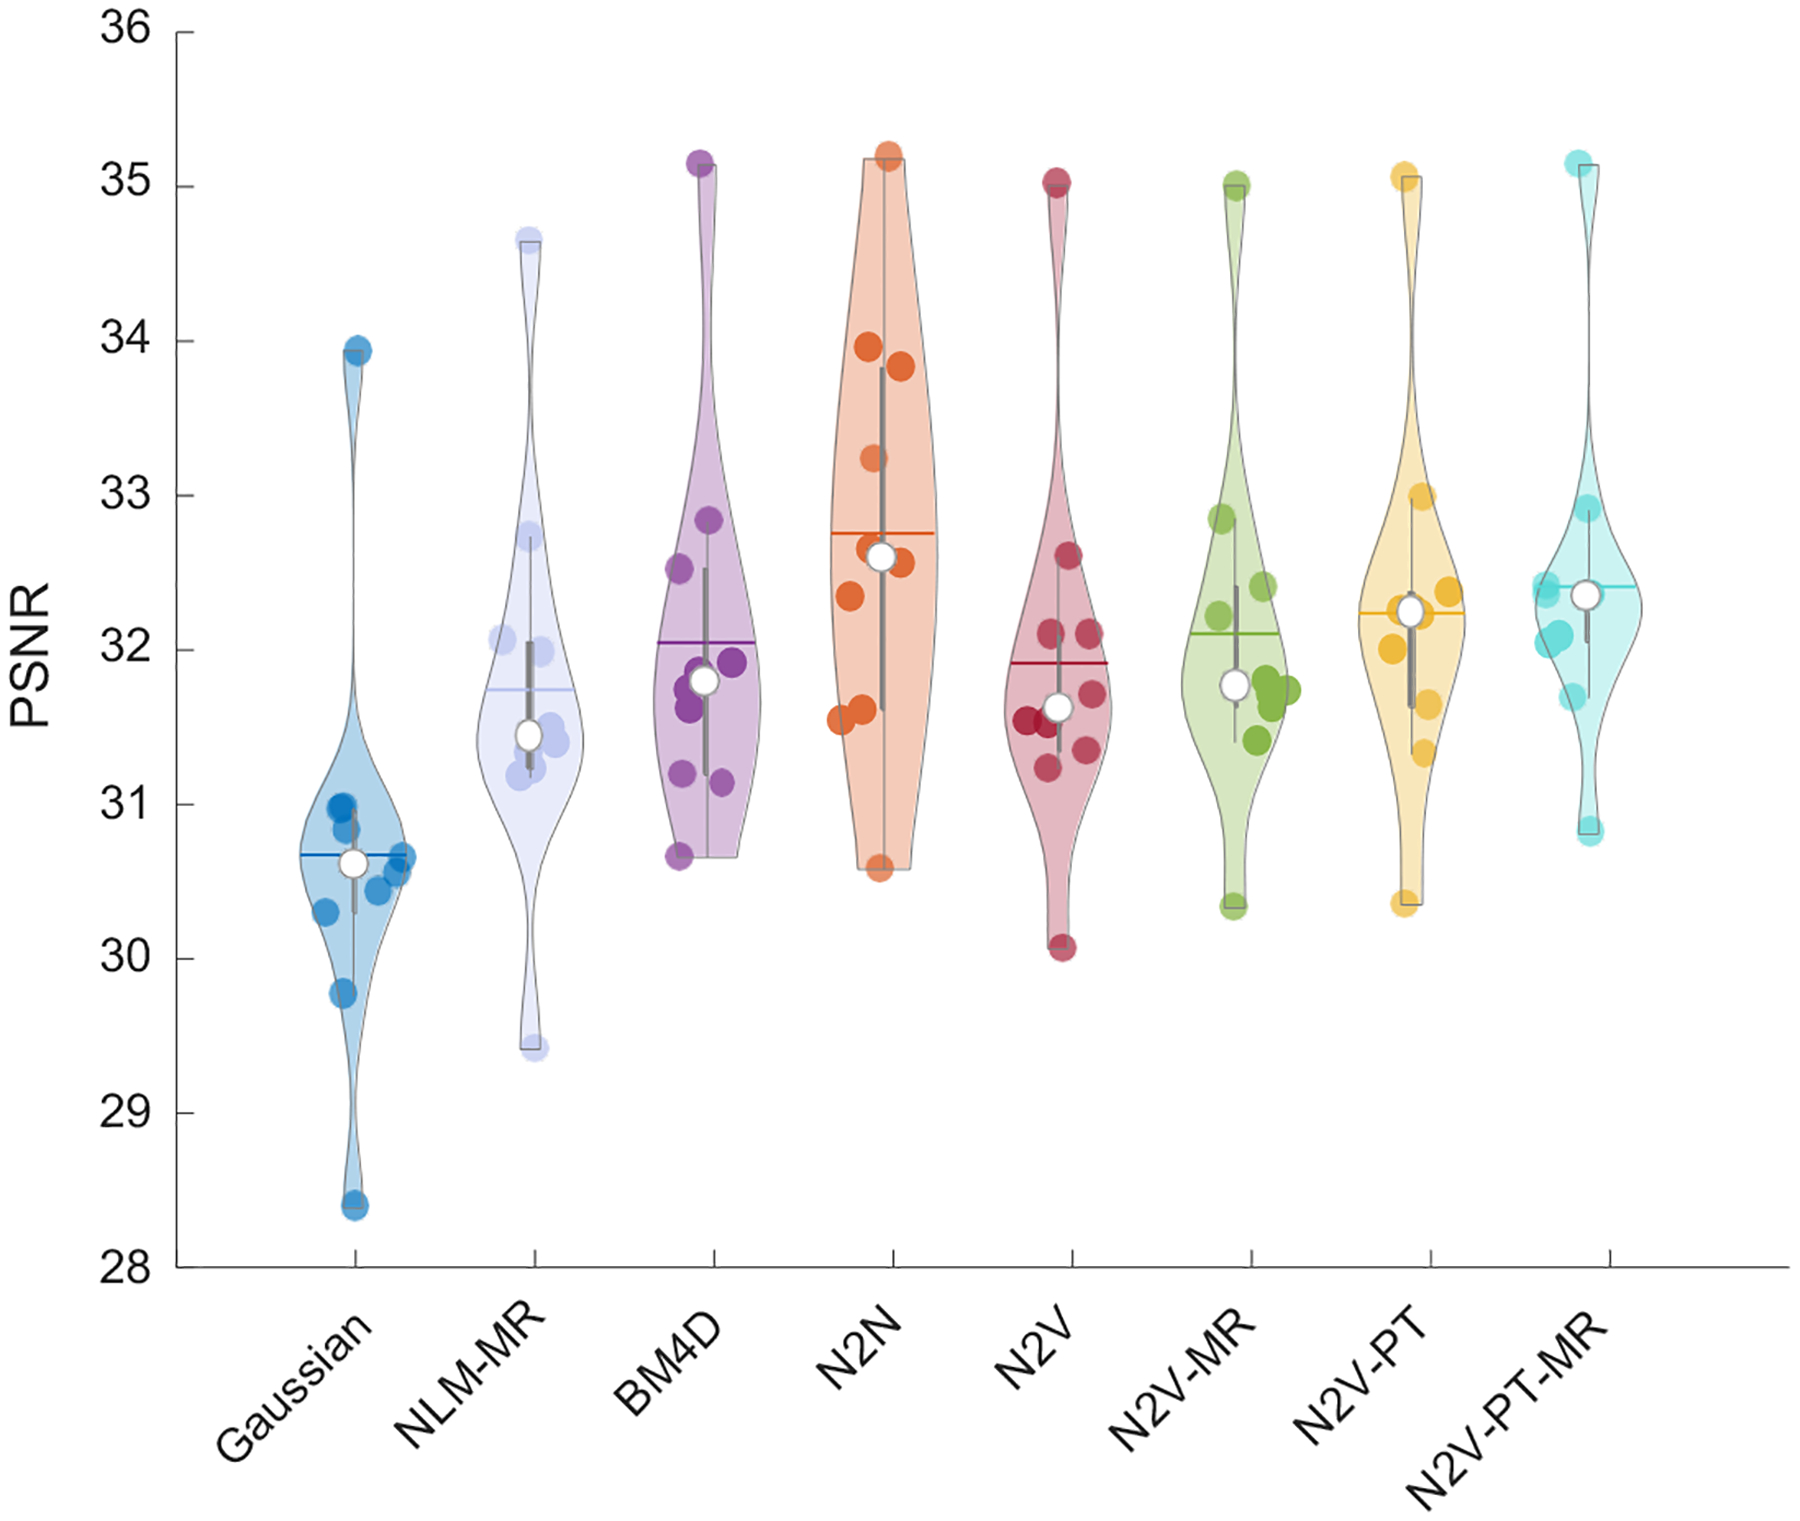
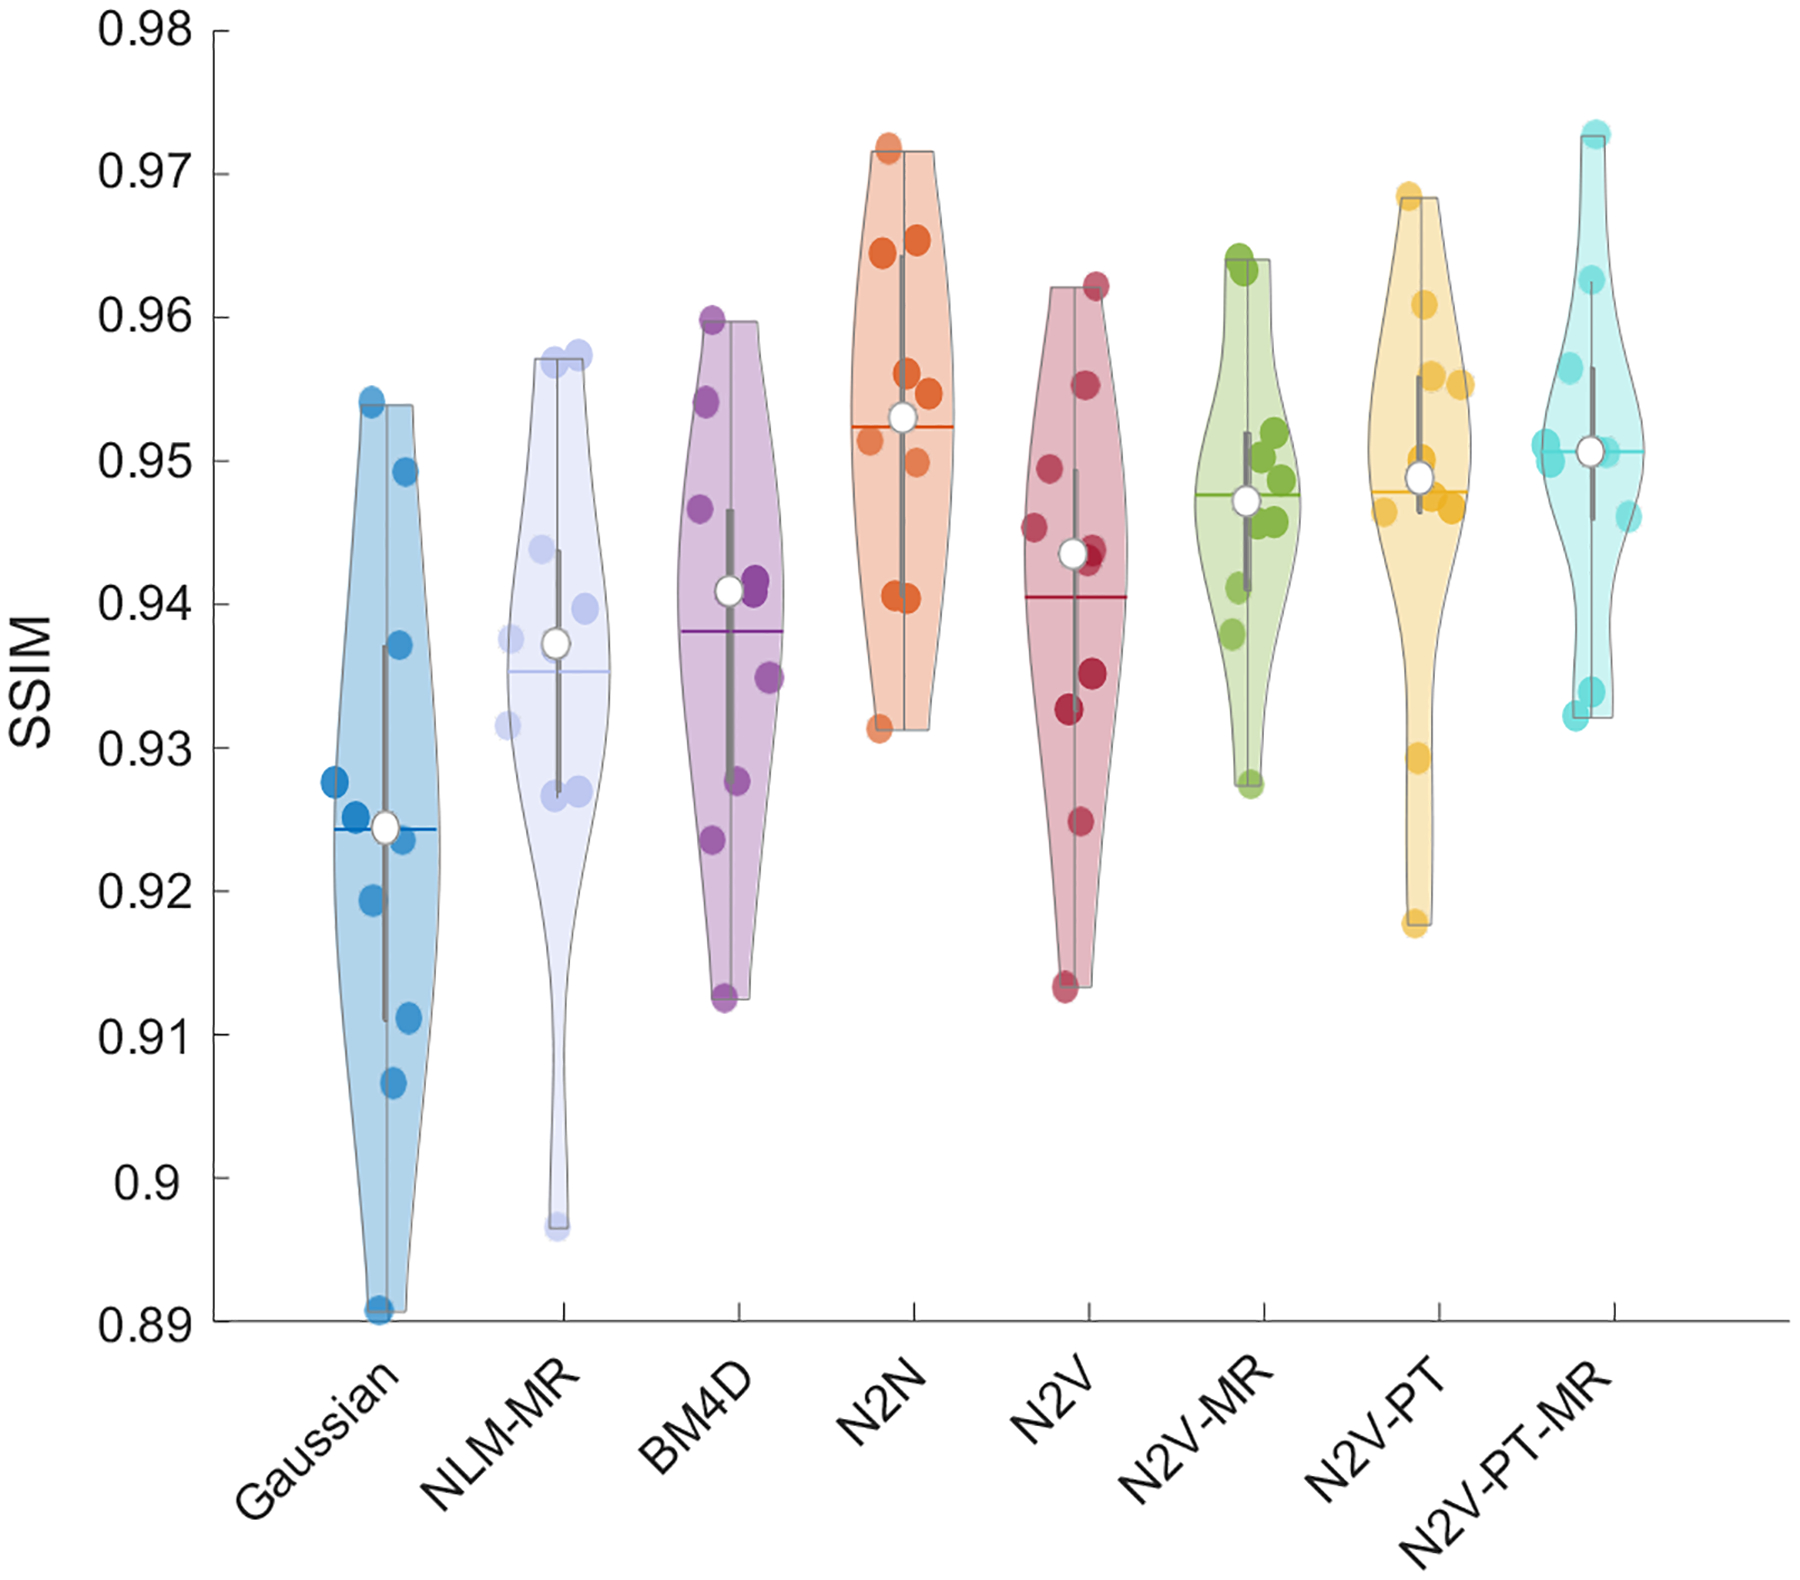
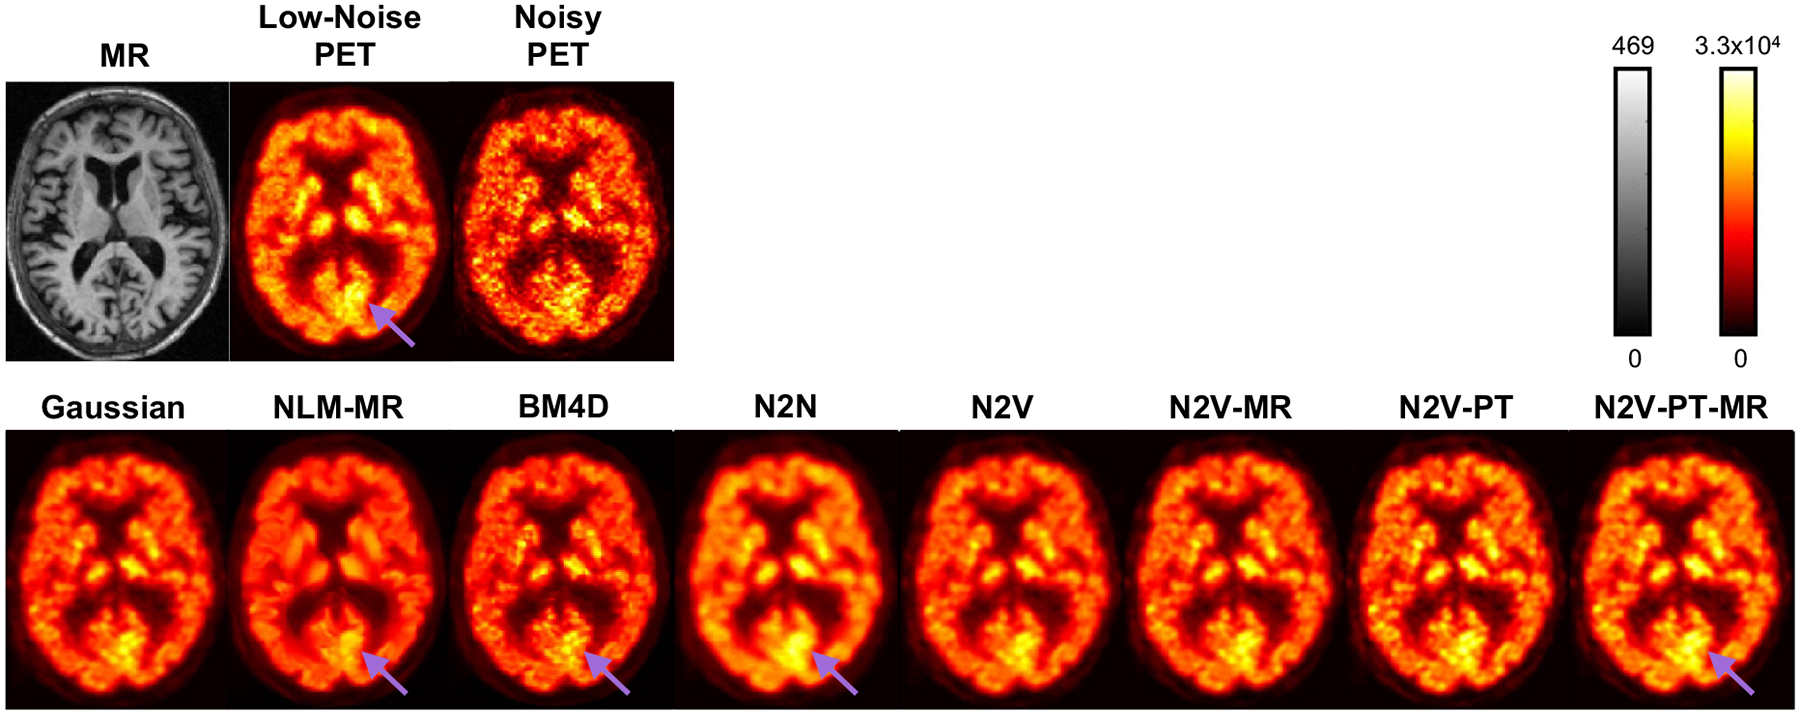
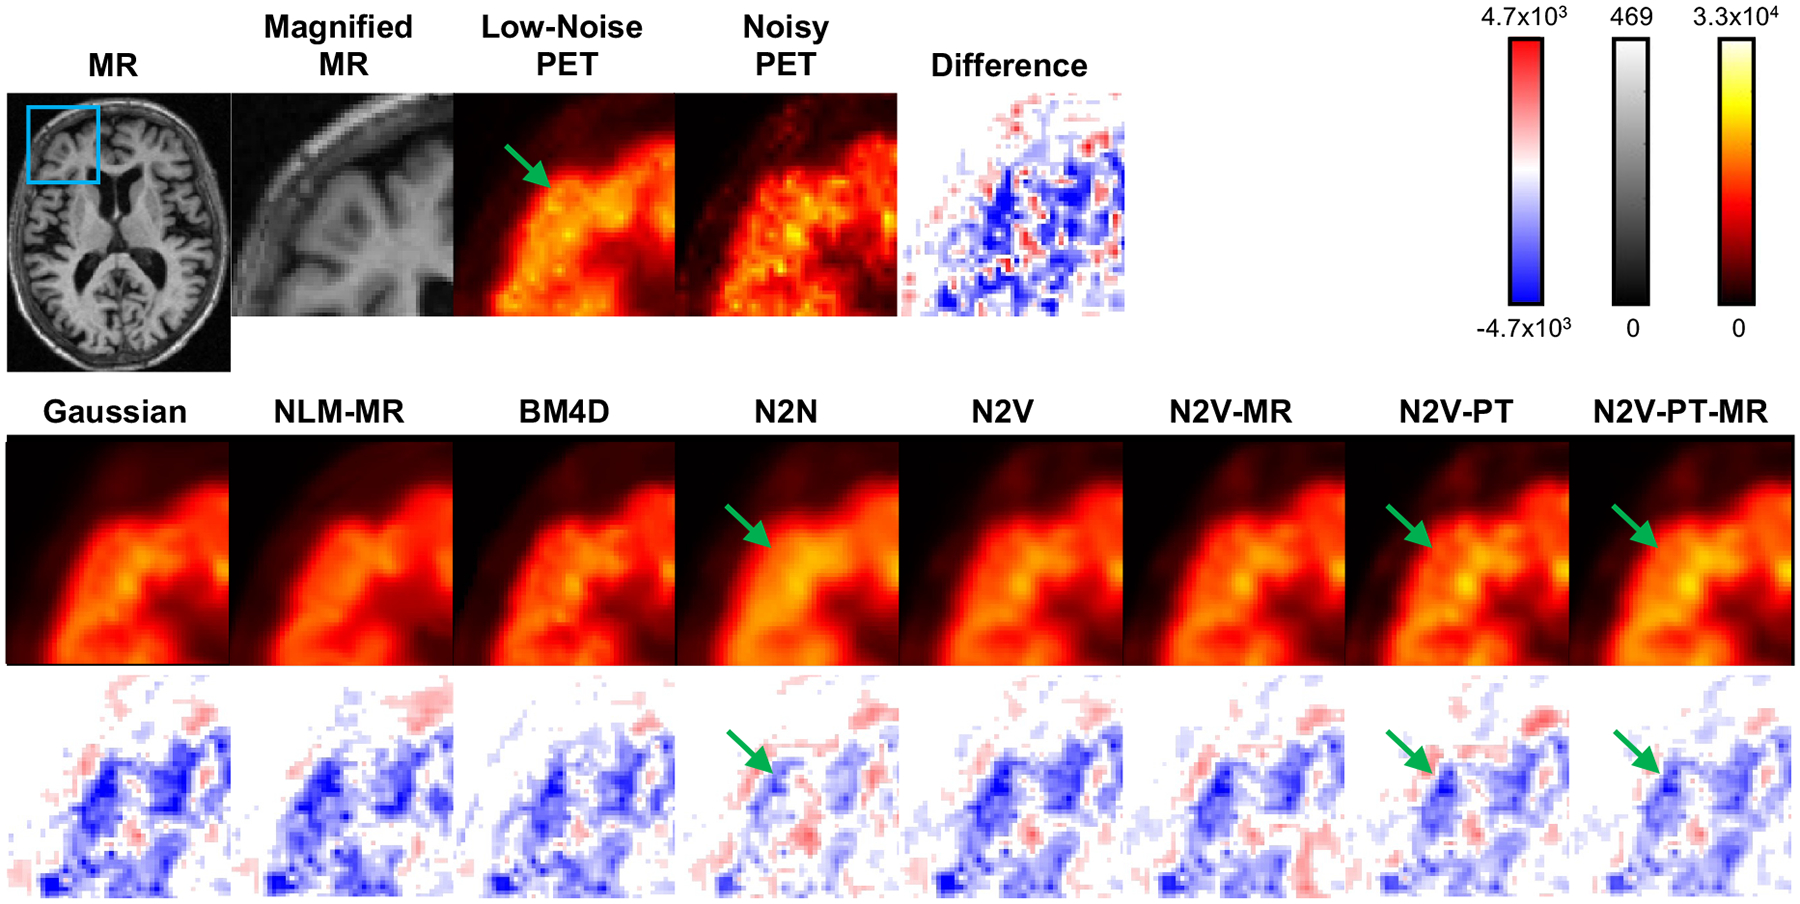
Objective:Elevated noise levels in positron emission tomography (PET) images lower image quality and quantitative accuracy and are a confounding factor for clinical interpretation. The objective of this paper is to develop a PET image denoising technique based on unsupervised deep learning.Significance:Recent advances in deep learning have ushered in a wide array of novel denoising techniques, several of which have been successfully adapted for PET image reconstruction and post-processing. The bulk of the deep learning research so far has focused on supervised learning schemes, which, for the image denoising problem, require paired noisy and noiseless/low-noise images. This requirement tends to limit the utility of these methods for medical applications as paired training datasets are not always available. Furthermore, to achieve the best-case performance of these methods, it is essential that the datasets for training and subsequent real-world application have consistent image characteristics (e.g. noise, resolution, etc), which is rarely the case for clinical data. To circumvent these challenges, it is critical to develop unsupervised techniques that obviate the need for paired training data.Approach:In this paper, we have adapted Noise2Void, a technique that relies on corrupt images alone for model training, for PET image denoising and assessed its performance using PET neuroimaging data. Noise2Void is an unsupervised approach that uses a blind-spot network design. It requires only a single noisy image as its input, and, therefore, is well-suited for clinical settings. During the training phase, a single noisy PET image serves as both the input and the target. Here we present a modified version of Noise2Void based on a transfer learning paradigm that involves group-level pretraining followed by individual fine-tuning. Furthermore, we investigate the impact of incorporating an anatomical image as a second input to the network.Main Results:We validated our denoising technique using simulation data based on the BrainWeb digital phantom. We show that Noise2Void with pretraining and/or anatomical guidance leads to higher peak signal-to-noise ratios than traditional denoising schemes such as Gaussian filtering, anatomically guided non-local means filtering, and block-matching and 4D filtering. We used the Noise2Noise denoising technique as an additional benchmark. For clinical validation, we applied this method to human brain imaging datasets. The clinical findings were consistent with the simulation results confirming the translational value of Noise2Void as a denoising tool.

Keywords: PET; deep learning; denoising; unsupervised learning.


Figures

Figure 1.
Figure 1.. The blind spot concept.
Unlike a conventional network, a blind-spot network has a masked receptive field that excludes the central pixel and can learn to suppress noise by focusing on the neighboring pixels. Thus, it can generate a prediction distinct from the input even when the input and target images are identical and noisy.
Figure 2.
Figure 2.. Network architecture.
A U-Net network with a blind-spot mask applied to the input is used here for N2V denoising. Each convolutional layer is followed by a ReLU activation function, except for the last layer.
Figure 3.
Figure 3.. PSNR comparison for the simulation data.
Violin plots showing the PSNR distributions for the PET images obtained using Gaussian, NLM-MR, BM4D, N2N, N2V, N2V-MR, N2V-PT, and N2V-PT-MR denoising. The results are shown for four different noise levels: 100M counts, 50M counts, 25M counts, and 12.5M counts.
Figure 4.
Figure 4.. SSIM comparison for the simulation data.
Violin plots showing the SSIM distributions for the PET images obtained using Gaussian, NLM-MR, BM4D, N2N, N2V, N2V-MR, N2V-PT, and N2V-PT-MR denoising. The results are shown for four different noise levels: 100M counts, 50M counts, 25M counts, and 12.5M counts.
Figure 5.
Figure 5.. Example image slices for the simulation data.
Transverse image slices from the MR and the true (noiseless) PET are shown on the top. The noisy PET images and denoised PET images based on Gaussian, NLM-MR, BM4D, N2N, N2V, N2V-MR, N2V-PT, and N2V-PT-MR are shown for four different noise levels: 100M, 50M, 25M, and 12.5M counts. The cases visualized here have PSNR values close to the mean PSNR and correspond to the datapoints indicated as circles with a white fill in Figure 3.
Figure 6.
Figure 6.. Magnified image slices and difference image slices for the simulation data.
Transverse image slices from the full MR image, the magnified MR subimage, and the magnified true (noiseless) PET subimage are shown on the top row. The blue box on the full MR image indicates the region magnified for closer inspection. The noisy and denoised PET subimages are shown using a “hot” colormap for Gaussian, NLM-MR, BM4D, N2N, N2V, N2V-MR, N2V-PT, and N2V-PT-MR methods and for four different noise levels: 100M, 50M, 25M, and 12.5M counts. The corresponding difference subimages (i.e., noisy - true or denoised - true) are displayed to underneath each image slice using a red-white-blue colormap.
Figure 7.
Figure 7.. PSNR comparison for the clinical data.
Violin plots showing the PSNR distributions for the PET images obtained using Gaussian, NLM-MR, BM4D, N2N, N2V, N2V-MR, N2V-PT, and N2V-PT-MR denoising.
Figure 8.
Figure 8.. SSIM comparison for the clinical data.
Violin plots showing the SSIM distributions for the PET images obtained using Gaussian, NLM-MR, BM4D, N2N, N2V, N2V-MR, N2V-PT, and N2V-PT-MR denoising.
Figure 9.
Figure 9.. Example image slices for the clinical data.
Transverse image slices from the MR, the noisy PET, and low-noise PET are shown in the top row. Transverse image slices from the denoised PET images based on the Gaussian, NLM-MR, BM4D, N2N, N2V, N2V-MR, N2V-PT, and N2V-PT-MR techniques are shown in the bottom row. The cases visualized here have PSNR values close to the mean PSNR and correspond to the datapoints indicated as circles with a white fill in Figure 7.
Figure 10.
Figure 10.. Magnified image slices and difference image slices for the clinical data.
Transverse image slices from the full MR image, the magnified MR subimage, the magnified low-noise PET subimage, the magnified noisy PET subimage, and the magnified noisy PET difference subimage are shown in the top row. The blue box on the full MR image indicates the region magnified for closer inspection. Transverse image slices from the denoised PET images based on the Gaussian, NLM-MR, BM4D, N2N, N2V, N2V-MR, N2V-PT, and N2V-PT-MR techniques are shown using a “hot” colormap in the middle row. The corresponding difference subimages (i.e., denoised - true) are displayed underneath each image slice using a red-white-blue colormap.

References

    1. Arabi H and Zaidi H 2020. Spatially guided nonlocal mean approach for denoising of PET images Med Phys 47(4), 1656–1669. - PubMed
    1. Bergmann S, Fox K, Rand A, McElvany K, Welch M, Markham J and Sobel B 1984. Quantification of regional myocardial blood flow in vivo with H215O Circulation 70(4), 724–733. - PubMed
    1. Boussion N, Cheze Le Rest C, Hatt M and Visvikis D 2009. Incorporation of wavelet-based denoising in iterative deconvolution for partial volume correction in whole-body PET imaging Eur J Nucl Med Mol Imaging 36(7), 1064–1075. - PubMed
    1. Buades A, Coll B and Morel JM 2005. A non-local algorithm for image denoising in ‘Computer Vision and Pattern Recognition, IEEE Computer Society Conference on’ Vol. 2 pp. 60–65.
    1. Chan C, Fulton R, Barnett R, Feng DD and Meikle S 2014. Postreconstruction nonlocal means filtering of whole-body PET with an anatomical prior IEEE Trans Med Imaging 33(3), 636–650. - PubMed

Publication types

LinkOut - more resources