. 2021 Oct 18;12(11):959.
doi: 10.1038/s41419-021-04141-5.

Molecular and genomic characterisation of a panel of human anal cancer cell lines

Affiliations

Molecular and genomic characterisation of a panel of human anal cancer cell lines

Glen R Guerra et al. Cell Death Dis. .

Abstract

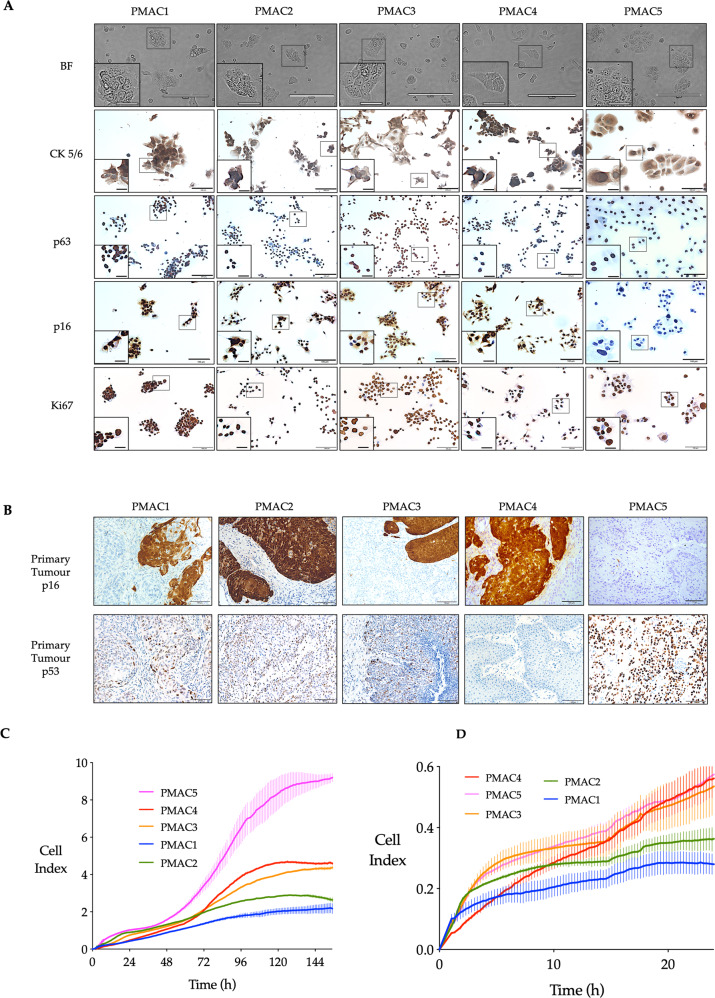
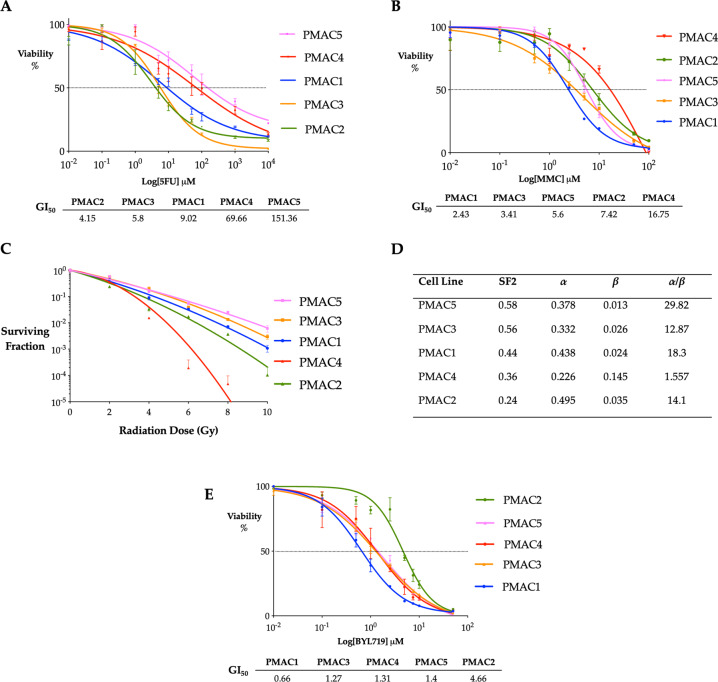
Anal cancer is a rare disease that has doubled in incidence over the last four decades. Current treatment and survival of patients with this disease has not changed substantially over this period of time, due, in part, to a paucity of preclinical models to assess new therapeutic options. To address this hiatus, we set-out to establish, validate and characterise a panel of human anal squamous cell carcinoma (ASCC) cell lines by employing an explant technique using fresh human ASCC tumour tissue. The panel of five human ASCC cell lines were validated to confirm their origin, squamous features and tumourigenicity, followed by molecular and genomic (whole-exome sequencing) characterisation. This panel recapitulates the genetic and molecular characteristics previously described in ASCC including phosphoinositide-3-kinase (PI3K) mutations in three of the human papillomavirus (HPV) positive lines and TP53 mutations in the HPV negative line. The cell lines demonstrate the ability to form tumouroids and retain their tumourigenic potential upon xenotransplantation, with varied inducible expression of major histocompatibility complex class I (MHC class I) and Programmed cell death ligand 1 (PD-L1). We observed differential responses to standard chemotherapy, radiotherapy and a PI3K specific molecular targeted agent in vitro, which correlated with the clinical response of the patient tumours from which they were derived. We anticipate this novel panel of human ASCC cell lines will form a valuable resource for future studies into the biology and therapeutics of this rare disease.


Conflict of interest statement

The authors declare no competing interests.

Figures

Fig. 1
Fig. 1. Characterisation of anal SCC cell lines in vitro.
A Brightfield photomicrographs (scale bar 200 μm; inset 50 μm) of the five human ASCC cell lines 48 h following seeding. Cells were then fixed with paraformaldehyde and permeabilised with Triton X before immunocytochemical staining for CK5/6, p63, p16 & Ki67 (scale bar 100 μm, inset 25 μm). B Immunohistochemical assessment of p16 and p53 expression in the parent human tumours from which the cell lines were derived (scale bar 100 μm). C Proliferation assay demonstrating the real time cell index recorded over a period of 150 h for each cell line seeded (PMAC1–3 (2 × 104 cells), PMAC4 and 5 (1 × 104 cells)) in RPMI 1640 + 10% FCS in an xCELLigence DTPA 16 well E-plate (Mean ± SEM depicted across each time point, n = 2, separate independent experiments in triplicate). D Migration assay towards 20% FCS from serum starved media, demonstrating the real time cell index recorded over a period of 24 h for each cell line seeded (PMAC1–3 (8 × 105 cells) PMAC4 and 5 (4 × 105 cells)) in an xCELLigence DTPA 16 well E-plate (Mean ± SEM depicted for each time point, n = 2, separate independent experiments in triplicate).
Fig. 2
Fig. 2. Characterisation of anal SCC cell lines as 3D tumouroids.
A Brightfield photomicrographs (scale bar 200 μm) and haematoxylin and eosin staining (scale bar 100 μm; inset 50 μm) of cell line tumouroids 14 days following seeding of cells in MatrigelTM. B Tumouroids were fixed with paraformaldehyde, embedded in histogel, sectioned and stained for CK5/6, p63 & p16 (brown chromagen)/Ki67 (red chromagen). C Surface architecture of cell line tumouroids assessed following growth for 14 days, retrieval, fixation and processing for scanning electron microscopy (ScEM). (top row: low magnification, scale bar 50 μm except PMAC2 200 μm; bottom row: high magnification, scale bar 20 μm, except PMAC2 50 μm).
Fig. 3
Fig. 3. Characterisation of anal SCC cell lines as xenografts.
Tumourigenicity of the five human ASCC lines was assessed in both A NSG and B athymic (Nude) mice following subcutaneous injections of 5 × 106 cells in 100 μl of 1:1 Matrigel:PBS. The tumours were measured with the growth demonstrated (Mean ± SEM) of those mice with tumours for each cell line. The proportion of mice developing established tumours is displayed in the key. C Histological architecture of the five human ASCC tumours and the derived tumour models following formalin fixation, paraffin embedding, sectioning and staining (Scale bar 100 μm). The haematoxylin and eosin images demonstrate preservation of the cellular and architectural features of the human ASCC tumours from which the primary and cell line xenografts were subsequently derived. Anti-human mitochondrial immunohistochemistry demonstrates staining of the human epithelial tumour cells, with absent staining of the mouse stroma, validating the mouse cell line tumours as human in origin. CL, cell line; Anti-Hu Mito, anti-human mitochondrial.
Fig. 4
Fig. 4. Genomic characterisation of somatic variants and mutational load in the anal SCC cell lines and parent tumours.
A Summary of the 20 most frequent and relevant somatic mutations in each of the five ASCC cell lines generated from whole-exome sequencing (WES). The colour of the square indicates the type of mutation detected, with the intensity of the colour indicating the variant allele frequency (VAF) of the detected genomic aberration. Those listed in bold are amongst the twenty most frequently observed mutations in ASCC, with the remaining genes all having been previously reported to harbour mutations in ASCC. Empty boxes indicate absence of the variant. Total indicates the total number of non-synonymous somatic variants detected in each cell line. B Plot of unique and shared somatic mutations (synonymous and non-synonymous) across the panel of ASCC cell lines and parent tumour samples (Set size = total number mutations, Intersection size = shared mutations between samples identified by the linked dots or unique to the sample alone (single dot)). C The mutational burden of the panel of ASCC cell lines is plotted against the mutational burden of the other TCGA cohorts (https://www.cancer.gov/tcga), with the median of the ASCC panel sitting at a similar level to head and neck SCC (HNSC). (black dots, ASCC cell lines; grey dots, individual patients; Red bar, median; SKCM, melanoma; LUSC, lung SCC; LUAD, lung adenocarcinoma; BLCA, bladder cancer; ESCA, esophageal SCC; HNSCC, head and neck SCC; STAD, stomach adenocarcinoma; DLBC, diffuse large B cell lymphoma; UCEC, uterine corpus endometrial carcinoma; COAD, colorectal adenocarcinoma; OV, ovarian cancer; LIHC, liver hepatocellular carcinoma; CESC, cervical SCC; READ, rectal adenocarcinoma; KIRP, kidney renal papillary cell carcinoma; KIRC, kidney renal clear cell carcinoma; UCS, uterine carcinosarcoma; BRCA, breast carcinoma; GBM, glioblastoma multiforme; SARC, sarcoma; CHOL, cholangiocarcinoma; MESO, mesothelioma; PAAD, pancreatic adenocarcinoma; ACC, adrenocortical carcinoma; LGG, low grade glioma; PRAD, prostate adenocarcinoma; KICH, kidney chromophobe; TGCT, testicular germ cell tumours; THYM, thymoma; LAML, acute myeloid leukaemia; UVM, uveal melanoma; THCA, thyroid carcinoma; PCPG, phaeochromocytoma and paraganglioma).
Fig. 5
Fig. 5. Genomic characterisation of copy number variants in the ASCC cell lines and parent tumours.
A From the WES analysis, the percentage of the five ASCC cell lines with a copy number gain (red) or loss (blue) at each chromosomal region are presented. A gain or loss was defined by a mean log ratio above 0.3 or below −0.3, respectively when compared to the patient matched PBMC DNA. B The cytoband represents the copy number gains and losses across the chromosomal regions for each of the five ASCC cell lines and their respective parent tumours for PMAC2, 3 and 5 (CN = copy number).
Fig. 6
Fig. 6. MHC I & PD-L1 expression in anal cell lines and cell line tumouroids.
The panel of ASCC cell line tumouroids were grown in matrigel and RPMI medium containing 10% FCS. After 5 days in culture the tumouroids were exposed to IFN-γ (100 ng/ml) for 48 h, following which they were retrieved, fixed, embedded, sectioned and stained by IHC for A PD-L1 and B MHC I expression. Cells were counter stained with haematoxylin. The parent tumour tissue PD-L1 IHC staining was performed for comparison (Scale bar 100 μm). C, D. Expression of PD-L1 and MHC I was also assessed by flow cytometry. Following seeding of cells 24 h prior, expression was assessed after growth in the absence (plain bar) and presence (checked bar) of 100 ng/ml IFN-γ for 48 h. Results are expressed as the fold change of the mean fluorescent intensity (MFI) in relation to the respective isotype control (mean percentage of control ± SEM, n = 2).
Fig. 7
Fig. 7. Chemotherapy, radiotherapy and molecular targeted therapy assessment in the ASCC cell lines.
A, B. In vitro 5-FU and MMC cytotoxic assays. Dose–response curves for single agent treatment of the panel of ASCC cell lines for 96 h with viability quantified by an AlamarBlue® assay. Data are expressed as percent of vehicle treated control. Shown are mean ± SEM from three independent experiments, GI50 presented below. C Radiation dose-response curves for the human ASCC cell lines. Radiation survival curves demonstrate the survival fraction (log10) following irradiation with 2, 4, 6, 8 and 10 Gy for the panel of five human ASCC cell lines (mean ± SEM from three independent experiments). D Data points were fitted with the linear quadratic equation, with the radiotherapy surviving fraction of 2 Gy (SF2) and the α and β values and α/β ratio for each cell line calculated. E Dose–response curve for treatment of the panel of ASCC cell lines with BYL719 for 96 h with viability quantified by an AlamarBlue® assay. Data are expressed as percent of vehicle treated control. Shown are the mean ± SEM for three independent experiments, GI50 presented below.

References

    1. AIHW. Australian Cancer incidence and Mortality (ACIM) Books: Anal Cancer. Available from http://www.aihw.gov.au/acim-books, 2018.
    1. SEER Cancer Statistics Factsheets: Anal Cancer. National Cancer Institute. Bethesda, MD. 2019. Available from: http://seer.cancer.gov/statfacts/html/anus.html.
    1. Van Der Zee RP, Richel O, De Vries HJC, Prins JM. The increasing incidence of anal cancer: can it be explained by trends in risk groups? Neth J Med. 2013;71:401–12. - PubMed
    1. Islami F, Ferlay J, Lortet-Tieulent J, Bray F, Jemal A. International trends in anal cancer incidence rates. Int J Epidemiol. 2017;46:924–38. doi: 10.1093/ije/dyx200. - DOI - PubMed
    1. Meulendijks D, Tomasoa NB, Dewit L, Smits PH, Bakker R, van Velthuysen ML, et al. HPV-negative squamous cell carcinoma of the anal canal is unresponsive to standard treatment and frequently carries disruptive mutations in TP53. Br J Cancer. 2015;112:1358–66. doi: 10.1038/bjc.2015.20. - DOI - PMC - PubMed

Publication types

MeSH terms