. 2021 Oct 18;12(1):6071.
doi: 10.1038/s41467-021-26282-z.

Single cell T cell landscape and T cell receptor repertoire profiling of AML in context of PD-1 blockade therapy

Affiliations

Single cell T cell landscape and T cell receptor repertoire profiling of AML in context of PD-1 blockade therapy

Hussein A Abbas et al. Nat Commun. .

Abstract

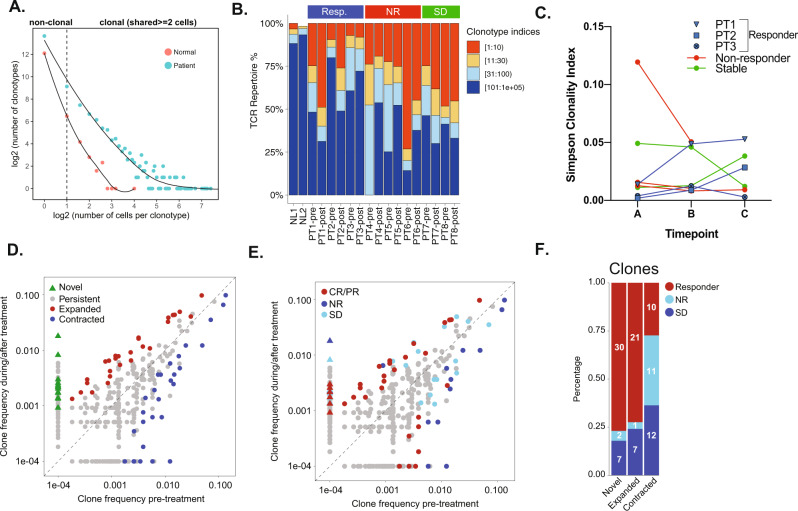
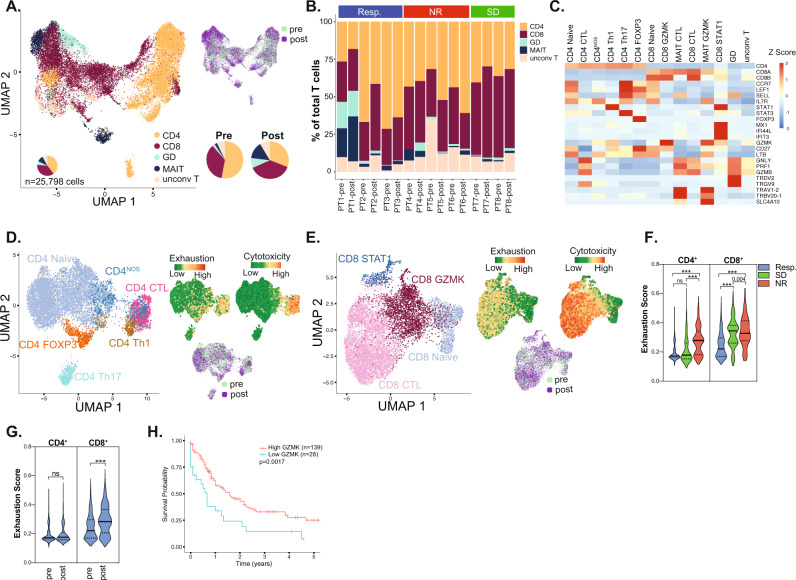
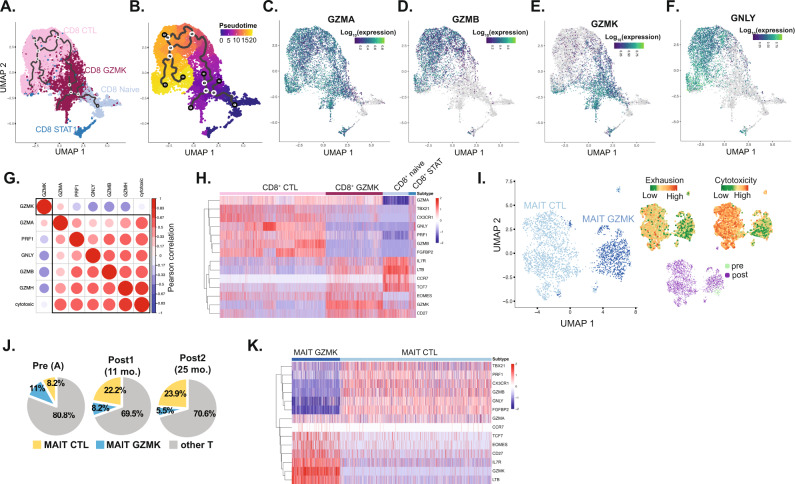
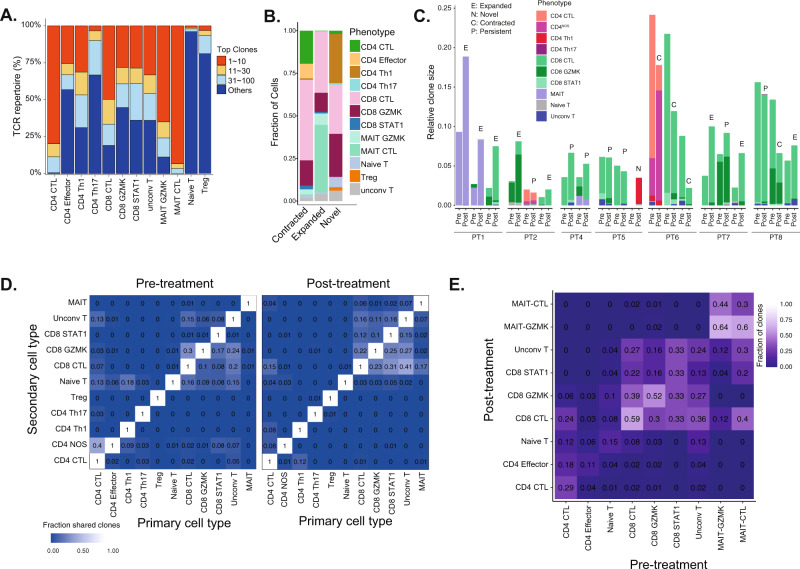
In contrast to the curative effect of allogenic stem cell transplantation in acute myeloid leukemia via T cell activity, only modest responses are achieved with checkpoint-blockade therapy, which might be explained by T cell phenotypes and T cell receptor (TCR) repertoires. Here, we show by paired single-cell RNA analysis and TCR repertoire profiling of bone marrow cells in relapsed/refractory acute myeloid leukemia patients pre/post azacytidine+nivolumab treatment that the disease-related T cell subsets are highly heterogeneous, and their abundance changes following PD-1 blockade-based treatment. TCR repertoires expand and primarily emerge from CD8+ cells in patients responding to treatment or having a stable disease, while TCR repertoires contract in therapy-resistant patients. Trajectory analysis reveals a continuum of CD8+ T cell phenotypes, characterized by differential expression of granzyme B and a bone marrow-residing memory CD8+ T cell subset, in which a population with stem-like properties expressing granzyme K is enriched in responders. Chromosome 7/7q loss, on the other hand, is a cancer-intrinsic genomic marker of PD-1 blockade resistance in AML. In summary, our study reveals that adaptive T cell plasticity and genomic alterations determine responses to PD-1 blockade in acute myeloid leukemia.


Conflict of interest statement

K.Ta. reports consulting and advisory roles for Symbio Pharmaceuticals, Novartis, GSK and Celgene/BMS. G.A. reports consulting fees from Novartis and Poseida therapeutics, and research funding from Merck and Jenssen Pharmaceuticals. M.R.G. reports consulting fees with VeraStem Oncology and stock/ownership interest KDAc Therapeutics. M.K. reports grant support and consulting fees from AbbVie, Genentech, F. Hoffmann La-Roche, Stemline Therapeutics, Forty-Seven, consulting fees from Amgen and Kisoji, grant support from Eli Lilly, Cellectis, Calithera, Ablynx, Agios, Ascentage, AstraZeneca, Rafael Pharmaceutical, Sanofi, royalties and stock options from Reata Pharmaceutical Inc. P.S. reports consulting, advisory roles, and/or stocks/ownership for Achelois, Adaptive Biotechnologies, Affini-T, Apricity, BioAtla, BioNTech, Candel Therapeutics, Catalio, Codiak, Constellation, Dragonfly, Earli, Enable Medicine, Glympse, Hummingbird, ImaginAb, Infinity Pharma, Jounce, JSL Health, Lava Therapeutics, Lytix, Marker, Oncolytics, PBM Capital, Phenomic AI, Polaris Pharma, Sporos, Time Bioventures, Trained Therapeutix, Two Bear Capital, Venn Biosciences. J.P.A. reports consulting, advisory roles, and/or stocks/ownership for Achelois, Adaptive Biotechnologies, Apricity, BioAtla, BioNTech, Candel Therapeutics, Codiak, Dragonfly, Earli, Enable Medicine, Hummingbird, ImaginAb, Jounce, Lava Therapeutics, Lytix, Marker, PBM Capital, Phenomic AI, Polaris Pharma, Time Bioventures, Trained Therapeutix, Two Bear Capital, Venn Biosciences. N.D. reports research funding from Daiichi Sankyo, Bristol-Myers Squibb, Pfizer, Karyopharm, Sevier, Genentech, Astellas, Abbvie, Genentech, Novimmune, Amgen, Trovagene, Gilead and ImmunoGen and has served in a consulting or advisory role for Daiichi Sankyo, Bristol-Myers Squibb, Pfizer, Novartis, Celgene, AbbVie, Genentech, Servier, Trillium, Syndax, Trovagene, Astellas, Gilead and Agios. The remaining authors declare no competing interests.

Figures

Fig. 1
Fig. 1. Study design and single cell assessment of AML and healthy bone marrows.
A Clinical design summarizing the age, response type per ELN, time to response, treatment frequency and the number of cells analyzed per patient. B Canonical gene expression markers to define the healthy bone marrow (BM) and tumor microenvironment (TME) cellular subsets. C UMAP-based analysis of healthy BM cellular components with frequency of each cell type. D Representative output of combining patient BM sample (represented by PT1, post-treatment timepoint C) with healthy BM donor cells demonstrating distinct clustering of tumor cells with concordant expression of CD34 confirmed by flow cytometry and immunohistochemistry, when available (Supplementary Fig. 3A–D). E Representative Inferring copy number variation of malignant cells compared to monocytes demonstrate concordant cytogenetic profiling, further confirming AML cell identity. F Spearman correlation between the number of cells detected by scRNA versus flow cytometry and histopathology. G UMAP clustering of AML cells. H UMAP clustering of TME components. I Distribution of TME components in AML patients at different timepoints (A is pre-treatment, B and C are post-treatment samples). PR partial response, CR complete response, NR no response, SD stable disease, HSC hematopoietic stem cell, GMP granulocyte–monocytic progenitor, cDC conventional dendritic cell, pDC plasmacytoid dendritic cell, unconv T unconventional T, NK natural killer.
Fig. 2
Fig. 2. T-cell receptor clonotype assessment across different patients and timepoints.
A Scatterplot of the correlation between the number of T cell clonotypes and the size of the clonotype i.e. the number of T cells contributing to the clonotype. B Distribution of the most abundant clonotypes by patient. C Simpson’s clonality index of individual patients at each of their respective timepoints. D Scatterplots of clonotypes change of post- versus pre-treatment and E by response groups. F Number of novel, expanded and contracted clonotypes by response group.
Fig. 3
Fig. 3. Characterization of T-cell subsets.
A UMAP of T cell subsets. B Distribution of T cell subsets prior to and following treatment. C Heatmap of canonical marker expression of identified T cell subsets. UMAP of the different D CD4+ and E CD8+ phenotypes with exhaustion and cytotoxicity scores projected onto the UMAP. F Mann–Whitney test for exhaustion scores of CD4+ and CD8+ T lymphocytes of different response groups prior to treatment. G Mann–Whitney test for exhaustion scores of CD4+ and CD8+ T lymphocytes at pre and post treatment in responders. H Overall survival of AML patients in TCGA cohort by GZMK expression.
Fig. 4
Fig. 4. Trajectory analysis of CD8+ T cells.
A, B Monocle3-based pseudotemporal analysis of CD8+ subsets. CF Expression of GZMA, GZMB, GZMK and GNLY in cells projected onto the trajectory of CD8+ continuum. G Pearson correlation between GZMK and other cytotoxic genes in CD8+ cells. H Heatmap of differentially expressed genes among CD8+ T lymphocyte subsets. I UMAP of MAIT cells with exhaustion and cytotoxicity scores projection. J Distribution of T-cell subsets in PT1. K Heatmap of differentially expressed genes between MAIT subsets.
Fig. 5
Fig. 5. T-cell clonotype analysis.
A Distribution of the TCR clonotype frequency by cell type. B Number of novel, expanded and contracted clonotypes by cell type. C Fraction of T cells from top, most abundant 3 clonotypes. D Heatmap of overlapping clonotypes between different cell types at pre- and post- treatment timepoints. E Heatmap for observed phenotype transitions for matched clones at pre- and post- treatment timepoints.
Fig. 6
Fig. 6. Correlation of responses with cytogenetics.
A Inferred copy number variation of representative 300 cells per patient at pretreatment (timepoint A). B Inferred copy number variation of the 3 timepoints (A, B and C) for PT3 (responder). C Fish plot of mutational evolution of PT3. D A two-sided Pearson’s Chi-square for correlation analysis for responders to azacitidine/nivolumab and E azacitidine-based therapy based on chr7/7q deletion. F Mann–Whitney, two-sided test for CIBERSORTx analysis of Treg cell components in AML from TCGA by chr7/7q status (n = 19 for del7/7q and n = 152 for no deletion in chr7/7q). Center line represents the main and lower and upper hingest correspond to the first and third quartiles.

References

    1. Binnewies M, et al. Understanding the tumor immune microenvironment (TIME) for effective therapy. Nat. Med. 2018;24:541–550. doi: 10.1038/s41591-018-0014-x. - DOI - PMC - PubMed
    1. Vadakekolathu J, et al. Immune landscapes predict chemotherapy resistance and immunotherapy response in acute myeloid leukemia. Sci. Transl. Med. 2020;12:eaaz0463. doi: 10.1126/scitranslmed.aaz0463. - DOI - PMC - PubMed
    1. Horowitz MM, et al. Graft-versus-leukemia reactions after bone marrow transplantation. Blood. 1990;75:555–562. doi: 10.1182/blood.V75.3.555.555. - DOI - PubMed
    1. Hodi FS, et al. Improved survival with ipilimumab in patients with metastatic melanoma. N. Engl. J. Med. 2010;363:711–723. doi: 10.1056/NEJMoa1003466. - DOI - PMC - PubMed
    1. Borghaei H, et al. Nivolumab versus docetaxel in advanced nonsquamous non-small-cell lung cancer. N. Engl. J. Med. 2015;373:1627–1639. - PMC - PubMed

Publication types

MeSH terms