. 2021 Oct 18;12(1):6058.
doi: 10.1038/s41467-021-26343-3.

Single-cell transcriptomic analysis of the tumor ecosystems underlying initiation and progression of papillary thyroid carcinoma

Affiliations

Single-cell transcriptomic analysis of the tumor ecosystems underlying initiation and progression of papillary thyroid carcinoma

Weilin Pu et al. Nat Commun. .

Abstract

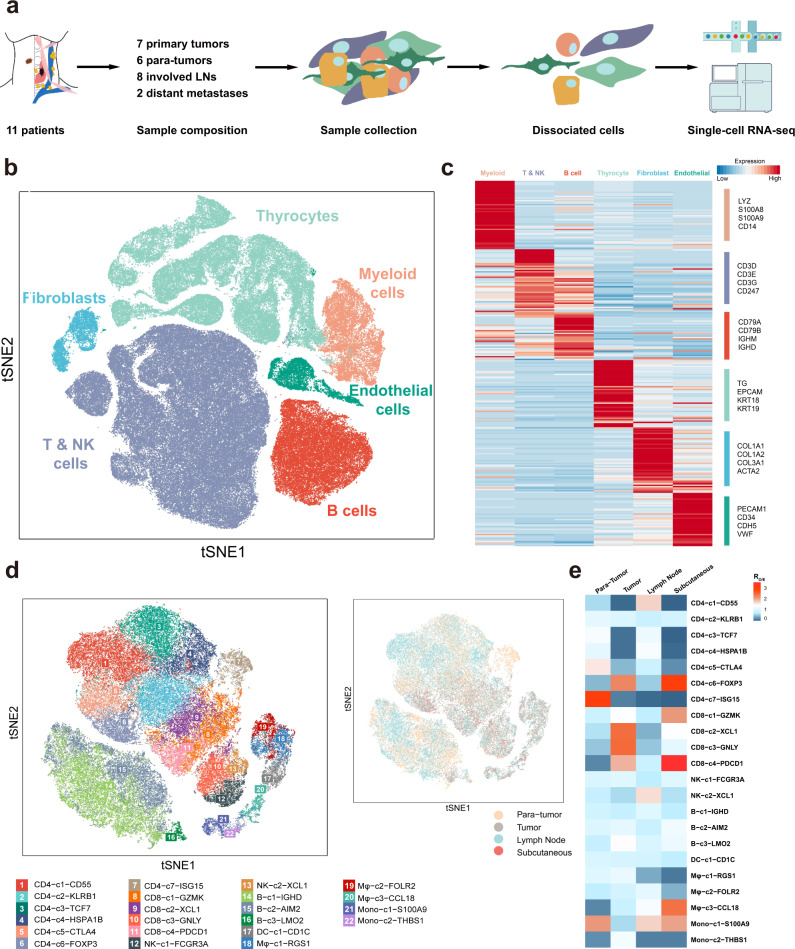
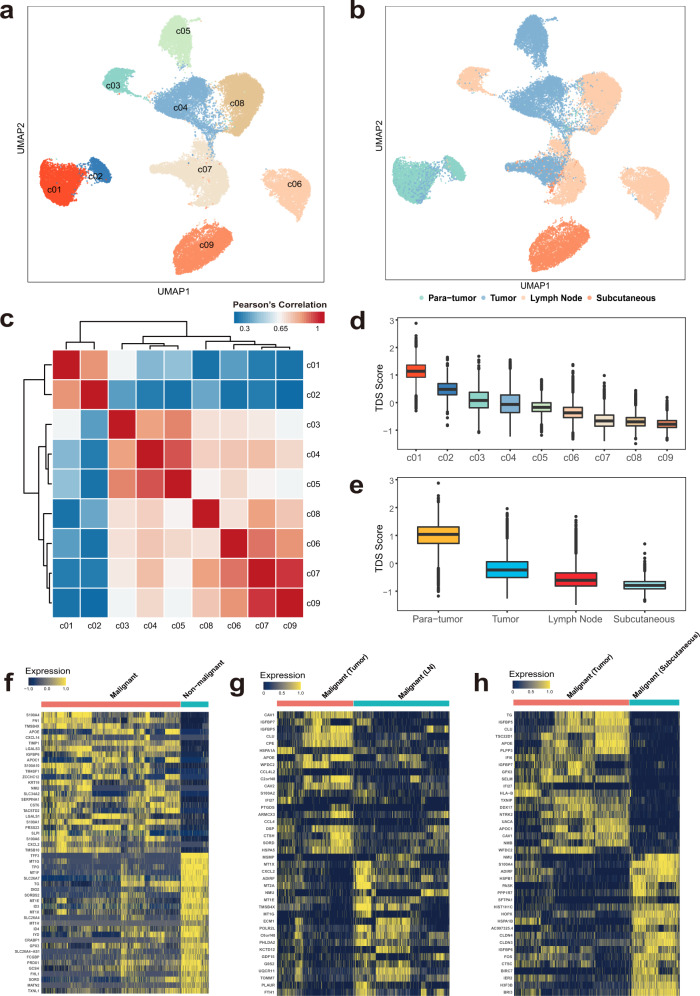
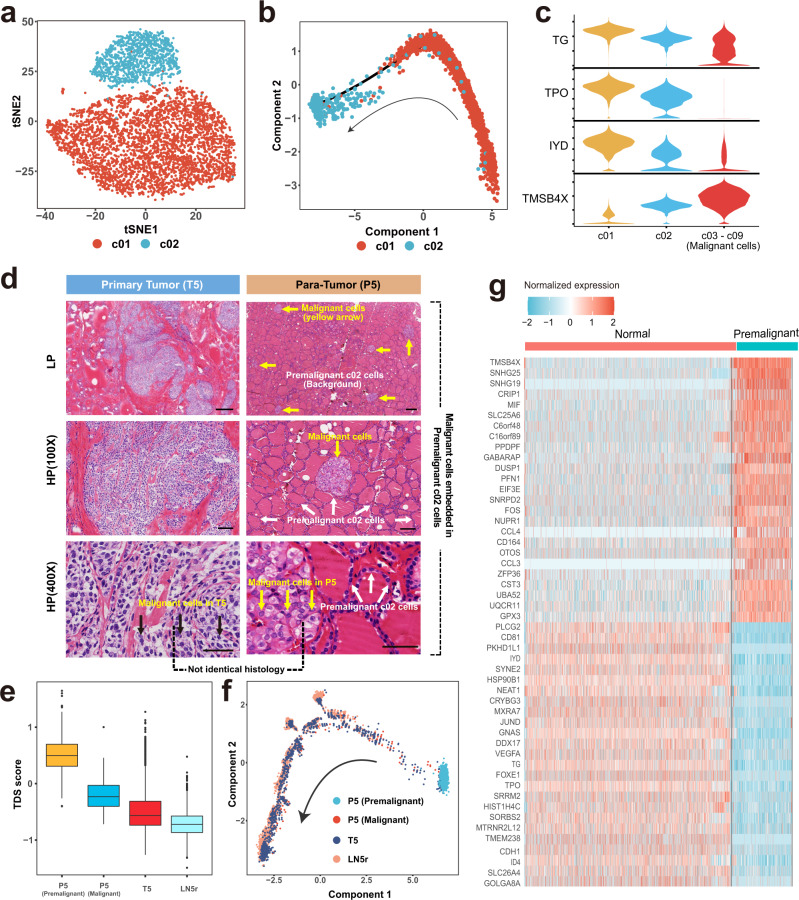
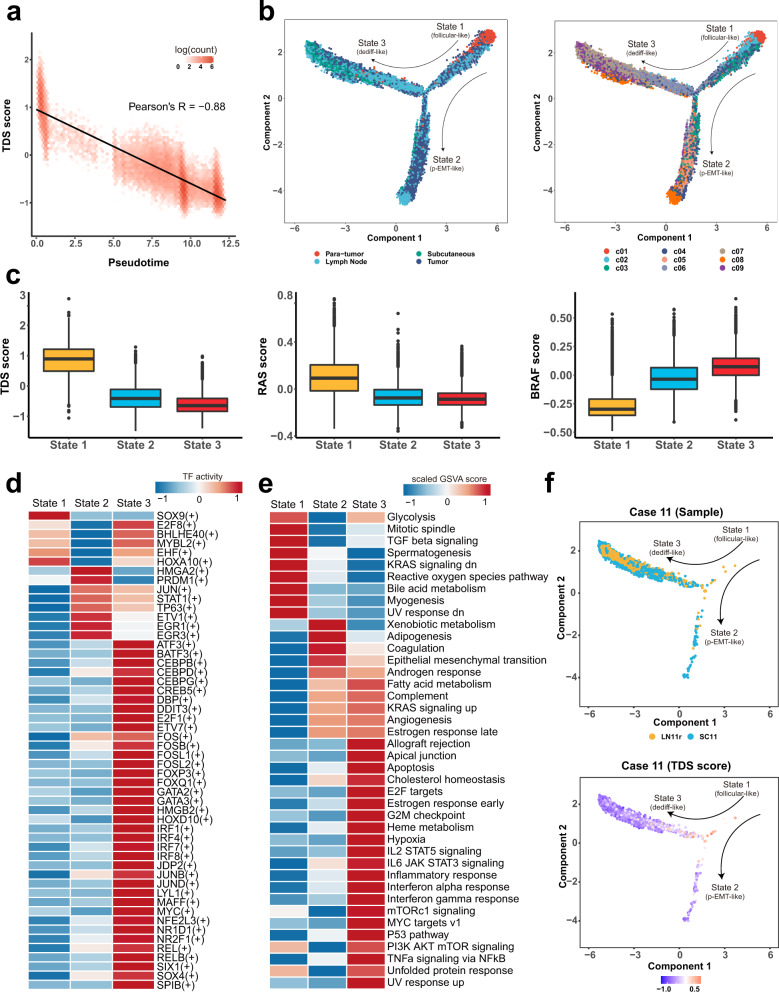
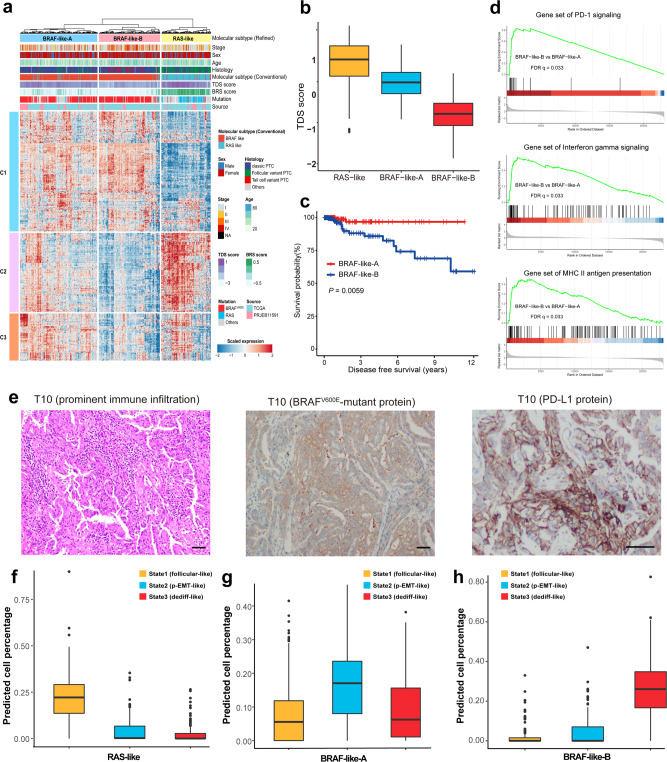
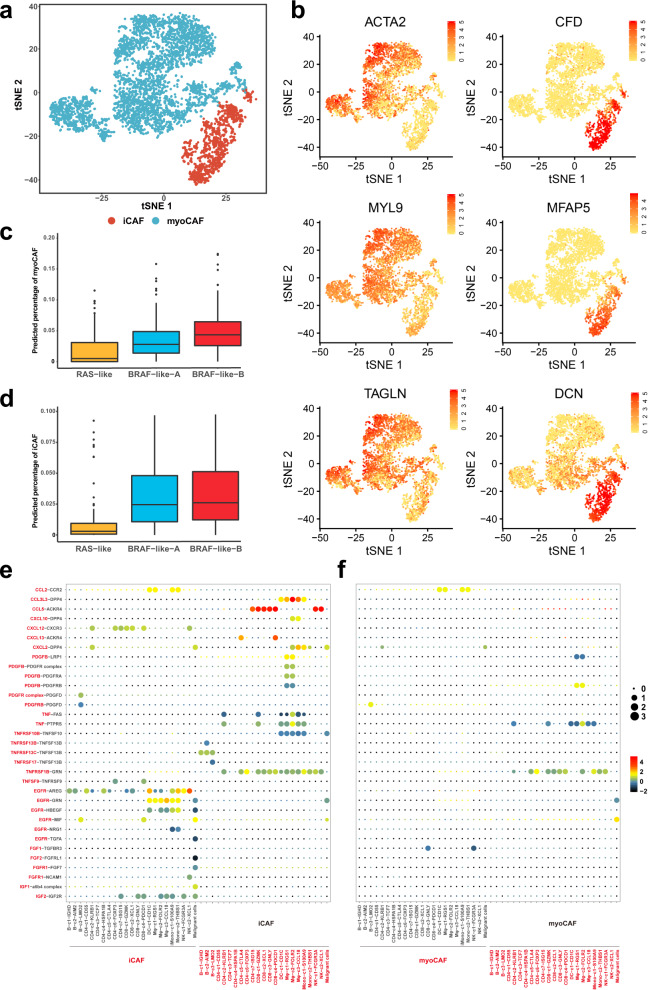
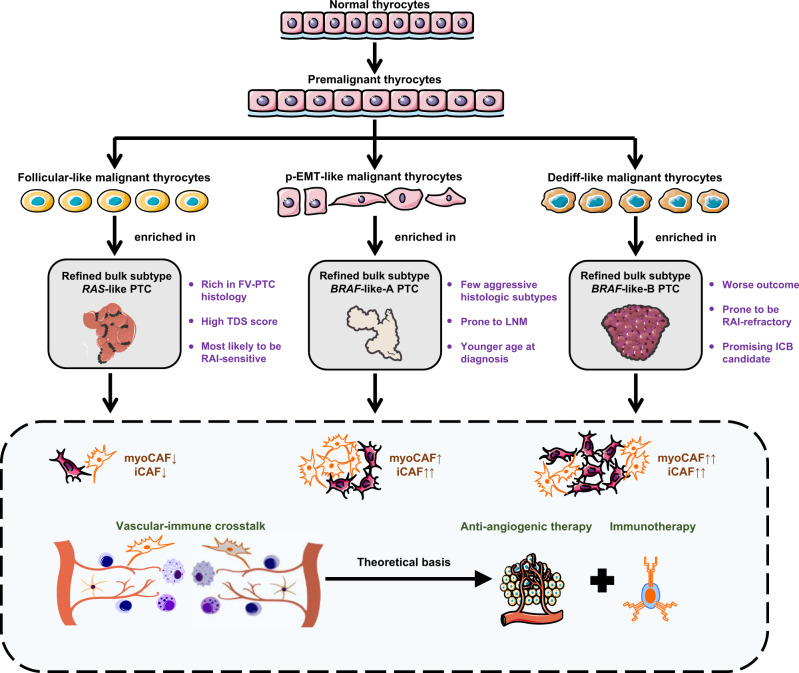
The tumor ecosystem of papillary thyroid carcinoma (PTC) is poorly characterized. Using single-cell RNA sequencing, we profile transcriptomes of 158,577 cells from 11 patients' paratumors, localized/advanced tumors, initially-treated/recurrent lymph nodes and radioactive iodine (RAI)-refractory distant metastases, covering comprehensive clinical courses of PTC. Our data identifies a "cancer-primed" premalignant thyrocyte population with normal morphology but altered transcriptomes. Along the developmental trajectory, we also discover three phenotypes of malignant thyrocytes (follicular-like, partial-epithelial-mesenchymal-transition-like, dedifferentiation-like), whose composition shapes bulk molecular subtypes, tumor characteristics and RAI responses. Furthermore, we uncover a distinct BRAF-like-B subtype with predominant dedifferentiation-like thyrocytes, enriched cancer-associated fibroblasts, worse prognosis and promising prospect of immunotherapy. Moreover, potential vascular-immune crosstalk in PTC provides theoretical basis for combined anti-angiogenic and immunotherapy. Together, our findings provide insight into the PTC ecosystem that suggests potential prognostic and therapeutic implications.


Conflict of interest statement

The authors declare no competing interests.

Figures

Fig. 1
Fig. 1. Expression profiling of 158,577 single cells in PTCs.
a Workflow of sample composition, processing and bioinformatic analyses for 23 samples in the present study. b t-SNE plot of all high-quality cells profiled in the present study colored by major cell lineage. c, Heatmap of the canonical and curated marker genes for major cell lineages. d t-SNE projection showing the landscape of immune cells, colored by cluster (left) and tissue (right). e Tissue preference for each immune cell subcluster estimated by Ro/e. Source data are provided in the Source Data file.
Fig. 2
Fig. 2. Identification of malignant thyrocytes and their transcriptional heterogeneity between different tissue types.
UMAP projection of 36,265 thyrocytes colored by (a) cluster and (b) tissue. c Heatmap of pair-wise Spearman’s correlations among c01-c09 thyrocyte clusters. Boxplots showing TDS scores of (d) each thyrocyte cluster and (e) tissue type. The number of cells in each group is shown in Supplementary Table 4. The middle lines of the boxplots show the median (central line), the lower and upper hinges show the 25–75% interquartile range (IQR), and the whiskers extend from the hinge to the farthest data point within a maximum of 1.5x IQR. Heatmaps of the top DEGs between (f) malignant versus non-malignant thyrocytes, (g) tumor-derived versus LN-derived malignant thyrocytes, and (h) tumor-derived versus subcutaneous loci-derived malignant thyrocytes. Source data are provided in the Source data file.
Fig. 3
Fig. 3. Identification and transcriptional characterization of premalignant thyrocytes.
a t-SNE projection of the two clusters of non-malignant thyrocytes (c01 and c02). b Potential trajectory of c01 and c02 cells inferred by Monocle2. The arrow shows the putative developmental direction from c01 to c02 cluster. c Violin plots showing several DEGs between c01, c02, and c03-c09 clusters. Expression level of TG, TPO, and IYD decreases while the level of TMSB4X increases continuously from c01 to c02 and to c03-c09 thyrocytes. d Representative H&E staining of primary tumor (T5) and para-tumor (P5) of Case 5 at magnifications of × 20, × 100, and × 400. Three independent experiments were performed and generated similar results. Scale bar (upper) = 300 µm; Scale bar (middle) = 100 µm; Scale bar (bottom) = 50 µm. e Boxplot showing TDS scores of thyrocytes from the premalignant paratumor (n = 1036), malignant paratumor (n = 118), tumor (n = 1337) and lymph node metastasis (n = 4986) of Case 5. The middle lines of the boxplots show the median (central line), the lower and upper hinges show the 25–75% interquartile range (IQR), and the whiskers extend from the hinge to the farthest data point within a maximum of 1.5 x IQR. f Trajectory analysis of four thyrocyte populations from Case 5 (P5 premalignant cells, P5/T5/LN5r malignant cells). The arrow shows potential evolutionary direction from P5 premalignant thyrocytes to P5/T5/LN5r malignant thyrocytes. g Heatmap of normalized expression of top upregulated and downregulated genes between normal (c01) and premalignant thyrocytes (c02). Source data are provided in the Source data file.
Fig. 4
Fig. 4. Trajectory analysis reveals three distinct transcriptional states of thyrocytes.
a Scatter plot showing a significantly negative correlation between TDS scores and pseudotime values inferred from the trajectory analysis for all thyrocytes. b Potential trajectory of all thyrocytes identified three distinct cell states (State 1–3), colored by tissue type (left) or cluster (right), respectively. The arrow shows potential evolutionary direction in the trajectory. c Boxplots showing significant differences in TDS scores, RAS scores and BRAF scores of the State 1 (n = 7873), State 2 (n = 12,354) and State 3 (n = 16,038) thyrocytes. The middle lines of the boxplots show the median (central line), the lower and upper hinges show the 25–75% interquartile range (IQR), and the whiskers extend from the hinge to the farthest data point within a maximum of 1.5x IQR. d Heatmap of TF (transcription factor) activities in the three thyrocyte states, scored by SCENIC. e Differences in the activities of hallmark pathways between different thyrocyte states, scored by GSVA. f Developmental trajectory of thyrocytes from Case 11, colored by tissue type (upper panel) or TDS score (bottom panel). Source data are provided in the Source data file.
Fig. 5
Fig. 5. Modified molecular subtypes and deconvolution of bulk RNA-seq profiles.
a Heatmap of the top pseudotime-associated genes (n = 480) in 613 PTCs from the integrated bulk cohort (TCGA and PRJEB11591). Hierarchical clustering identifies three molecular subtypes of PTCs. b Differences in TDS scores of the three PTC molecular subtypes, RAS-like (n = 161), BRAF-like-A (n = 253) and BRAF-like-B (n = 199) defined in our study. c Kaplan–Meier plot for disease-free survival of patients with BRAF-like-A (n = 191) and BRAF-like-B (n = 171) PTCs in the TCGA cohort. Log-rank test (two-sided). d GSEA plots showing significantly enriched pathways in the BRAF-like-B subtype compared with the BRAF-like-A subtype. e H&E-stained or IHC images showing prominent immune infiltration, positive BRAF V600E-mutant protein and PD-L1 protein expressions in the primary tumor (T10) of Case 10. Three independent experiments were performed and generated similar results. Scale bar = 50 µm. Deconvolution analysis showing thyrocyte phenotype composition in the (f) RAS-like subtype (n = 161), (g) BRAF-like-A subtype (n = 253) and (h) BRAF-like-B subtype (n = 199). In (b), (f), (g) and (h), the middle lines of the boxplots show the median (central line), the lower and upper hinges show the 25–75% interquartile range (IQR), and the whiskers extend from the hinge to the farthest data point within a maximum of 1.5 x IQR. Source data are provided in the Source data file.
Fig. 6
Fig. 6. Subtyping of cancer-associated fibroblasts and their contributions to the PTC ecosystem.
a t-SNE projection of the distinctions between myoCAFs and iCAFs. b t-SNE plots of key marker genes for myoCAFs and iCAFs in PTC. Deconvolution analysis demonstrating the predicted proportion of (c) myoCAFs and (d) iCAFs in the three bulk PTC classifications (RAS-like (n = 161), BRAF-like-A (n = 253), BRAF-like-B (n = 199)). The middle lines of the boxplots show the median (central line), the lower and upper hinges show the 25–75% interquartile range (IQR), and the whiskers extend from the hinge to the farthest data point within a maximum of 1.5x IQR. Bubble plots showing ligand-receptor pairs of cytokines, chemokines and growth factors between (e) iCAFs or (f) myoCAFs with other cell types, inferred by CellPhoneDB. Source data are provided in the Source data file.
Fig. 7
Fig. 7. Characterization of endothelial cells in PTCs.
a t-SNE projection showing five different subtypes of ECs. Expression levels of marker genes for arterial (b), venous (c), lymphatic (d), immature (e), and tip ECs (f). g Heatmap showing the TF activities in the five EC subtypes, scored by SCENIC and AUCell. h Sankey diagram showing assignment of normal EC (NEC) and tumor EC (TEC) to arterial, venous, lymphatic, immature and tip subtypes. i Bubble plots showing L-R pairs of cytokines, chemokines and growth factors between tip ECs and other cell types, inferred by CellPhoneDB. Source data are provided in the Source data file.
Fig. 8
Fig. 8. Schematic Digram of the present study.
Schematic Diagram Dissecting the PTC Ecosystem with Potential Prognostic and Therapeutic Implications.

References

    1. Lim H, Devesa SS, Sosa JA, Check D, Kitahara CM. Trends in thyroid cancer incidence and mortality in the United States, 1974–2013. JAMA. 2017;317:1338–1348. doi: 10.1001/jama.2017.2719. - DOI - PMC - PubMed
    1. Tiedje V, Fagin JA. Therapeutic breakthroughs for metastatic thyroid cancer. Nat. Rev. Endocrinol. 2020;16:77–78. doi: 10.1038/s41574-019-0307-2. - DOI - PMC - PubMed
    1. Mehnert JM, et al. Safety and antitumor activity of the anti-PD-1 antibody pembrolizumab in patients with advanced, PD-L1-positive papillary or follicular thyroid cancer. BMC Cancer. 2019;19:196. doi: 10.1186/s12885-019-5380-3. - DOI - PMC - PubMed
    1. The Cancer Genome Atlas Research Network. Integrated genomic characterization of papillary thyroid carcinoma. Cell. 2014;159:676–690. doi: 10.1016/j.cell.2014.09.050. - DOI - PMC - PubMed
    1. Fagin JA, Wells SA., Jr. Biologic and clinical perspectives on thyroid cancer. N. Engl. J. Med. 2016;375:1054–1067. doi: 10.1056/NEJMra1501993. - DOI - PMC - PubMed

Publication types

Substances