. 2021 Dec;40(50):6748-6758.
doi: 10.1038/s41388-021-02054-3. Epub 2021 Oct 18.

Single-cell RNA sequencing reveals distinct tumor microenvironmental patterns in lung adenocarcinoma

Affiliations

Single-cell RNA sequencing reveals distinct tumor microenvironmental patterns in lung adenocarcinoma

Philip Bischoff et al. Oncogene. 2021 Dec.

Abstract

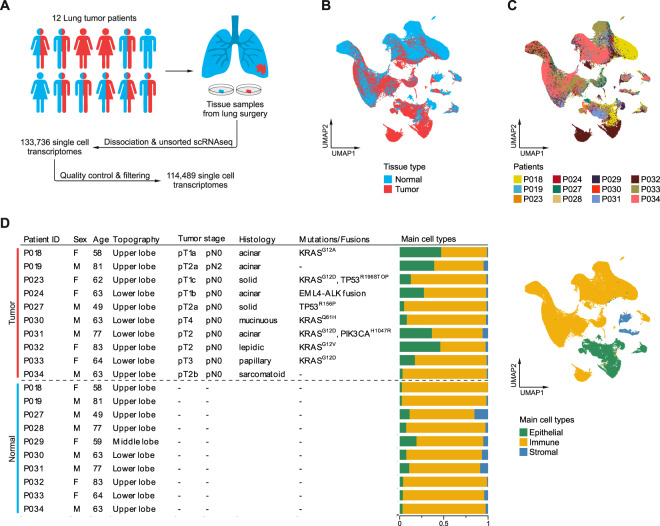
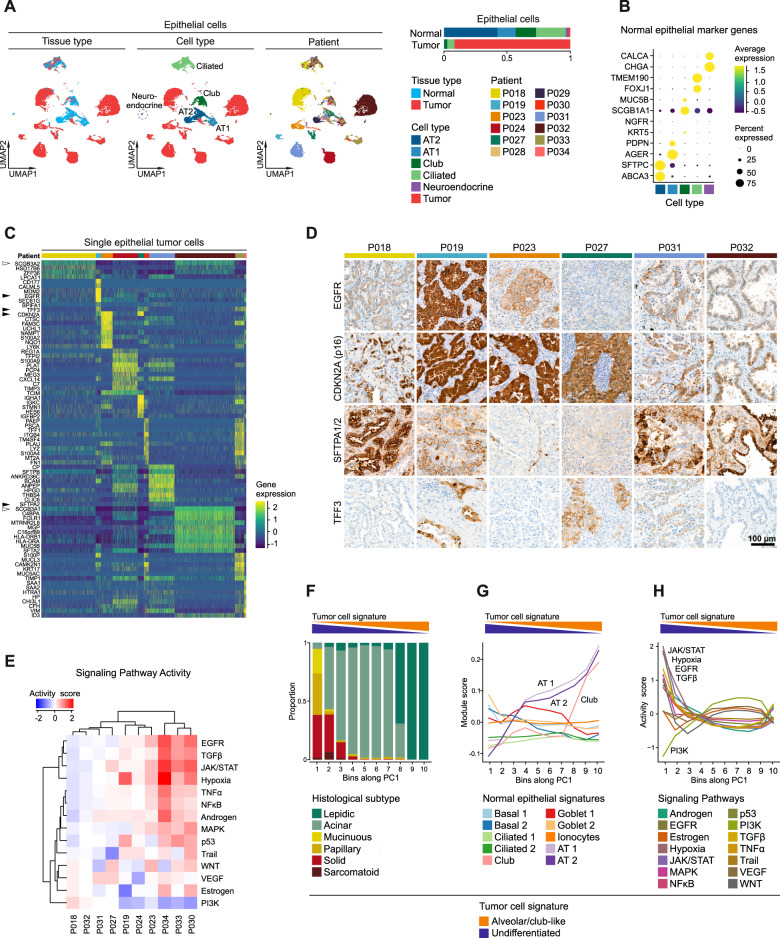
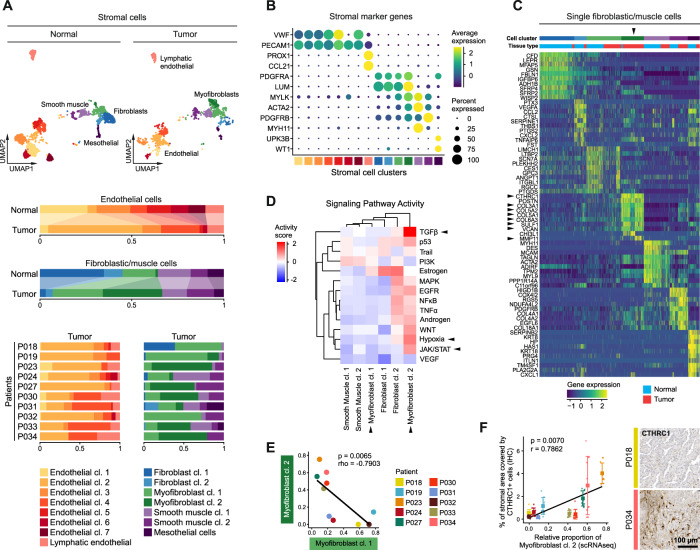
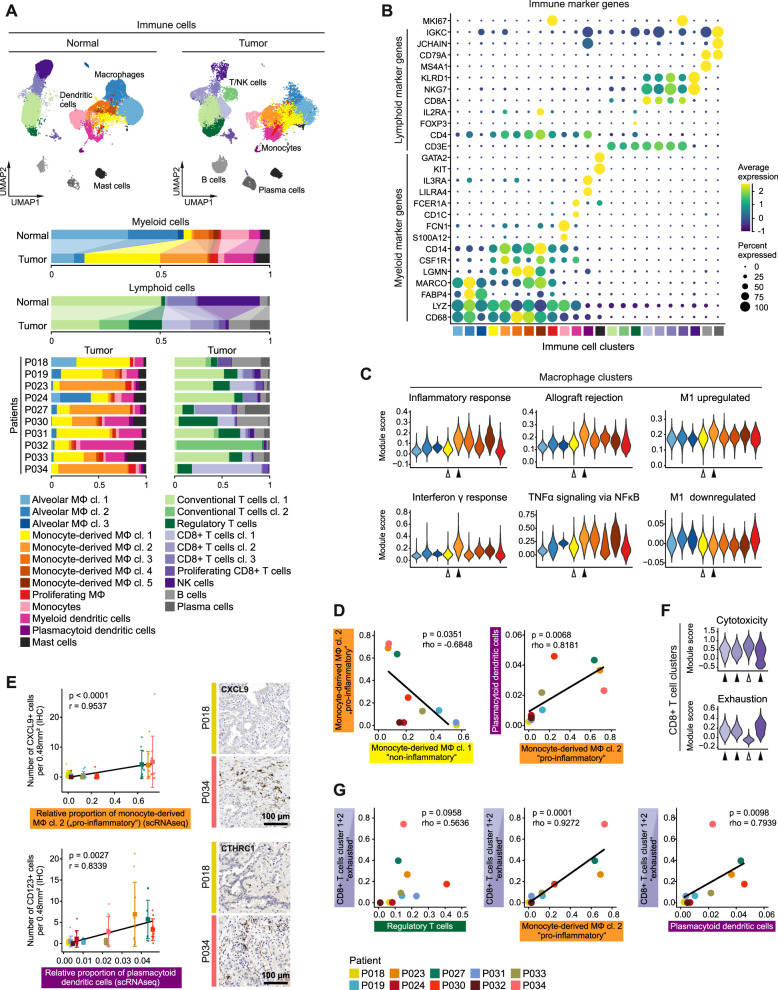
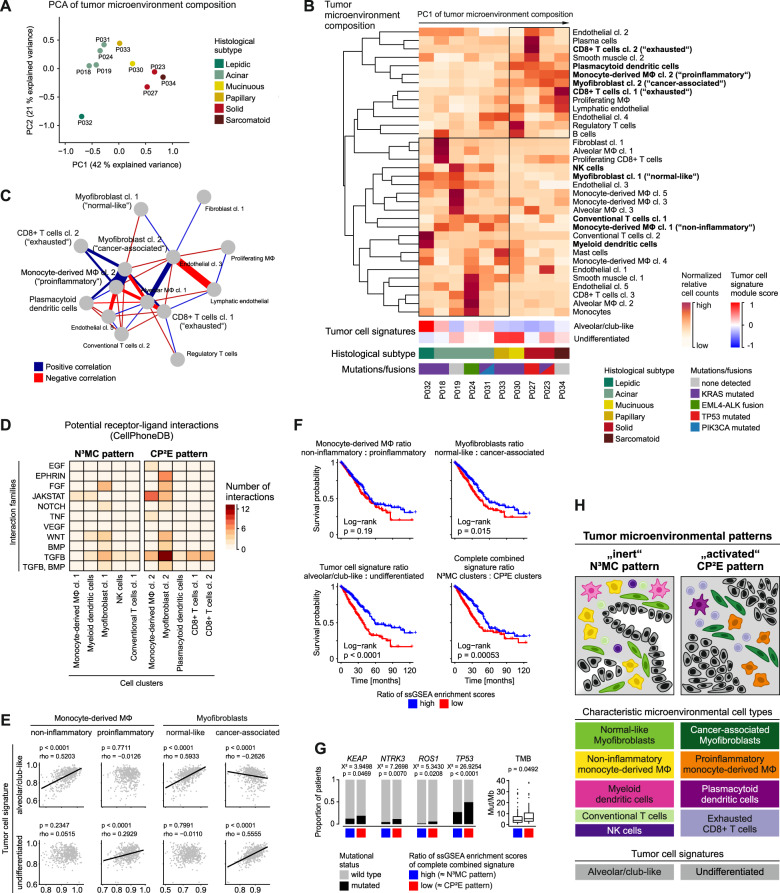
Recent developments in immuno-oncology demonstrate that not only cancer cells, but also the tumor microenvironment can guide precision medicine. A comprehensive and in-depth characterization of the tumor microenvironment is challenging since its cell populations are diverse and can be important even if scarce. To identify clinically relevant microenvironmental and cancer features, we applied single-cell RNA sequencing to ten human lung adenocarcinomas and ten normal control tissues. Our analyses revealed heterogeneous carcinoma cell transcriptomes reflecting histological grade and oncogenic pathway activities, and two distinct microenvironmental patterns. The immune-activated CP²E microenvironment was composed of cancer-associated myofibroblasts, proinflammatory monocyte-derived macrophages, plasmacytoid dendritic cells and exhausted CD8+ T cells, and was prognostically unfavorable. In contrast, the inert N³MC microenvironment was characterized by normal-like myofibroblasts, non-inflammatory monocyte-derived macrophages, NK cells, myeloid dendritic cells and conventional T cells, and was associated with a favorable prognosis. Microenvironmental marker genes and signatures identified in single-cell profiles had progonostic value in bulk tumor profiles. In summary, single-cell RNA profiling of lung adenocarcinoma provides additional prognostic information based on the microenvironment, and may help to predict therapy response and to reveal possible target cell populations for future therapeutic approaches.


Conflict of interest statement

The authors declare no competing interests.

Figures

Fig. 1
Fig. 1. Single-cell RNA sequencing of lung adenocarcinomas.
A Schematic representation of the workflow, ten normal (blue) and ten tumor (red) tissue samples were obtained from 12 patients. B, C UMAPs based on the top 15 principal components of all single-cell transcriptomes after filtering, color-coded by (B) tissue type, or (C) patient. D Overview of clinical features, clinically relevant oncogenic mutations and gene fusions; quantification of main cell types per patient and UMAP of all single-cell transcriptomes color-coded by main cell type.
Fig. 2
Fig. 2. Intertumoral heterogeneity of tumor epithelial cells in lung adenocarcinomas.
A UMAPs based on the top 20 principal components of all epithelial single-cell transcriptomes color-coded by tissue type, cell type and patient, and quantification of epithelial cell types per tissue type, AT1, alveolar type 1 cells, AT2, alveolar type 2 cells. B Average gene expression of selected marker genes for normal epithelial cell types. C Differentially expressed genes in tumor epithelial cells grouped by patients, maximum top ten genes showed per patient, for patient color code see (A). D Immunohistochemical staining of proteins encoded by selected differentially expressed genes indicated by black arrowheads in (C). E Mean pathway activity scores of tumor epithelial cells grouped by patient. F Distribution of histological subtypes, (G) mean module scores of normal epithelial cell type gene signatures, and (H) mean pathway activity scores of tumor epithelial cells sorted along principal component 1 (PC1). F, G, H Principal component analysis based on gene expression of all tumor epithelial single-cell transcriptomes; schematic depiction of tumor cell signature module scores along PC1.
Fig. 3
Fig. 3. Composition of the stromal microenvironment of lung adenocarcinomas.
A UMAPs based on the top 20 principal components of all stromal single-cell transcriptomes split by tissue type, color-coded by cell cluster; and relative quantification of endothelial and fibroblastic/muscle cell clusters per tissue type and, for tumor samples, per patient. B Average gene expression of selected marker genes for stromal cell clusters, for cell cluster color code see (A). C Differentially expressed genes of fibroblastic/muscle cell clusters, maximum top ten genes showed per cell cluster, for cell cluster color code see (A), black arrowheads indicate relevant marker genes of myofibroblast cluster 2 mentioned in the main text. D Mean pathway activity scores of different fibroblastic/muscle cell clusters, mesothelial cells excluded, black arrowheads indicate relevant pathways of myofibroblast clusters 1 and 2 mentioned in the main text. E Correlation of the relative quantity of myofibroblast clusters 1 and 2, color-coded by patient; Spearman’s correlation statistics, linear regression line. F Immunohistochemical staining of CTHRC1 as marker for myofibroblast cluster 2 (see also (C)), quantification of proportion of stromal areal covered by CTHRC1+ cells, mean ± s.d., n = 10 per patient, for patient color code see (E); Pearson’s correlation statistics and linear regression line using mean values per patient.
Fig. 4
Fig. 4. Composition of the immune microenvironment of lung adenocarcinomas.
A UMAPs based on the top 20 principal components of all immune single-cell transcriptomes split by tissue type, color-coded by cell cluster; and relative quantification of myeloid and lymphoid cell clusters per tissue type and, for tumor samples, per patient. B Average gene expression of selected marker genes for immune cell clusters, for cell cluster color code see (A). C Module scores of gene signatures related to inflammation and M1/M2 polarization of different macrophage clusters, white and black arrowheads indicate monocyte-derived macrophage clusters 1 and 2, respectively, for cell cluster color code see (A). D Correlation of the relative quantity of selected myeloid immune cell clusters, for patient color code see (G); Spearman’s correlation statistics, linear regression line. E Immunohistochemical staining of CXCL9 and CD123 as markers for monocyte-derived macrophage cluster 2 and plasmacytoid dendritic cells, respectively, quantification of CXCL9+ or CD123+ cells per 0.48 mm², mean ± s.d., n = 10 per patient, for patient color code see (G); Pearson’s correlation statistics and linear regression line using mean values per patient. F Module scores of gene signatures related to cytotoxicity and exhaustion of different CD8+ T cell clusters, white and black arrowheads indicate cell clusters enriched in normal or tumor tissue, respectively, for cell cluster color code see (A). G Correlation of the relative quantity of selected lymphoid and myeloid immune cell clusters, color-coded by patient; Spearman’s correlation statistics, linear regression line.
Fig. 5
Fig. 5. Tumor microenvironmental patterns in lung adenocarcinomas.
A Principal component analysis based on the proportion of stromal and immune cell clusters, color-coded by histological subtype, patients indicated. B Normalized proportion of stromal and immune cell clusters, mean module scores of tumor cell signatures, histological subtypes and mutation status per patient, patients sorted along the first principal component from principal component analysis in (A), cell clusters included in the model in (H) in bold. C Correlation of the proportion of stromal and immune cell clusters, most connected section of correlation network plot shown; Spearman’s correlation statistics, only correlations with rho > 0.7 and p < 0.05 shown. A, B, C Cell clusters occurring in <3 patients were excluded from analyses. D Number of potential paracrine interactions from microenvironmental cell clusters to tumor cells of the N³MC or CP²E pattern, computed using CellPhoneDB, grouped by interaction families, color-coded by number of interactions (see also Supplementary Fig. 10). EG Analysis of the TCGA lung adenocarcinoma cohort. E Correlation of ssGSEA enrichment scores based on marker genes of selected microenvironmental cell clusters and tumor cell signatures; n = 533, Spearman’s correlation statistics, linear regression line. F Kaplan–Meier overall survival curves, cases grouped by the ratio of ssGSEA enrichment scores of indicated microenvironmental cell clusters or tumor cell signatures or a combined signature encompassing all cell clusters of the N³MC or CP²E pattern, respectively; n = 524, log-rank statistics. G Proportion of patients with oncogenic mutations and tumor mutational burden (TMB), patients grouped by ratio of ssGSEA enrichment scores of the combined signature in (F); n = 525 for mutations, Chi-squared test, n = 242 for TMB, two-sided Welch’s t test. H Schematic representation of subtypes of lung adenocarcinoma characterized by different grades of tumor epithelial cell differentiation and different composition of the corresponding tumor microenvironment.

References

    1. Bray F, Ferlay J, Soerjomataram I, Siegel RL, Torre LA, Jemal A. Global cancer statistics 2018: GLOBOCAN estimates of incidence and mortality worldwide for 36 cancers in 185 countries. CA Cancer J Clin. 2018;68:394–424. - PubMed
    1. Wakelee HA, Chang ET, Gomez SL, Keegan TH, Feskanich D, Clarke CA, et al. Lung cancer incidence in never smokers. J Clin Oncol. 2007;25:472–8. - PMC - PubMed
    1. Cancer Genome Atlas Research N. Comprehensive molecular profiling of lung adenocarcinoma. Nature. 2014;511:543–50. - PMC - PubMed
    1. Hirsch FR, Scagliotti GV, Mulshine JL, Kwon R, Curran WJ, Jr, Wu YL, et al. Lung cancer: current therapies and new targeted treatments. Lancet. 2017;389:299–311. - PubMed
    1. Memon H, Patel BM. Immune checkpoint inhibitors in non-small cell lung cancer: a bird’s eye view. Life Sci. 2019;233:116713. - PubMed

Publication types

MeSH terms

Substances