. 2022 Feb;40(2):209-217.
doi: 10.1038/s41587-021-01021-3. Epub 2021 Oct 18.

Unannotated proteins expand the MHC-I-restricted immunopeptidome in cancer

Affiliations

Unannotated proteins expand the MHC-I-restricted immunopeptidome in cancer

Tamara Ouspenskaia et al. Nat Biotechnol. 2022 Feb.

Abstract

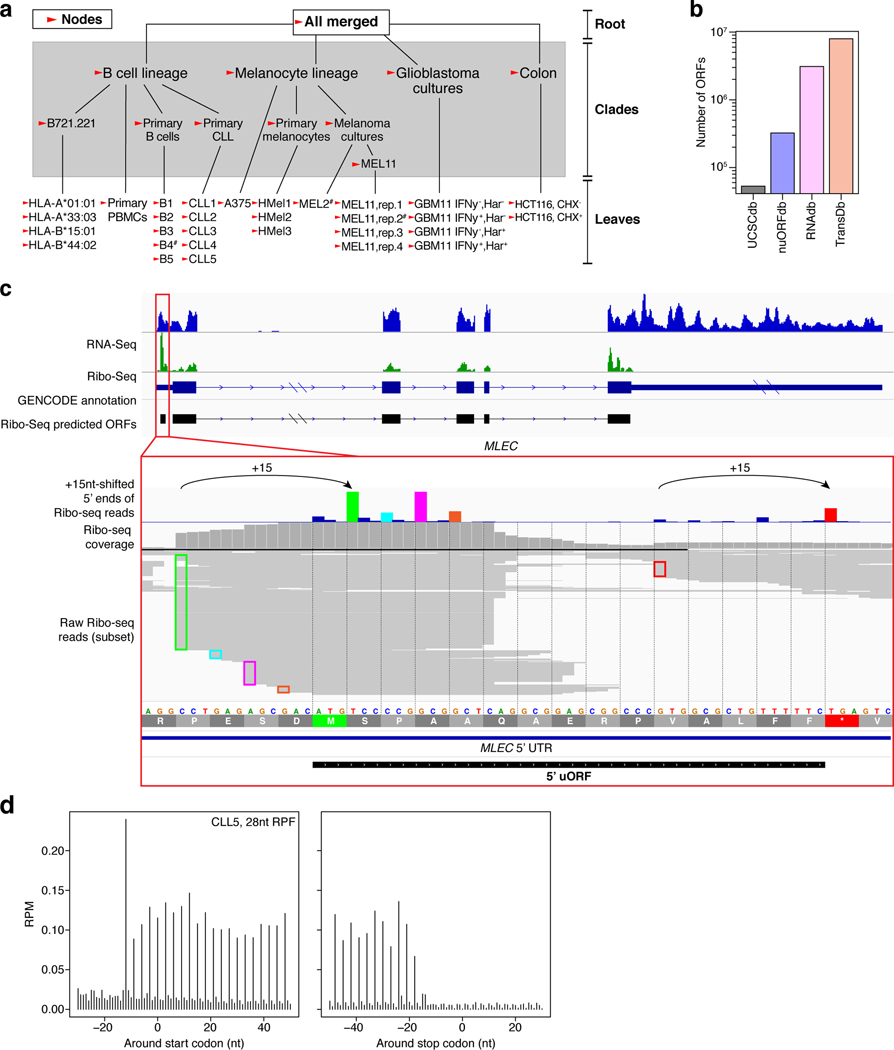
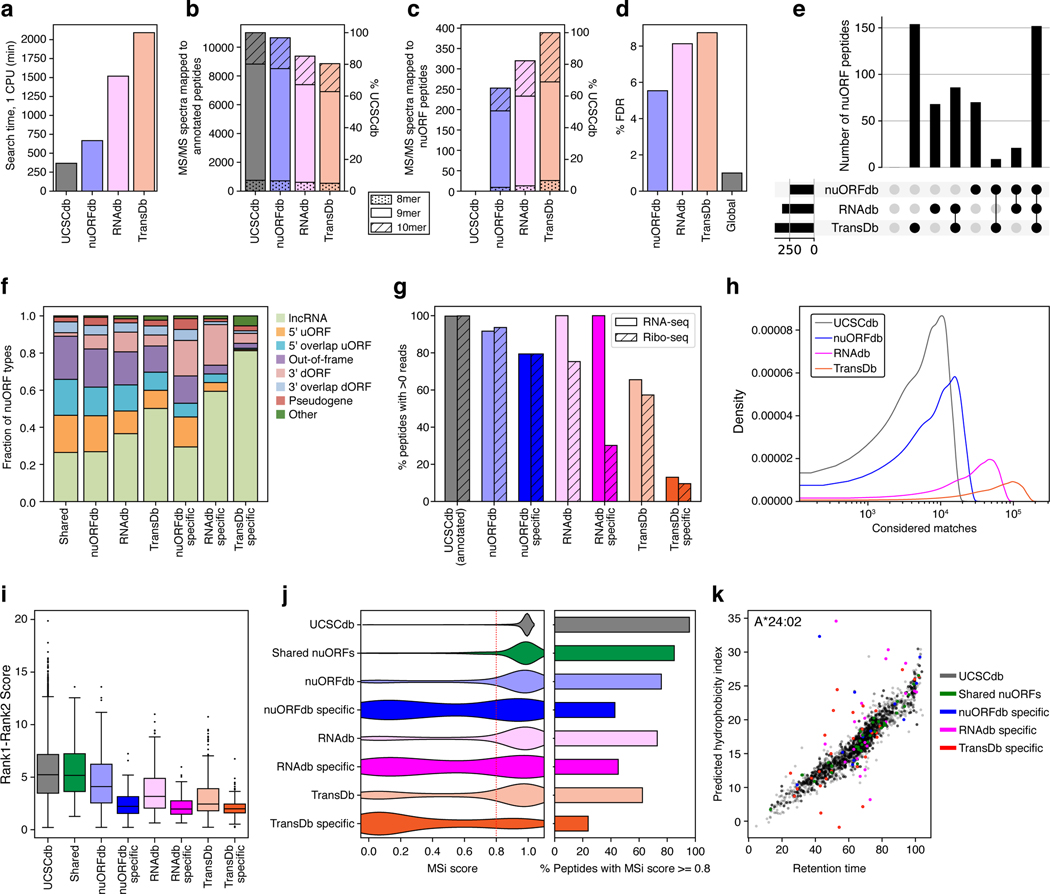
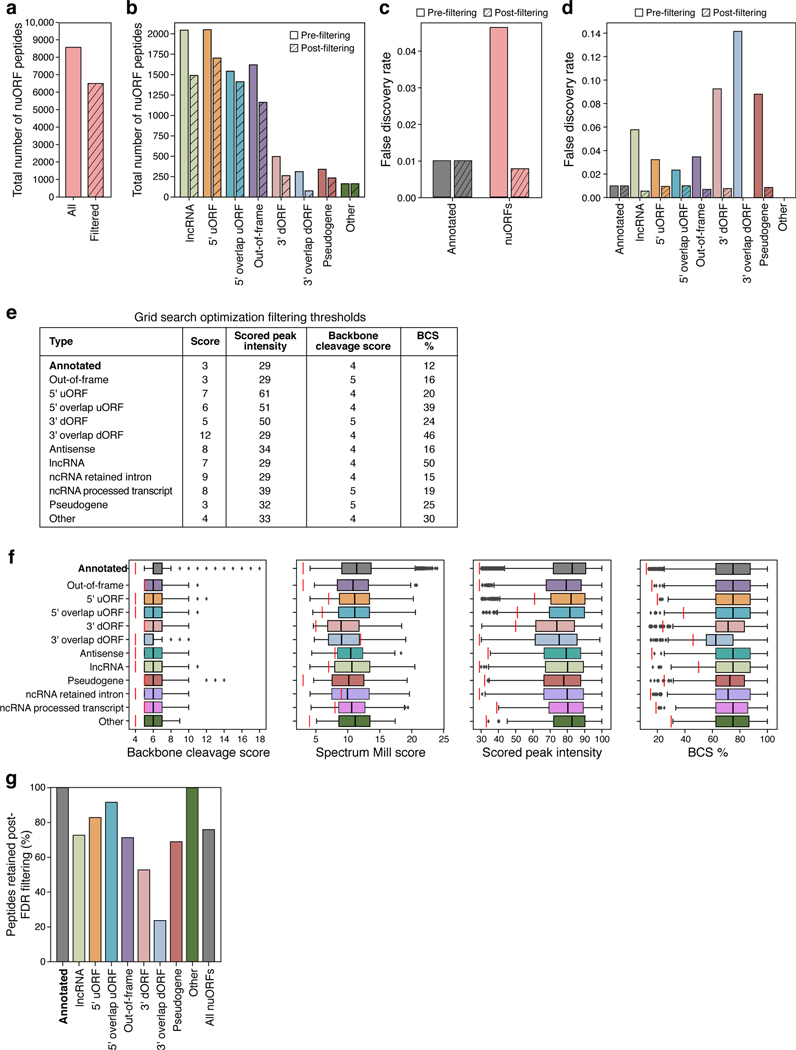
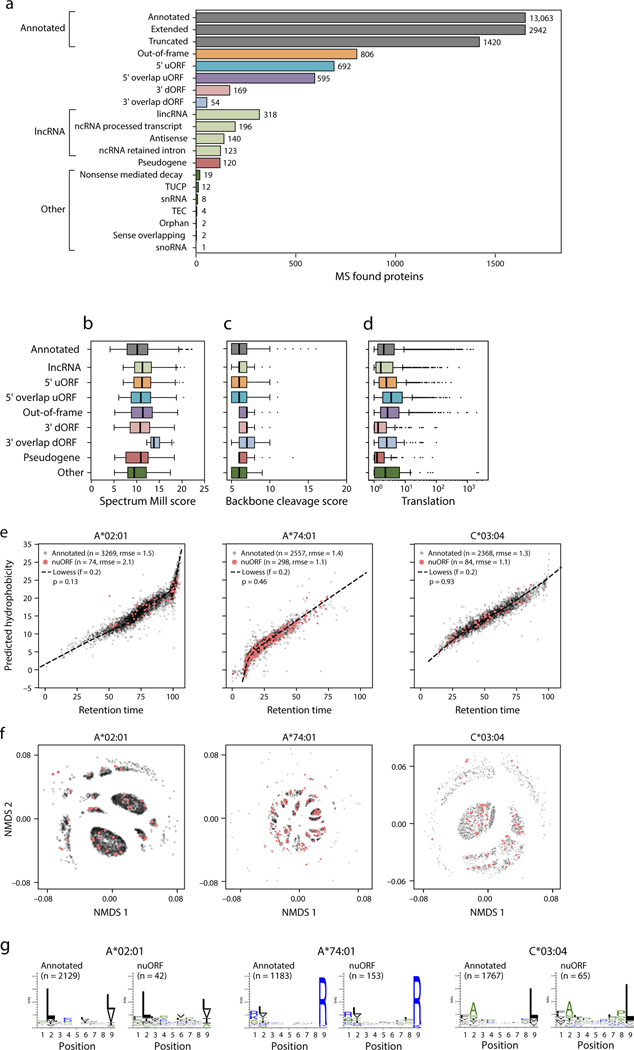
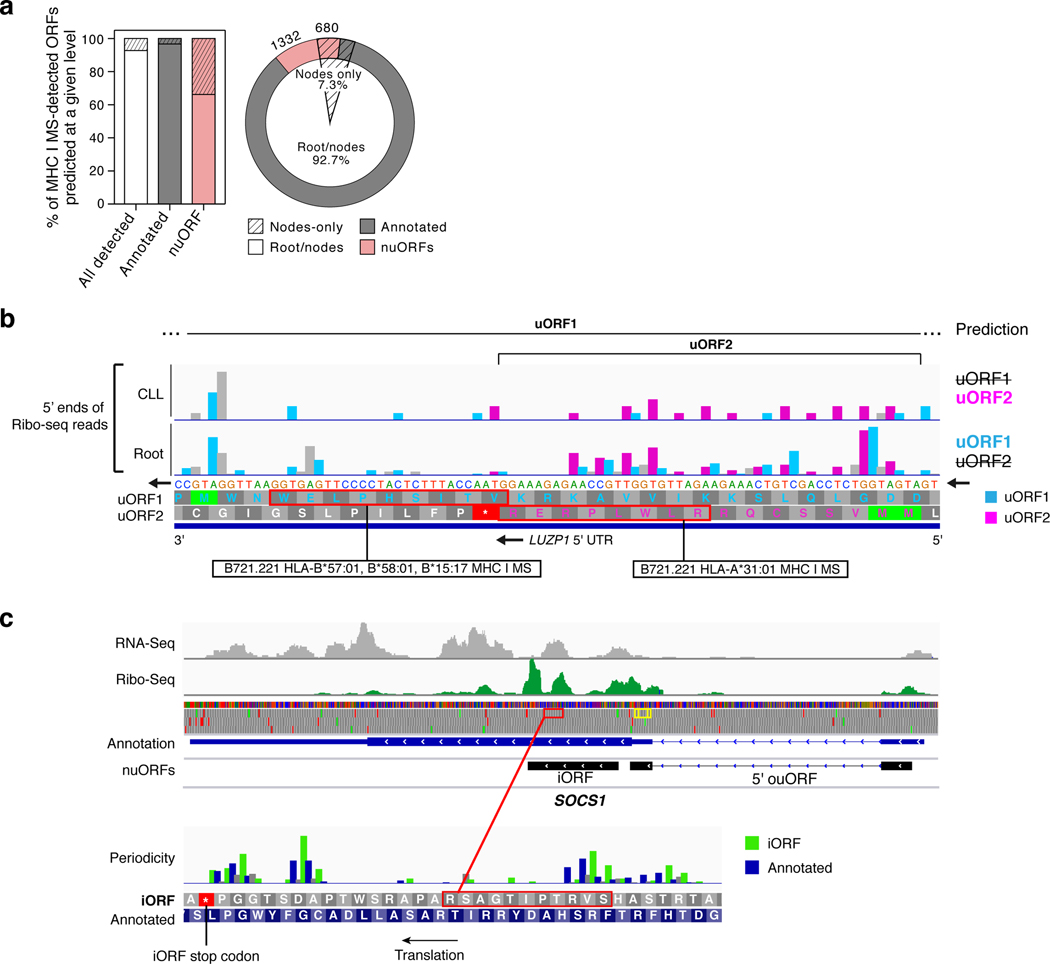
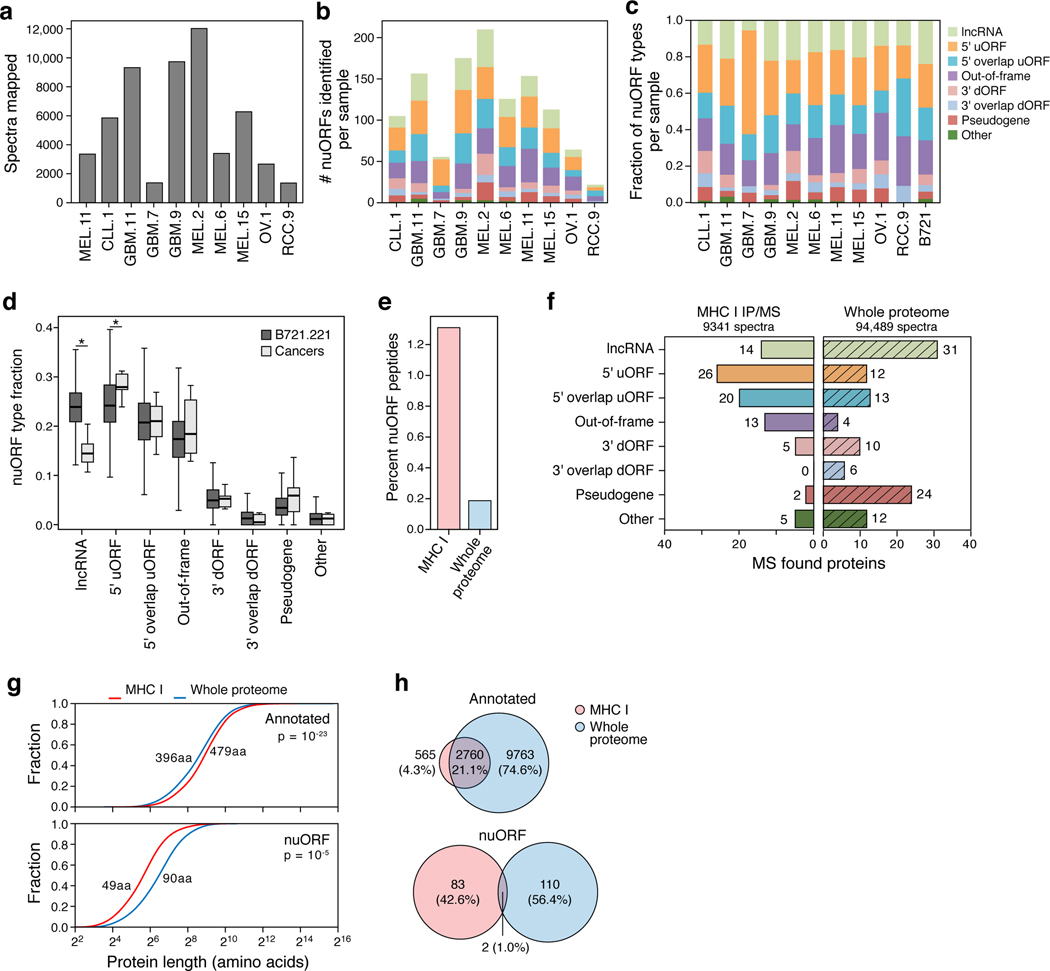
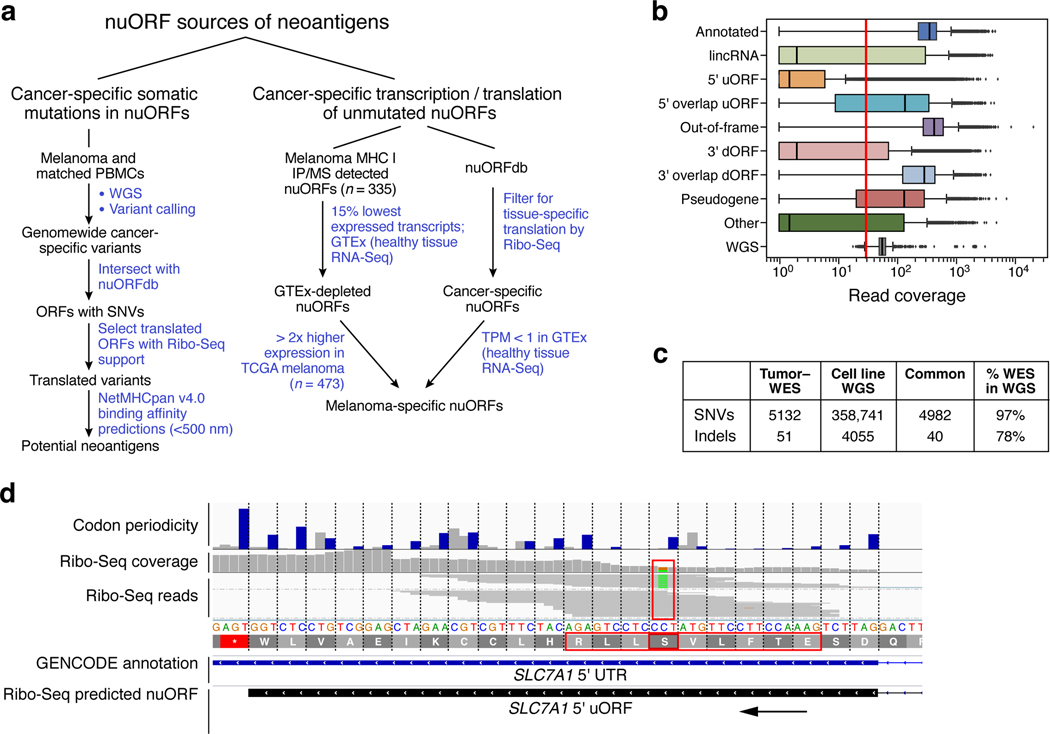
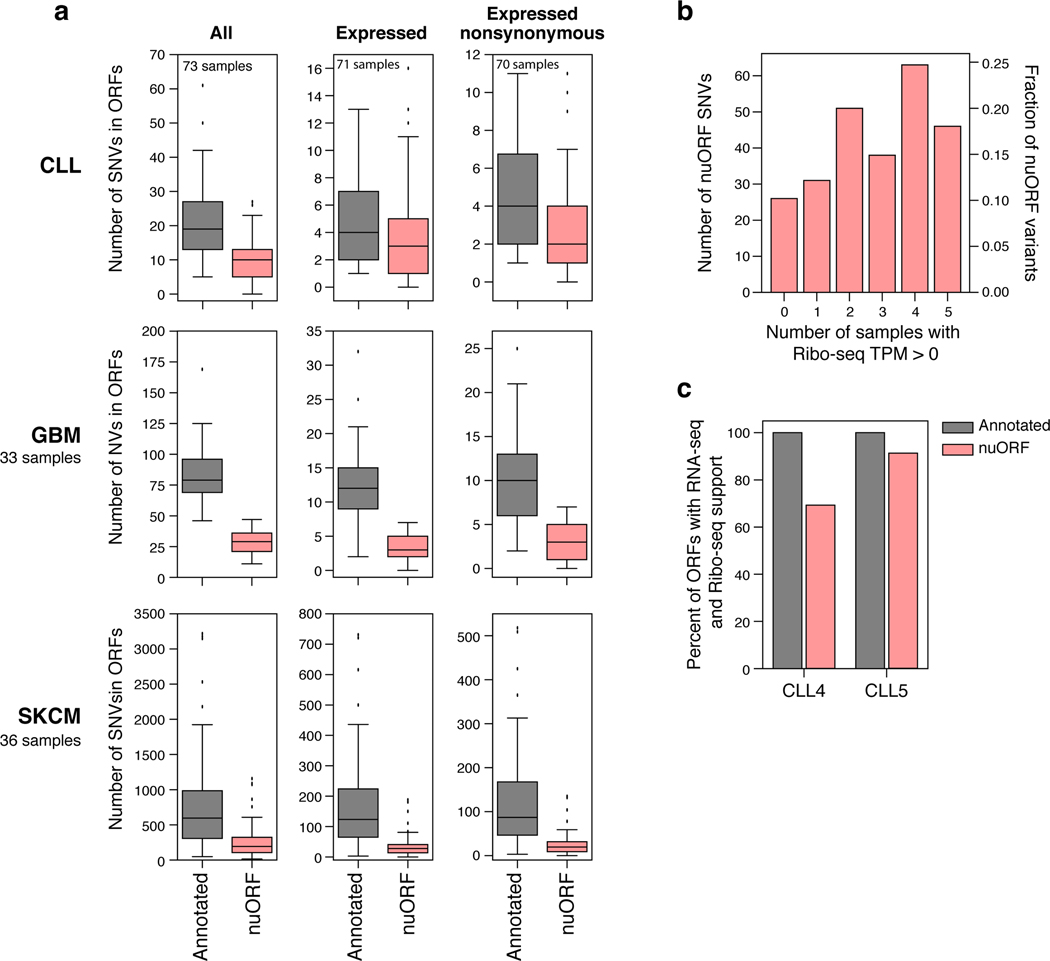
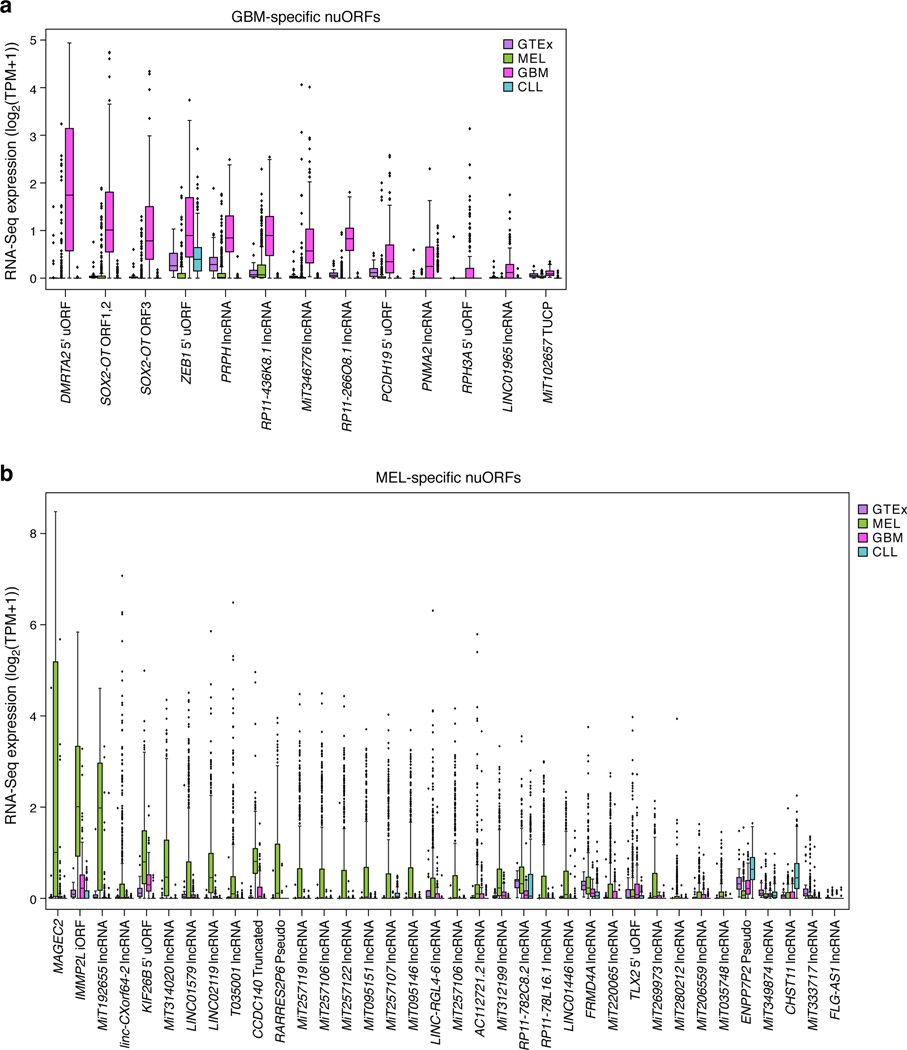
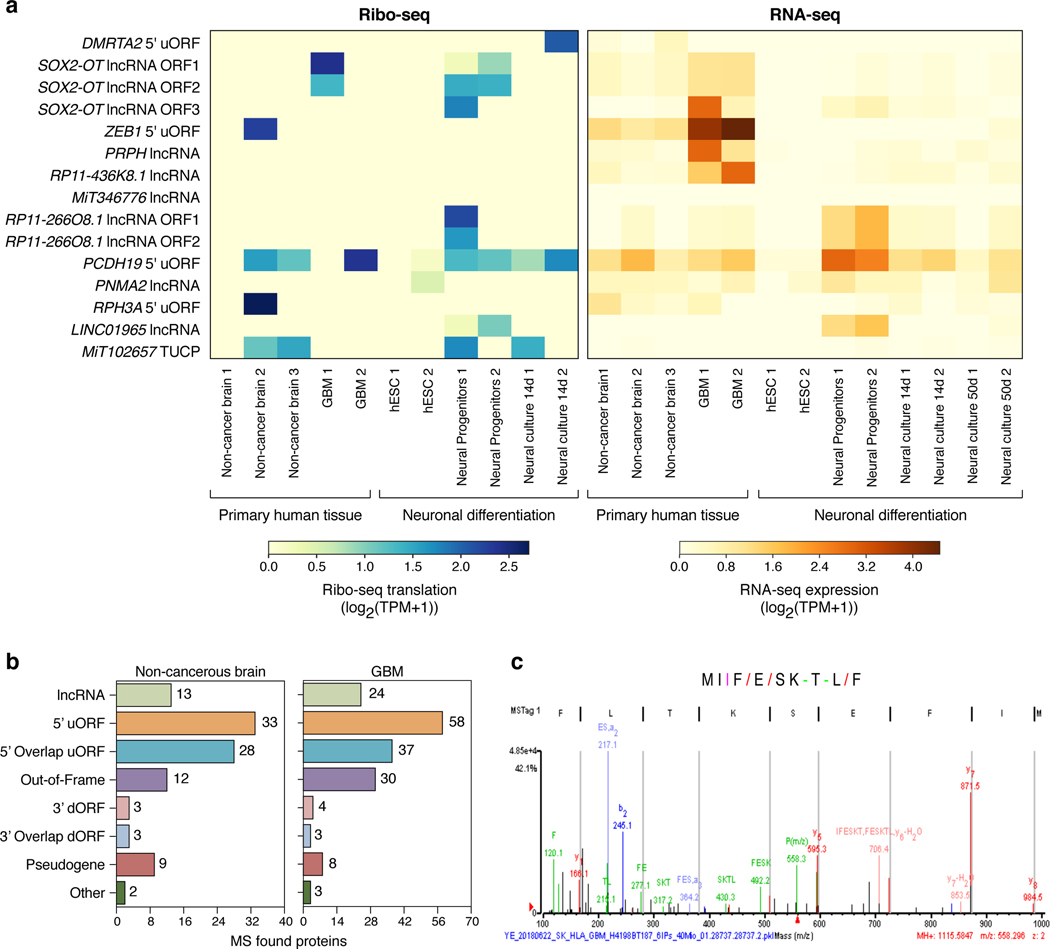
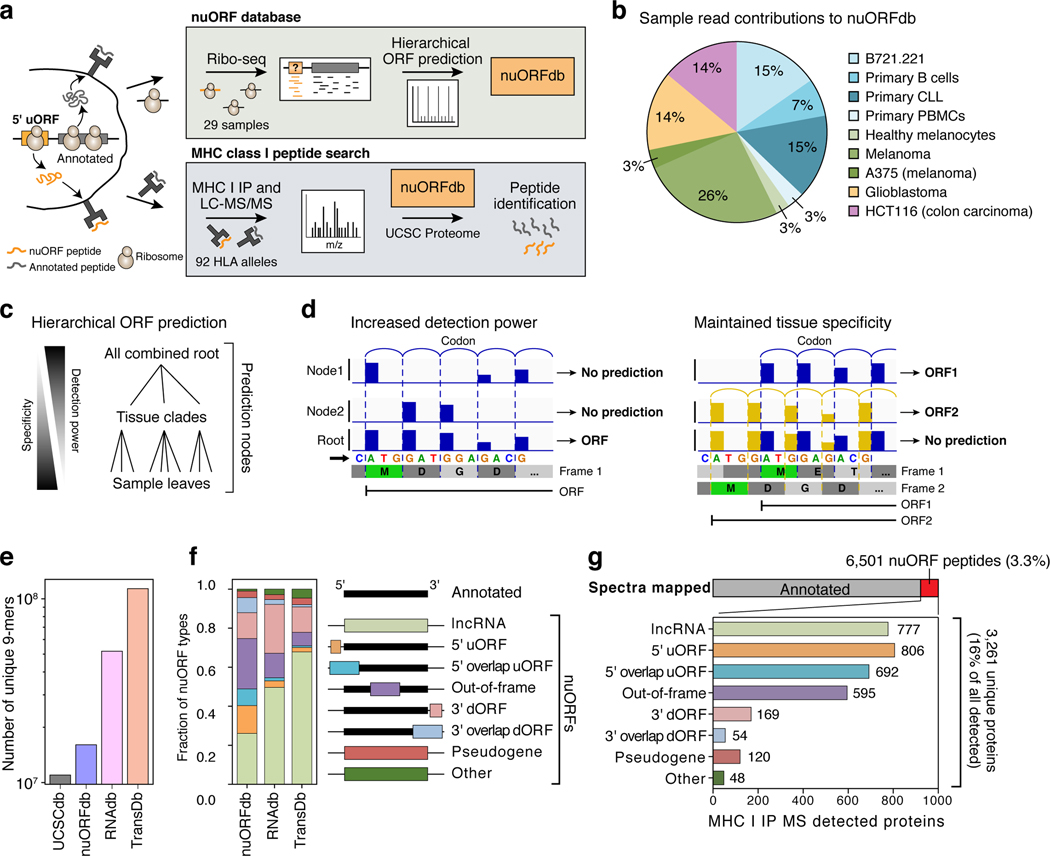
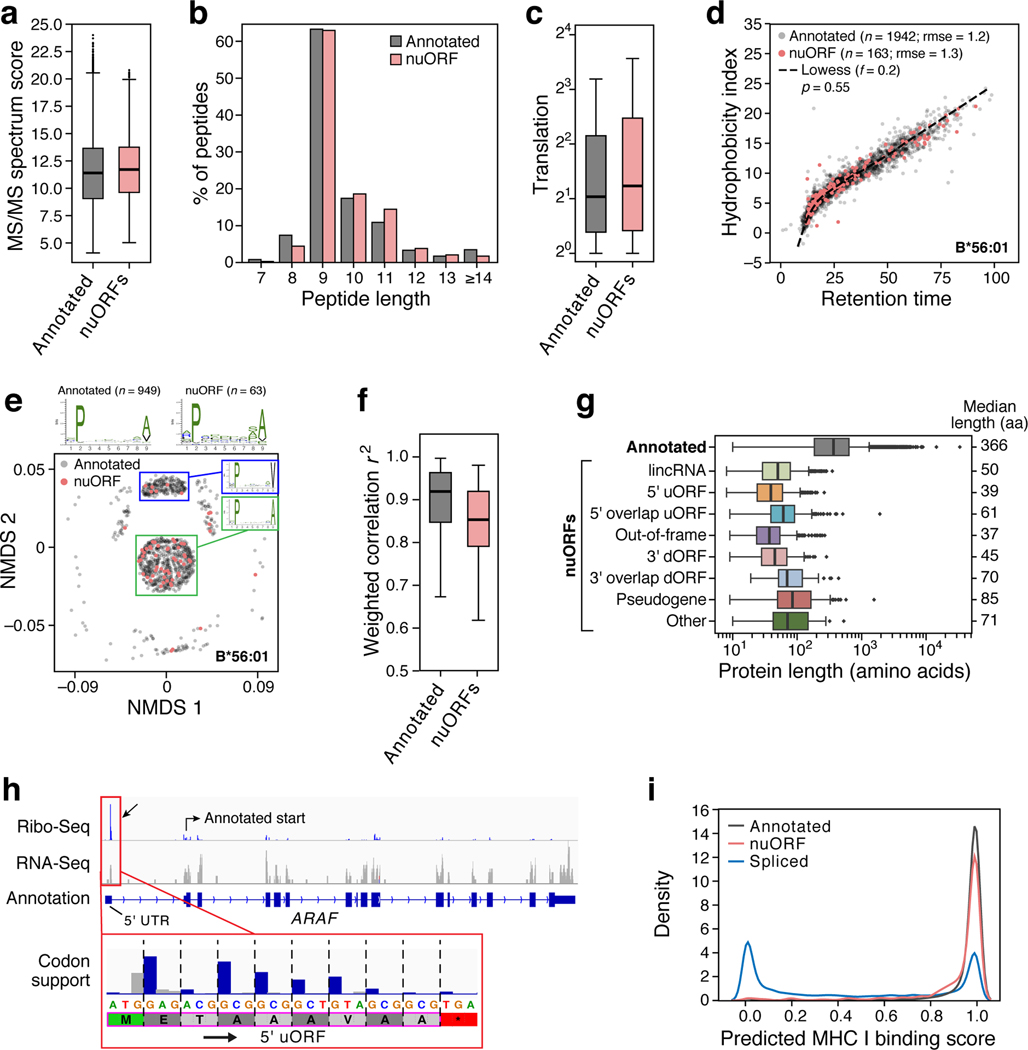
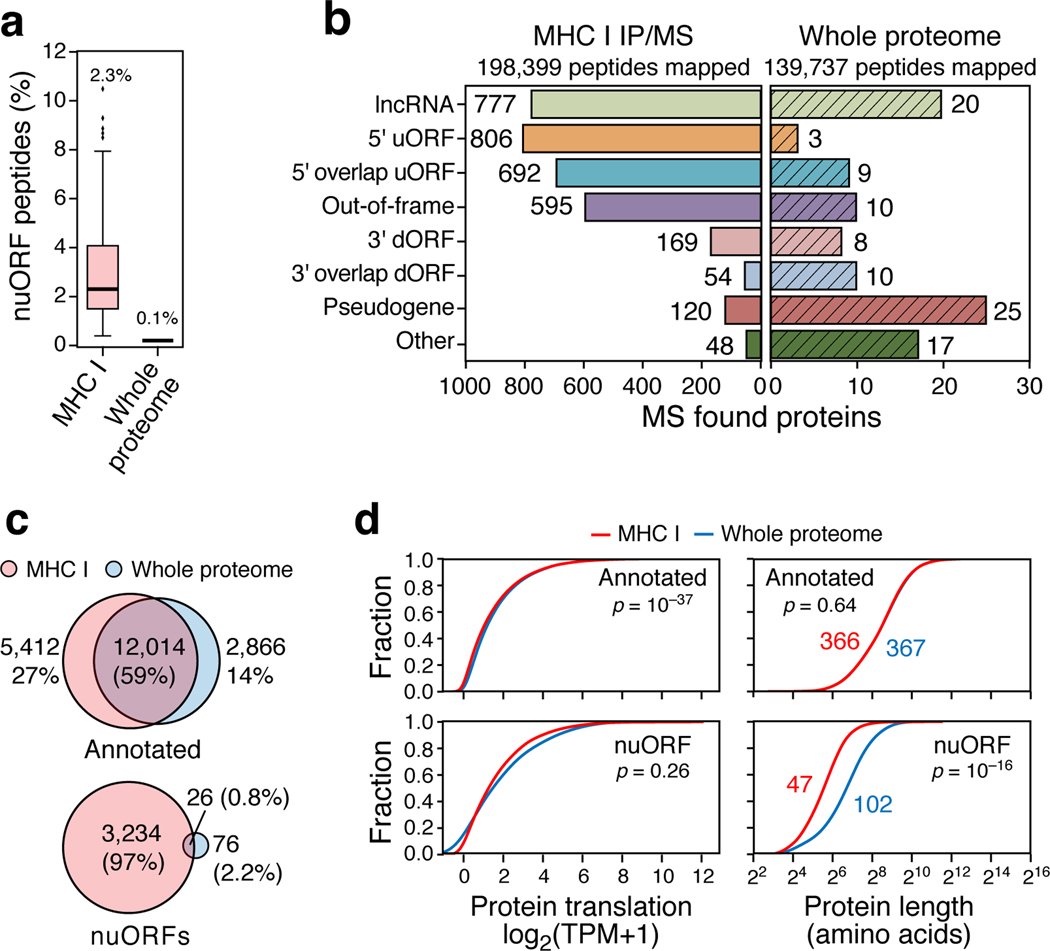
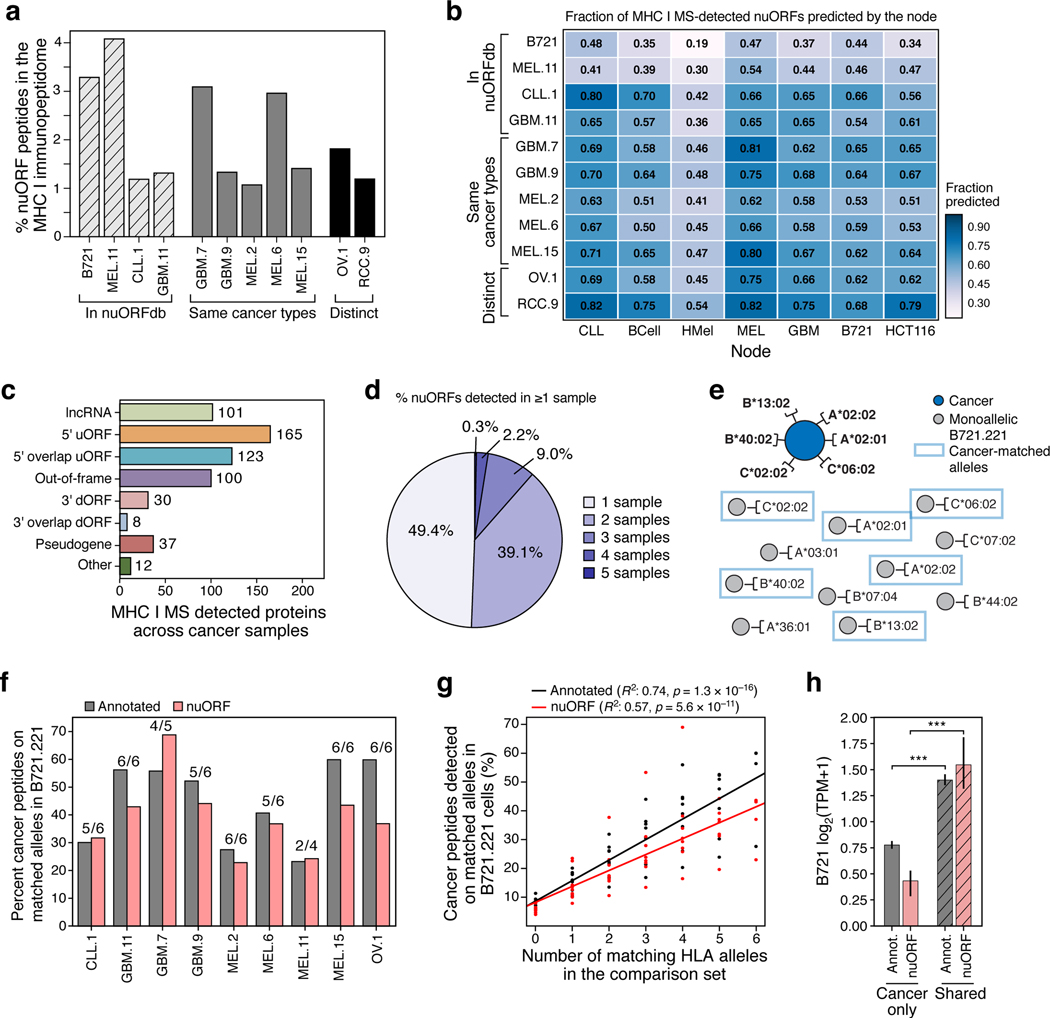
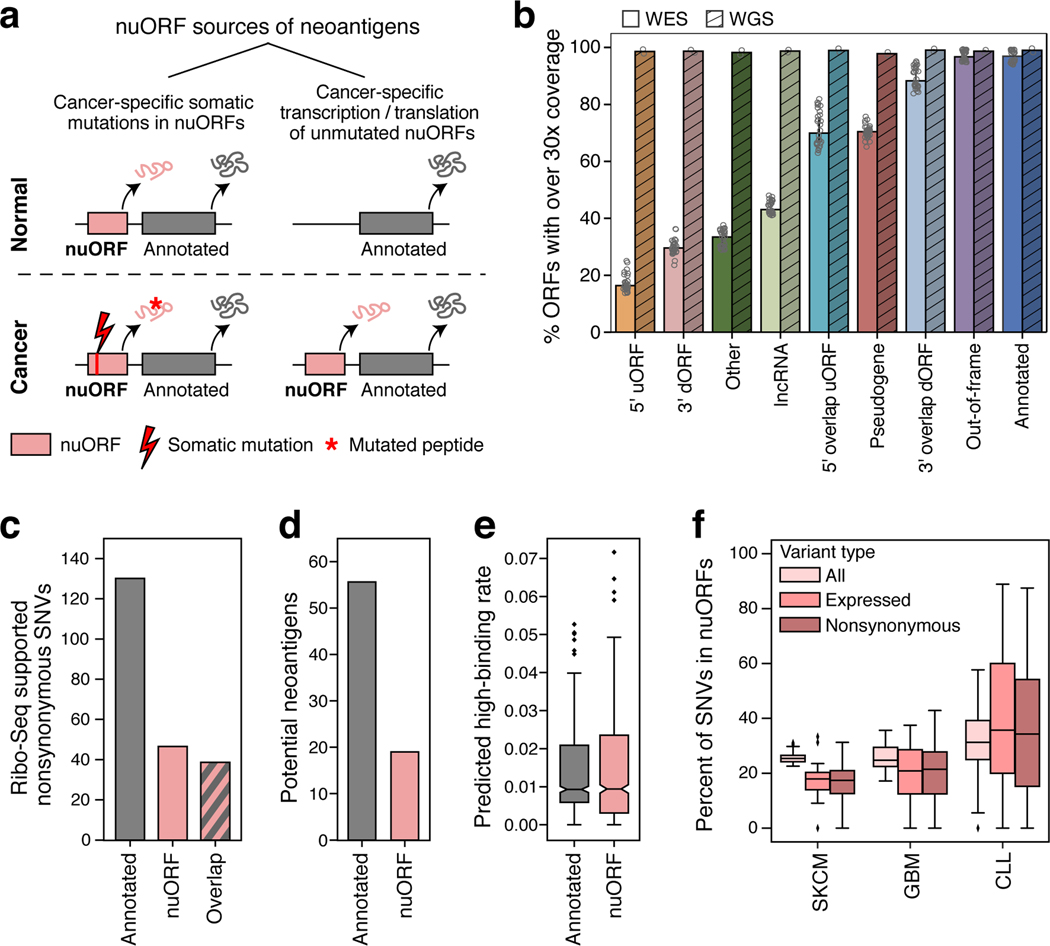
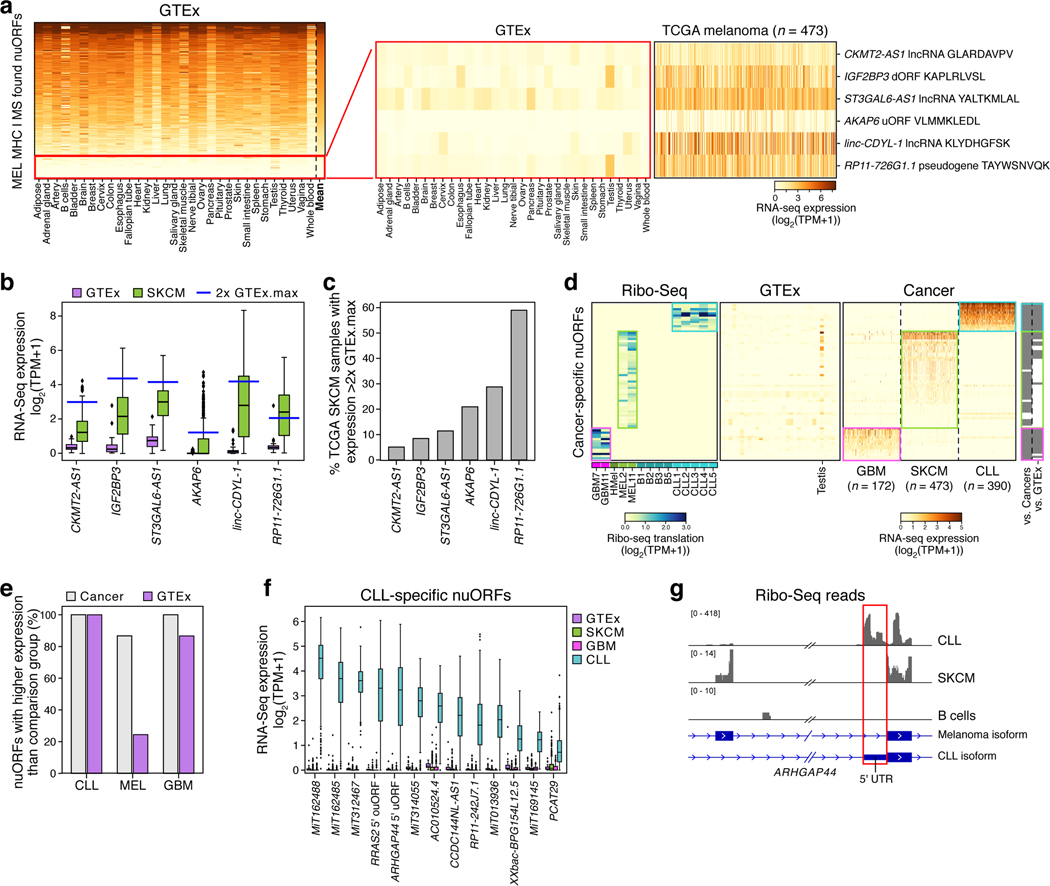
Tumor-associated epitopes presented on MHC-I that can activate the immune system against cancer cells are typically identified from annotated protein-coding regions of the genome, but whether peptides originating from novel or unannotated open reading frames (nuORFs) can contribute to antitumor immune responses remains unclear. Here we show that peptides originating from nuORFs detected by ribosome profiling of malignant and healthy samples can be displayed on MHC-I of cancer cells, acting as additional sources of cancer antigens. We constructed a high-confidence database of translated nuORFs across tissues (nuORFdb) and used it to detect 3,555 translated nuORFs from MHC-I immunopeptidome mass spectrometry analysis, including peptides that result from somatic mutations in nuORFs of cancer samples as well as tumor-specific nuORFs translated in melanoma, chronic lymphocytic leukemia and glioblastoma. NuORFs are an unexplored pool of MHC-I-presented, tumor-specific peptides with potential as immunotherapy targets.


Conflict of interest statement

Competing interests

A.R. is a founder and equity holder of Celsius Therapeutics, an equity holder in Immunitas Therapeutics and until August 31, 2020 was an SAB member of Syros Pharmaceuticals, Neogene Therapeutics, Asimov and ThermoFisher Scientific. From August 1, 2020, A.R. is an employee of Genentech. C.J.W and N.H. were co-founders, equity holders, and SAB members of Neon Therapeutics, Inc until May 2020, and now are equity holders of BionTech, Inc. D.B.K. has previously advised Neon Therapeutics, and has received consulting fees from Guidepoint, Neon Therapeutics, System analytic Ltd and The Science Advisory Board. T.O. owns equity in BioNTech, Moderna, Gilead, Novartis, Roche, 10x Genomics and Illumina. From August 3, 2020, T.O. is an employee of Flagship Labs 69. D.B.K. owns equity in Aduro Biotech, Agenus Inc., Armata pharmaceuticals, Breakbio Corp., Biomarin Pharmaceutical Inc., Bristol Myers Squibb Com., Celldex Therapeutics Inc., Editas Medicine Inc., Exelixis Inc., Gilead Sciences Inc., IMV Inc., Lexicon Pharmaceuticals Inc., and Stemline Therapeutics Inc. P.B. owns equity in Amgen Inc, Breakbio Corp., and Stemline Therapeutics Inc. S.A.S. has previously advised Neon Therapeutics and has received consulting fees from Neon Therapeutics. S.A.S. owns equity in Agenus Inc., Agios Pharmaceuticals, 152 Therapeutics, Breakbio Corp., Bristol-Myers Squibb and NewLink Genetics. S.A.C. is a SAB member of Kymera, PTM BioLabs and Seer and a scientific advisor to Pfizer and Biogen. T.O., T.L., K.R.C., S.K., N.H., D.B.K., S.A.C., C.J.W., and A.R. are co-inventors on PCT/US2019/066104 directed to neoantigens and methods for identifying neoantigens as described in this manuscript.

Figures

Extended Data Fig. 1 |
Extended Data Fig. 1 |. nuORFdb characteristics.
a. Hierarchical ORF prediction. Tree showing individual samples (leaves), combinations of samples (clades) and entire datasets of all reads (root) representing the nodes used to make ORF predictions (arrowheads). #: samples used in nuORFdb construction, but later discovered to be of poor quality and not used in any subsequent analyses; CHX: samples pre-treated with cycloheximide; Harr: samples pretreated with harringtonine, IFNy: samples pre-treated with interferon gamma. b. NuORFdb size relative to the annotated proteome, RNA-seq- and transcriptome-based databases. Number of ORFs (y axis) across four databases (x axis). c-d. Ribo-seq reveals mRNA reading frames. c. RNA-seq (blue) and Ribo-seq (green) reads aligned to the transcript of the MLEC gene. RNA-seq reads align to the entire length of the transcript, while Ribo-seq reads align exclusively to the translated portions. Ribo-seq supports translation of a 5’ uORF (red box, top).Histogram of +15nt-shifted 5’ ends of Ribo-seq reads supporting translation of the MLEC 5’ uORF (colorful) with corresponding full-length aligned reads below. 5’ ends of full-length reads are outlined in colors matching their +15nt-shifted positions in the histogram (bottom). d. Histogram of 5’ ends of Ribo-seq reads supporting translation of annotated protein-coding ORFs at every third nucleotide (x axis) around the start codon (left) and the stop codon (right). The –12 position of the first peak indicates the placement of the ribosome at the start codon (position 0), which is computationally adjusted to +3 by adding +15nt to each 5’ end read location, as shown in (c).
Extended Data Fig. 2 |
Extended Data Fig. 2 |. nuORFdb benchmarking.
a. Spectra search times (y axis) for the HLA-A*02:01 sample with different databases (x axis). b-c. nuORFdb minimizes the loss of sensitivity for annotated peptides, while enabling discovery of nuORF peptides. Number of annotated peptides (b) and nuORF peptides (c) discovered (y axis) across four databases (x axis). d. nuORFdb spectra mapping has the lowest % FDR among the three databases. %FDR for nuORF peptides (y axis) across databases (x axis). Global FDR for all peptides was set to 1%. e. nuORF peptides are discovered across multiple databases. Number of nuORF peptides unique to or shared across databases (y axis), as indicated by the black circles below (x axis). Bars on the bottom left indicate the total number of nuORF peptides discovered using each database. f. Ratios of nuORF types discovered vary depending on the database used for spectra mapping. Proportion of nuORFs of different types (y axis) in the set of nuORFs discovered by all three databases (Shared), using each database, or those specific to each database and not found by others (x axis). g. ORFs discovered using different databases vary in RNA-seq and Ribo-seq read coverage. Percent of annotated (UCSCdb) or nuORF (other databases) peptides with >0 reads (y axis) discovered using the four databases, or discovered uniquely by a database (x axis). h-k. MS spectrum mapping to the correct peptide sequence is more challenging using RNAdb and TransDb. h. Distribution of the number of considered matches for each spectrum across four databases. i. Difference between Spectrum Mill score for the top ranked (Rank1) and second best (Rank2) peptide sequences (y axis) across databases (x axis). n = 11007 (UCSC), 155 (Shared), 253 (nuORFdb), 68 (nuORFdb specific), 320 (RNAdb), 64 (RNAdb specific), 389 (TransDb), 149 (TransDb specific). Median, with 25% and 75% (box range), and 1.5 IQR (whiskers) are shown. j. Distribution of the HLAthena-predicted binding score (MSi) (left) and percent of peptides with MSi score >= 0.8 (red line on the left) (x axis) across databases (y axis). k. Predicted hydrophobicity index (y axis) and retention time (x axis) of peptides discovered using different databases for the HLA-A*24:02 sample.
Extended Data Fig. 3 |
Extended Data Fig. 3 |. Additional filtering of MHC I IP, MS/MS-detected nuORF peptides.
a-d. Impact of filtering on nuORF number, types and false discovery rates. a,b. Total number of nuORF peptides (y axis) identified pre-filtering (solid bars) and retained post-filtering (hashed bars) overall (a) and for different nuORF types (x axis, b). c,d. False discovery rate (y axis) for annotated (gray) and nuORF (pink) peptides across 92 HLA alleles pre- and post- filtering (hashed) overall (c) and for different ORF types (x axis, d). e. Criteria used to filter peptides across ORF types. f. Filtering thresholds across nuORF categories. Filter cutoffs (vertical red lines) across different peptide spectral match scoring features (x axis) for different ORF types (y axis). n = 191897 (annotated), 2050 (5’ uORF), 1619 (Out-of-frame), 1542 (5’ overlap uORF), 855 (lincRNA), 514 (ncRNA Processed Transcript), 497 (3’ dORF), 376 (ncRNA Retained Intron), 341 (Pseudogene), 311 (3’ overlap dORF), 299 (Antisense), 163 (Other). Median, with 25% and 75% (box range), and 1.5 IQR (whiskers) are shown. g. Filtering impact across categories. Percent of peptides (y axis) retained post-filtering across different ORF categories and overall (x axis).
Extended Data Fig. 4 |
Extended Data Fig. 4 |. nuORFs peptides in the MHC I immunopeptidome have comparable biochemical properties to annotated peptides.
a. MHC I immunopeptidome includes peptides from different nuORF categories. Number of unique proteins (x axis) detected by MHC I IP LC-MS/MS across expanded ORF types (y axis). b-g. Comparable biochemical features of nuORF and annotated peptides. b. Distribution of LC-MS/MS Spectrum Mill identification score (x axis) for annotated and nuORF peptides across ORF types (y axis). c. Peptide fragmentation score (x axis) for peptides identified across ORF types (y axis). d. Ribo-seq translation levels (x axis, log2(TPM+1)) of MHC I MS-detected ORFs across various ORF types (y axis). For all boxplots, n = 17426 (annotated), 806 (5’ uORF), 776 (lncRNA), 692 (5’ overlap uORF), 595 (Out-of-frame), 169 (3’ dORF), 120 (Pseudogene), 54 (3’ Overlap dORF), 48 (Other); median, with 25% and 75% (box range), and 1.5 IQR (whiskers) are shown. e. Predicted hydrophobicity index (y axis) against the LC-MS/MS retention time (x axis) for annotated (grey) and nuORF (pink) peptide sequences for three representative HLA alleles. Dashed line: Lowess fit to the annotated peptides. Sample sizes, root mean square errors (rmse), and p-values (rank-sum test on residuals) are marked. f,g. Similar sequence motifs in nuORFs and annotated peptides. f. Non-metric multidimensional scaling (NMDS) plot of all MHC IP LC-MS/MS-detected annotated and nuORF 9 AA peptide sequences clustered by peptide sequence similarity for three representative HLA alleles. g. Consensus peptide sequence motif plots of all MHC IP LC-MS/MS-detected annotated and nuORF 9 AA peptide sequences.
Extended Data Fig. 5 |
Extended Data Fig. 5 |. Hierarchical ORF prediction based on Ribo-seq identifies short, overlapping, tissue-specific nuORFs.
a. nuORFs predictions are more sample and tissue specific than annotated ORFs. Proportion of annotated ORFs (grey) and nuORFs (pink) in the MHC I immunopeptidome (y axis, and pie chart). Hashed: proportion predicted only at the leaf and clade level, but not at the root. b. Two overlapping, MHC I MS-detected 5’ uORFs in LUZP1 as an example of tissue-specific, overlapping nuORFs identified by hierarchical ORF prediction. uORF2 (pink) was predicted in the CLL clade, and not at the root. uORF1 (cyan) was predicted at the root and not in the CLL clade. Detected peptides outlined in red with the HLA alleles where peptides were detected marked below. c. SOCS1 gene as an example of identification of short, overlapping nuORFs. SOCS1 gene encodes three translated proteins: the annotated ORF, an out-of-frame iORF, and a 5’ overlap ouORF. Two MHC I MS-detected peptides from 5’ ouORF outlined in yellow. Detected iORF peptide outlined in red and shown in higher magnification below. Bottom: Histogram of Ribo-seq reads supporting translation of the annotated ORF (blue) and the out-of-frame iORF (green).
Extended Data Fig. 6 |
Extended Data Fig. 6 |. nuORF peptides in the MHC I immunopeptidome and whole proteome of cancer cells.
a. nuORFdb helps map immunopeptidome even from samples and tumor types not used in constructing the reference. Total number of MHC I LC-MS/MS spectra mapped (y axis) across cancer samples (x axis). b-d. nuORFs of various types were detected in the MHC I immunopeptidome of cancer samples. Number (b) and proportion (c) of nuORFs (y axis) of different types identified in each cancer sample (x axis). d. Distribution of the fraction (y axis) of nuORF types (x axis) in B721.221 cells (dark grey) or across cancer samples (light grey). Asterisk: p < 0.05 (lncRNA p = 5 × 10⁻⁶, 5′ uORF p = 0.03; two-sided rank-sum test. n = 10 cancer samples, n = 100000 random samplings across alleles. Median, with 25% and 75% (box range), and 1.5 IQR (whiskers) are shown. e-h. nuORFs are more abundant in the MHC I immunopeptidome than in the whole proteome. e. Percent of nuORF peptides (y axis) detected in the immunopeptidome (pink) and in the whole proteome (blue) of GBM11. f. Number of nuORFs (x axis) of different types (y axis) identified in the MHC I immunopeptidome (left) vs. whole proteome (hatched, right) in GBM11. g. Protein length (x axis, amino acids) of annotated (top) and nuORF (bottom) proteins detected in the MHC I immunopeptidome (pink) vs. in the whole proteome (blue). p-values: KS test. h. Proportion of all annotated ORFs (top) or nuORFs (bottom) detected in the whole proteome (blue), immunopeptidome (pink) or both (intersection) in GBM11.
Extended Data Fig. 7 |
Extended Data Fig. 7 |. nuORFs can be potential sources of neoantigens.
a. Approaches to identify potential nuORF-derived neoantigens. b. nuORFs have low sequence coverage by WES compared to WGS. Distribution of WES read coverage (x axis) across different ORF types (y axis). Bottom: WGS read coverage across all ORFs of all types. Vertical red line marks 30x coverage. n = 86421 (annotated), 61398 (lncRNA), 61248 (Out-of-frame), 33823 (5’ uORF), 31453 (3’ dORF), 20337 (5’ overlap uORF), 18316 (3’ overlap dORF), 7941 (Pseudogene), 2371 (Other), 323846 (WGS). Median, with 25% and 75% (box range), and 1.5 IQR (whiskers) are shown. c. Somatic variants in the melanoma patient-derived cell line reflect the variants detected in the original tumor. Cancer-specific SNVs and InDels identified by WES from the primary tumor and by WGS from the tumor-derived cell line. d. Ribo-seq can be used to identify translated variants. Example of a translated SLC7A1 5’ uORF with a cancer-specific SNV. Top: histogram of Ribo-seq reads supporting the translation of the 5’ uORF. Middle: Ribo-seq reads supporting translation of the mutant (green) and wild-type alleles. Predicted neoantigen outlined in red.
Extended Data Fig. 8 |
Extended Data Fig. 8 |. SNVs in nuORFs expand the potential neoantigen repertoire.
a. PCAWG-TCGA analysis of SNVs in annotated ORFs and nuORFs. Number of all, transcribed (RNA-seq support), and transcribed nonsynonymous SNVs (y axis) in annotated ORFs and nuORFs (x axis) in CLL, GBM, and SKCM. In CLL, 2/73 samples had no transcribed SNVs, and 3/73 patients had no transcribed nonsynonymous SNVs. n = 73 (CLL,All), 71 (CLL, Expressed), 70 (CLL, Expressed nonsynonymous), 33 (GBM), 36 (SKCM) independent samples. Median, with 25% and 75% (box range), and 1.5 IQR (whiskers) are shown. b. nuORFs with SNVs are translated in unrelated CLL samples. Number (left) and fraction (right) of transcribed nonsynonymous nuORF SNVs detected across 70 CLL samples (y axis) with Ribo-seq TPM > 0 in 0 or more unrelated CLL samples profiled by Ribo-seq (x axis). c. Transcription frequently indicates translation for annotated ORFs and nuORFs. Percent of annotated (grey) and nuORFs (pink) with RNA-seq and Ribo-seq support (y axis) in two CLL samples (x axis).
Extended Data Fig. 9 |
Extended Data Fig. 9 |. GBM and melanoma specific nuORFs.
a. RNA-seq expression (y axis, log2(TPM+1)) of GBM-specific nuORFs (x axis) in GTEx and tumor samples. b. Melanoma-specific nuORFs. RNA-seq expression (y axis, log2(TPM+1)) of melanoma-specific nuORFs (x axis) in GTEx and tumor samples. For all boxplots, n = 390 (CLL), 172 (GBM), 473 (SKCM), 10 donors/tissue across 31 tissues (GTEx). Median, with 25% and 75% (box range), and 1.5 IQR (whiskers) are shown.
Extended Data Fig. 10 |
Extended Data Fig. 10 |. GBM nuORFs.
a. Some nuORFs predicted to be GBM-specific are translated in non-cancerous samples. RNA-seq and Ribo-seq expression (log2(TPM+1)) of nuORFs predicted to be GBM-specific (y axis) in published primary GBM and non-cancer brain samples and differentiating hESCs (x axis). b. nuORFs are detected in published GBM and non-cancerous MHC I immunopeptidomes. Number of MS-detected nuORFs (x axis) of different types (y axis) in GBM (right) and non-cancerous brain (left) samples. c. LC-MS/MS spectrum of a peptide from SOX2-OT nuORF.
Figure 1.
Figure 1.. Thousands of nuORFs from Ribo-seq are translated and contribute peptides to the MHC I immunopeptidome.
a. Schematic overview of nuORF database generation using Ribo-seq and hierarchical ORF prediction followed by nuORF peptide identification in MHC I immunopeptidomes. b. Sample read contribution to nuORFdb shown as percent of Ribo-seq reads contributed by each tissue type. c. Hierarchical ORF prediction approach. ORFs are predicted independently at multiple nodes from reads in each sample (leaves), multiple samples of the same tissue (clades) and all samples (root). d. Hierarchical prediction increases power while maintaining tissue specificity. Left: Pooling reads across samples allows ORF detection (bottom track) even when each sample alone will have insufficient reads (top two tracks). Right: Predicting in individual samples (top two tracks) detects overlapping ORFs. e,f. nuORFdb is manageable in size and comprehensive in nuORF representation. Number of unique 9 amino acid peptides (y-axis) (e) and fraction of nuORF types (y-axis) (f) in the databases (x-axis). Legend: Schematic of the location of nuORFs by type within transcripts relative to the annotated ORF. g. Diverse nuORFs contribute to the MHC I immunopeptidome. Top: Percent of MS/MS spectra mapped to nuORF peptides (red) identified in the MHC I immunopeptidome of 92 HLA mono-allelic B721.221 samples. Bottom: The number of detected nuORFs (x-axis) of various types (y-axis).
Figure 2.
Figure 2.. nuORFs peptides in the MHC I immunopeptidome have comparable biochemical properties to annotated ORFs.
a-g. Comparable features of nuORFs and annotated peptides. a. LC-MS/MS Spectrum Mill identification score (y-axis) for nuORF (pink) and annotated (grey) peptides (mean scores: 11.7 nuORF, 11.4 annotated; 2.4% to 3.8% increase, linear regression 95% CI). b. Distribution of detected peptide length (x-axis) for nuORF (pink) and annotated (grey) peptides (median 9 AA for both). c. Ribo-seq translation levels (y-axis, log2(TPM+1)) of annotated proteins (grey) and nuORFs (pink) in B721.221 cells (means: 1.6 annotated, 1.7 nuORF, 5.8% to 11.7% increase, linear regression 95% CI ). d. Predicted hydrophobicity index (y axis) and retention time (x-axis) of annotated (grey) and nuORF (pink) peptides for the HLA-B*56:01 sample. Dashed line: Lowess fit to the annotated peptides, rmse:rank sum test. e. Similar sequence motifs in nuORFs and annotated peptides. NMDS plot of all 9 AA peptides (dots) identified in HLA-B56:01 from nuORF (pink) or annotated ORFs (grey). Sequence motif plots shown for all annotated, all nuORF, and two marked clusters. f. Entropy weighted correlation (y-axis) across all B721.221 HLA alleles between identified 9 AA annotated peptides and either down-sampled sets of annotated peptides, or nuORF peptides. g. nuORFs contributing peptides to the MHC I immunopeptidome are shorter than corresponding annotated proteins (t-test with unequal variance). Distribution of length (x-axis) of different nuORF classes and annotated proteins (y-axis) contributing peptides to the MHC I immunopeptidome. h. A 5’ uORF from ARAF detected in the MHC I immunopeptidome. Red box: magnified view of the 5’ uORF read coverage. Blue bars: in-frame reads, grey bars: out-of-frame reads. Magenta outline: LC-MS/MS detected peptide with periodicity plot showing strong read support for translation. i. Distribution of predicted MHC I binding scores for annotated peptides (grey), nuORF peptides (pink) and proteasomal spliced peptides from Faridi et al for 9 of our alleles (blue). For all boxplots (A,C,F,G): median, with 25% and 75% (box range), and 1.5 IQR (whiskers) are shown.
Figure 3.
Figure 3.. nuORFs in the immunopeptidome have distinct characteristics compared to those in the whole proteome.
a. Percent nuORFs (y-axis) in immunopeptidome across 92 HLA alleles (pink) or of the whole proteome (grey). Median, with 25% and 75% (box range), and 1.5 IQR (whiskers) are shown. b. Number of nuORFs (x-axis) of different categories (y-axis) detected in the immunopeptidome (left) or the whole proteome (right). c. Proportion of all annotated ORFs (top) or nuORFs (bottom) detected in the whole proteome (blue), immunopeptidome (pink) or both (intersection) in B721.221 cells. d. Cumulative distribution function plots of Ribo-seq translation levels (left, x-axis, log2(TPM+1)) or protein length (right, x-axis) for annotated ORFs (top) or nuORFs (bottom) in MHC I immunopeptidome (red) or the whole proteome (blue). P-values: KS test.
Figure 4.
Figure 4.. nuORF peptides in the MHC I immunopeptidome of cancer cells.
a-c. nuORFdb allows detection of nuORFs in the MHCI I immunopeptidome of samples and tumors types without prior Ribo-Seq data. a. Percent nuORF peptides detected in the MHC I immunopeptidome (y-axis) from primary CLL, GBM, melanoma (MEL), ovarian carcinoma (OV), and renal cell carcinoma (RCC) (x-axis). Hashed bars: Samples that contributed to nuORFdb. Grey bars: Same cancer types as in nuORFdb but from other patients. Black bars: Samples from tumor types not represented in nuORFdb. b. Fraction of MS/MS-detected nuORFs (colorbar) in each sample (rows) predicted by each node (columns). c. Number of nuORFs (x-axis) of different types (y axis) identified in the MHC I immunopeptidome across 10 cancer samples. d. More than half of nuORFs are detected in more than one sample. Percent of nuORFs detected in one or more samples, including all cancer samples and B721.221 cells. e-h. Identical peptide sequences are presented on the same HLA alleles in cancer and in B721.221 cells. e. Approach to analyze peptide overlap between cancer samples and B721.221 cells expressing the same HLA alleles. Dark blue circle: cancer sample with 6 known HLA alleles. Grey circles: HLA mono-allelic B721.221 cells. Blue boxes: B721.221 cells used in the overlap analysis expressing cancer-matched HLA alleles. f. Percent of annotated (grey) and nuORF (pink) peptides (y axis) detected in cancer immunopeptidomes (x-axis) that are also detected in HLA type-matched B721.221 samples. Number of available B721.221 sampled alleles over cancer sample’s known HLA alleles are shown above the bar. g. Percent of annotated (black) or nuORF (red) peptides (y-axis) detected in cancer MHC I immunopeptidomes that are also detected in 6 B721.221 mono-allelic samples with variable numbers of HLA-matched samples (x-axis). h. Median Ribo-seq translation levels (y-axis, log2(TPM+ 1)) of annotated ORFs (grey) and nuORFs (pink) exclusive to cancer samples or also detected in B721.221 cells (hashed) (t-test, Annotated: p = 10–109, nuORF: p = 10–13). Error bars: 95% CI.
Figure 5.
Figure 5.. nuORFs expand the potential mutated and non-mutated antigen repertoire in cancer.
a. Approaches to identify potential nuORF-derived neoantigens. b-f. Potential neoantigens from nuORFs with somatic mutations. b. Percent of ORFs with median ≥30x read coverage y-axis) by WES (n = 18 samples: primary melanoma and GBM and matched normal) and WGS (n = 2 samples: MEL11 and matched normal, hashed) for different types of ORFs (x-axis) (*p < 0.01, t-test). Error bars: 95% CI. c. Number of Ribo-seq supported, non-synonymous SNVs (y-axis) in MEL11 in annotated ORFs, nuORFs, or in both ORF types when they overlap. d. Number of high affinity (<500 nM, netMHCpan v4.0) potential neoantigens (y-axis) from annotated ORFs (grey) and nuORFs (pink) in MEL11. e. The rate of SNV-derived potential neoantigen peptides with high binding affinity (<500 nM, netMHCpan v4.0) (y-axis) from annotated ORFs (grey) and nuORFs (pink) across 1,170 netMHCpan v4.0 trained HLA alleles (means: 1.4% annotated, 1.6% nuORFs (0.1–0.3% higher, CI 95%)). f. PCAWG-TCGA analysis of somatic SNVs in nuORFs. Percent of SNVs (y-axis) overall (light pink), supported by RNA-seq (pink), and nonsynonymous, supported by RNA-seq (dark pink) in three cancer types (x-axis). Bottom: number of samples analyzed. For all boxplots (E,F): median, with 25% and 75% (box range), and 1.5 IQR (whiskers) are shown.
Figure 6.
Figure 6.. Cancer-enriched nuORFs are potential sources of cancer antigens.
a–c. MHC I MS/MS-detected nuORFs enriched in cancers may be potential sources of neoantigens. a. Expression level (log2(TPM+1)) of nuORFs (rows) detected in MHC I immunopeptidomes of 4 melanoma samples, ordered by mean expression (rightmost column) across all GTEx tissues (columns), except testis. Red box: nuORF at bottom 15% by mean expression (left), filtered for those expressed at least 2-fold higher than the maximum expression in GTEx in at least 5% of 473 melanoma samples in (TCGA) (right). b. Expression level (y-axis, log2(TPM+1)) of melanoma-enriched, MS/MS-detected nuORFs in GTEx (purple, n=10 donors/tissue across 31 tissues) and TCGA melanoma (green, n=473 donors) samples (x-axis). Blue line: 2x highest GTEx expression (testis excluded). c. Percent of TCGA melanoma samples (y-axis) with nuORF transcript (x-axis) expression greater than 2x highest GTEx expression. d–g. nuORFs specifically translated in cancers as potential sources of neoantigens. d. Left: Ribo-seq translation levels (log2(TPM+1)) of nuORFs (rows) exclusively translated in GBM (pink box), melanoma (green box) or CLL (teal box) samples (columns, left), with median expression < 1 TPM across GTEx tissues (columns, middle) (testis excluded), and their expression (log2(TPM+1)) in respective cancer samples (columns, right). Far right: Significantly higher expression (grey, p < 0.0001, rank-sum test) in expected cancer type vs. the other cancer types or vs. GTEx expression. e. Percent of nuORFs (y-axis) for each cancer type (x axis) with significantly higher expression (p < 0.0001, rank-sum test) in the expected cancer type than the other two cancer types (grey) or GTEx (purple) samples. f. Expression (y-axis, log2(TPM+1)) of CLL-specific nuORFs (x-axis) in CLL (teal, n=390 donors), GBM (pink, n=172 donors), melanoma (green, 473 donors), and GTEx (purple, n=10 donors/tissue across 31 tissues). g. CLL-specific ARHGAP44 5’ uORF (red box). Alternative transcript isoforms are translated in melanoma vs. CLL, and not translated in B cells. For all boxplots (B,F): median, with 25% and 75% (box range), and 1.5 IQR (whiskers) are shown.

References

    1. Hu Z, Ott PA & Wu CJ Towards personalized, tumour-specific, therapeutic vaccines for cancer. Nat. Rev. Immunol 18, 168–182 (2018). - PMC - PubMed
    1. Hilf N et al. Actively personalized vaccination trial for newly diagnosed glioblastoma. Nature 565, 240–245 (2019). - PubMed
    1. Keskin DB et al. Neoantigen vaccine generates intratumoral T cell responses in phase Ib glioblastoma trial. Nature 565, 234–239 (2019). - PMC - PubMed
    1. Ott PA et al. An immunogenic personal neoantigen vaccine for patients with melanoma. Nature (2017) doi:10.1038/nature22991. - DOI - PMC - PubMed
    1. Sahin U et al. Personalized RNA mutanome vaccines mobilize poly-specific therapeutic immunity against cancer. Nature 547, 222–226 (2017). - PubMed

Publication types