. 2021 Oct;3(10):1327-1341.
doi: 10.1038/s42255-021-00466-9. Epub 2021 Oct 18.

Fasting drives the metabolic, molecular and geroprotective effects of a calorie-restricted diet in mice

Affiliations

Fasting drives the metabolic, molecular and geroprotective effects of a calorie-restricted diet in mice

Heidi H Pak et al. Nat Metab. 2021 Oct.

Abstract

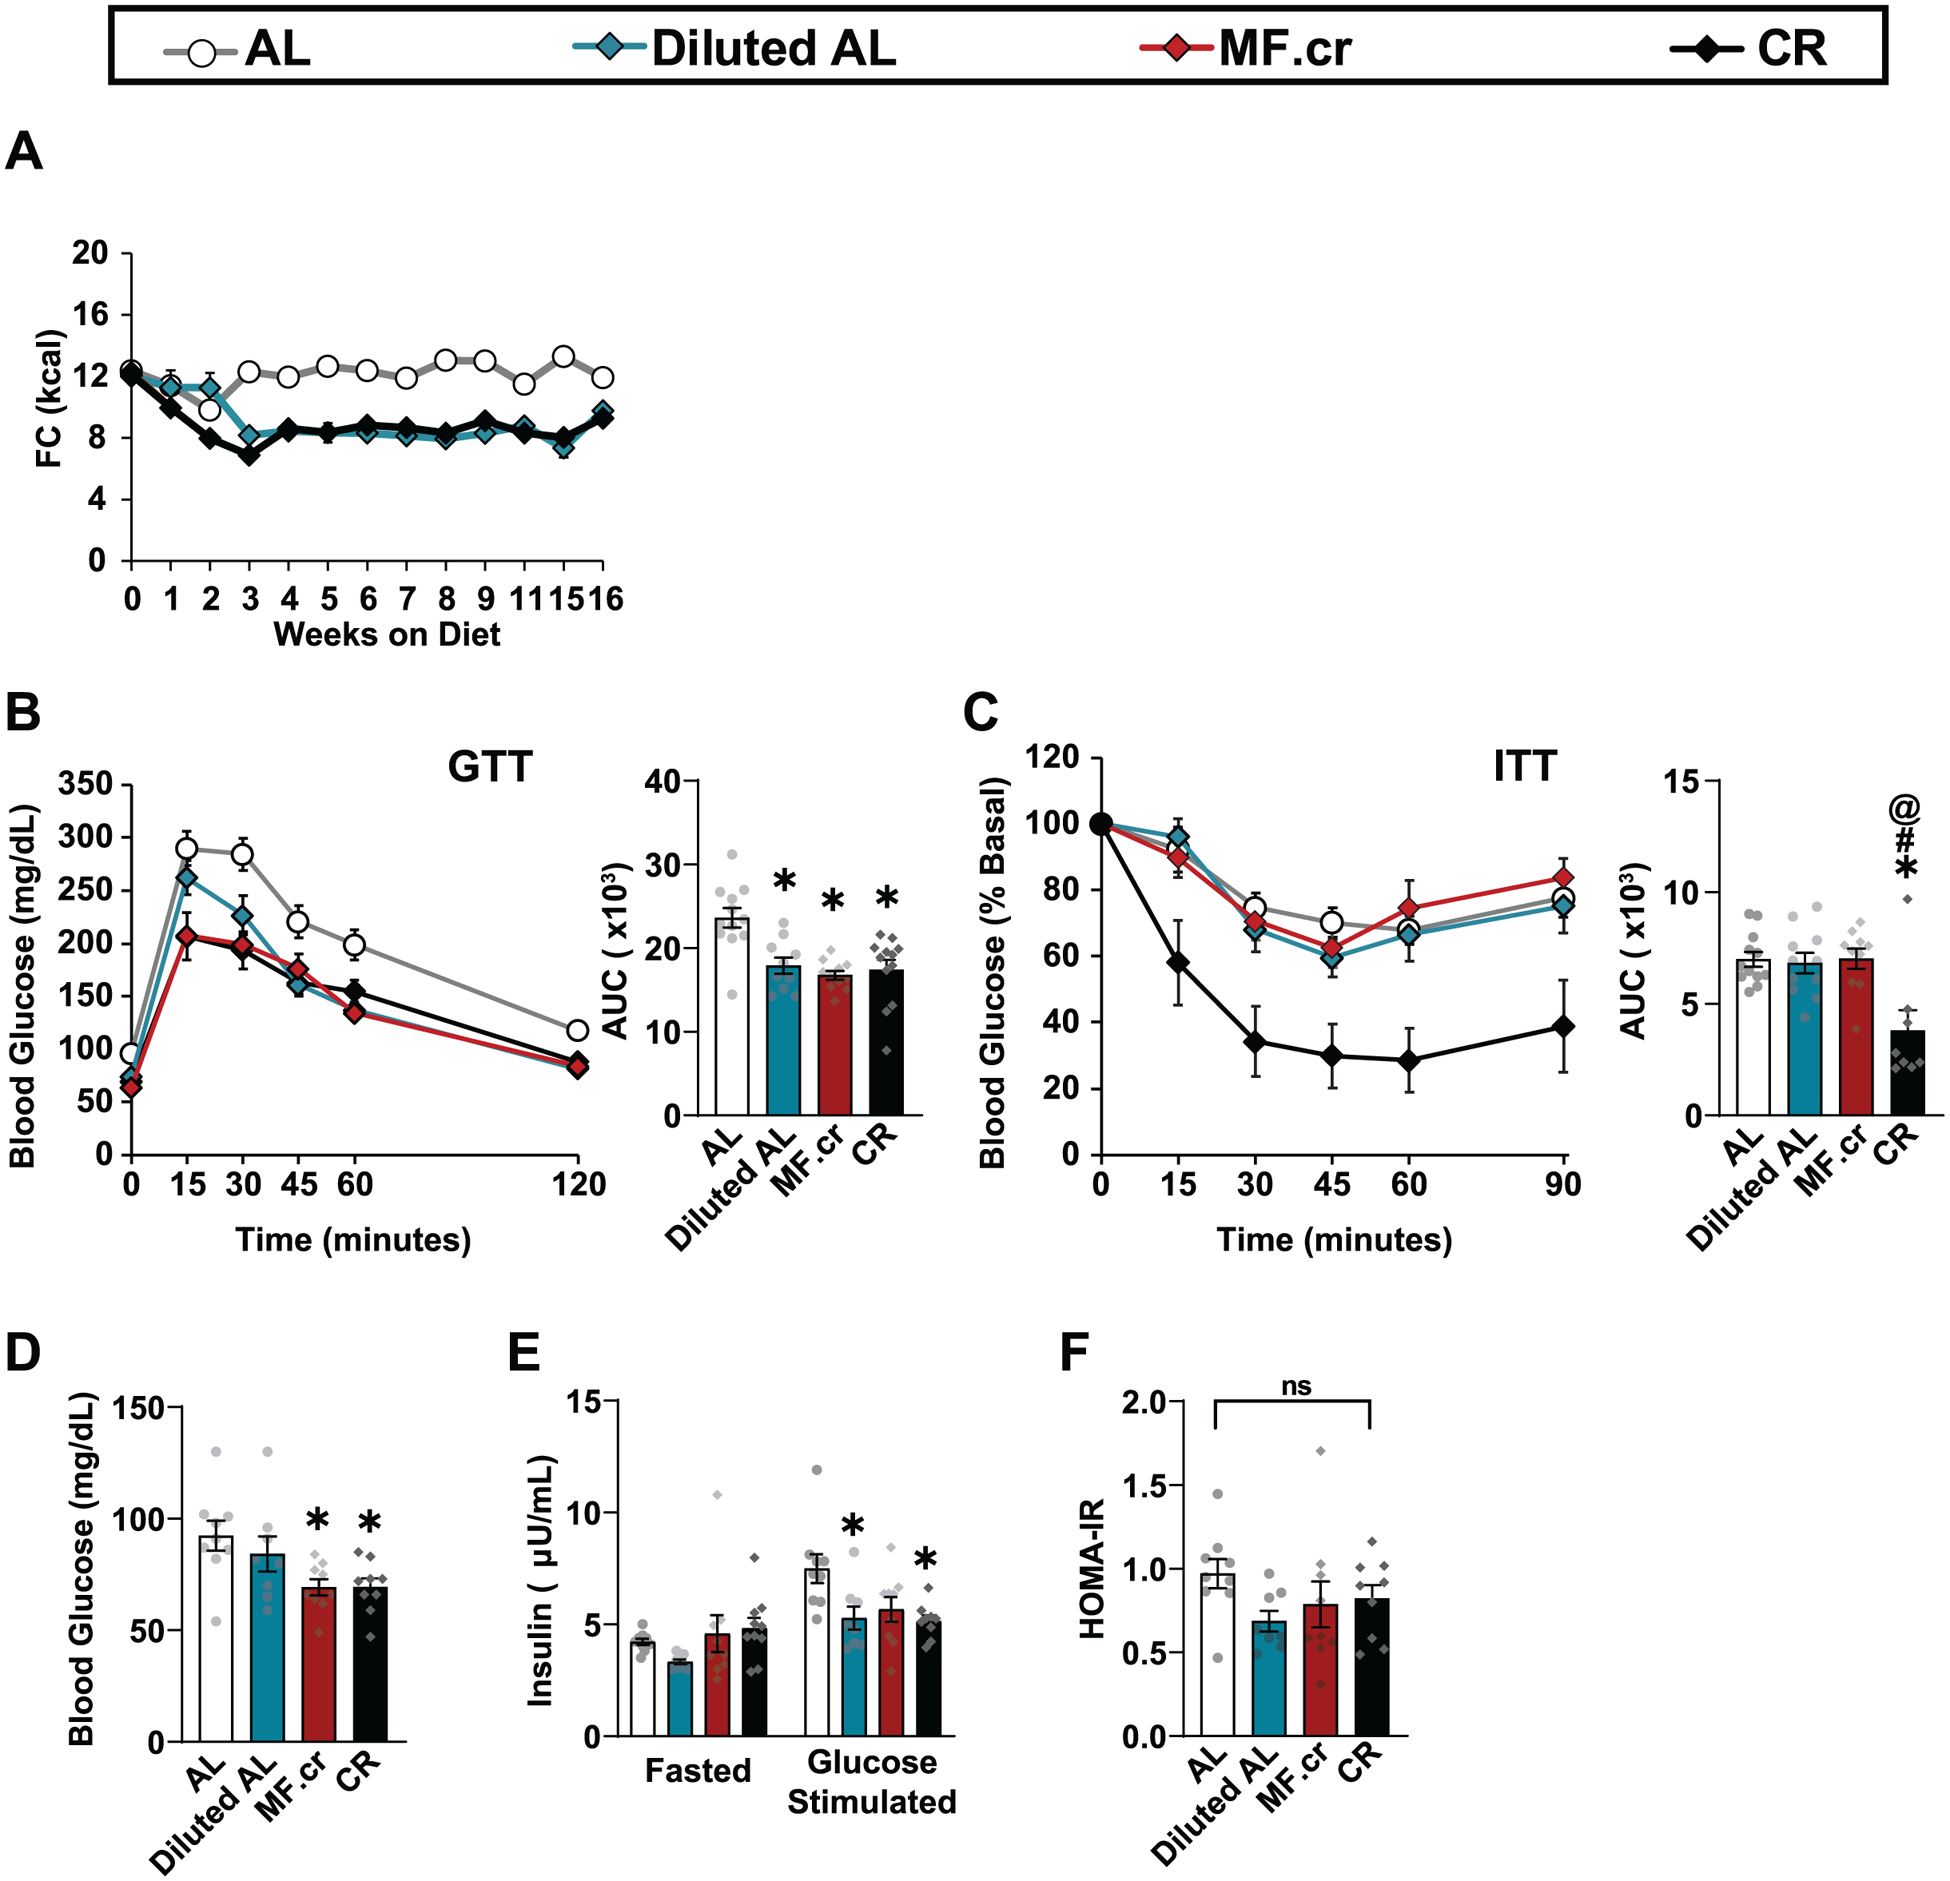
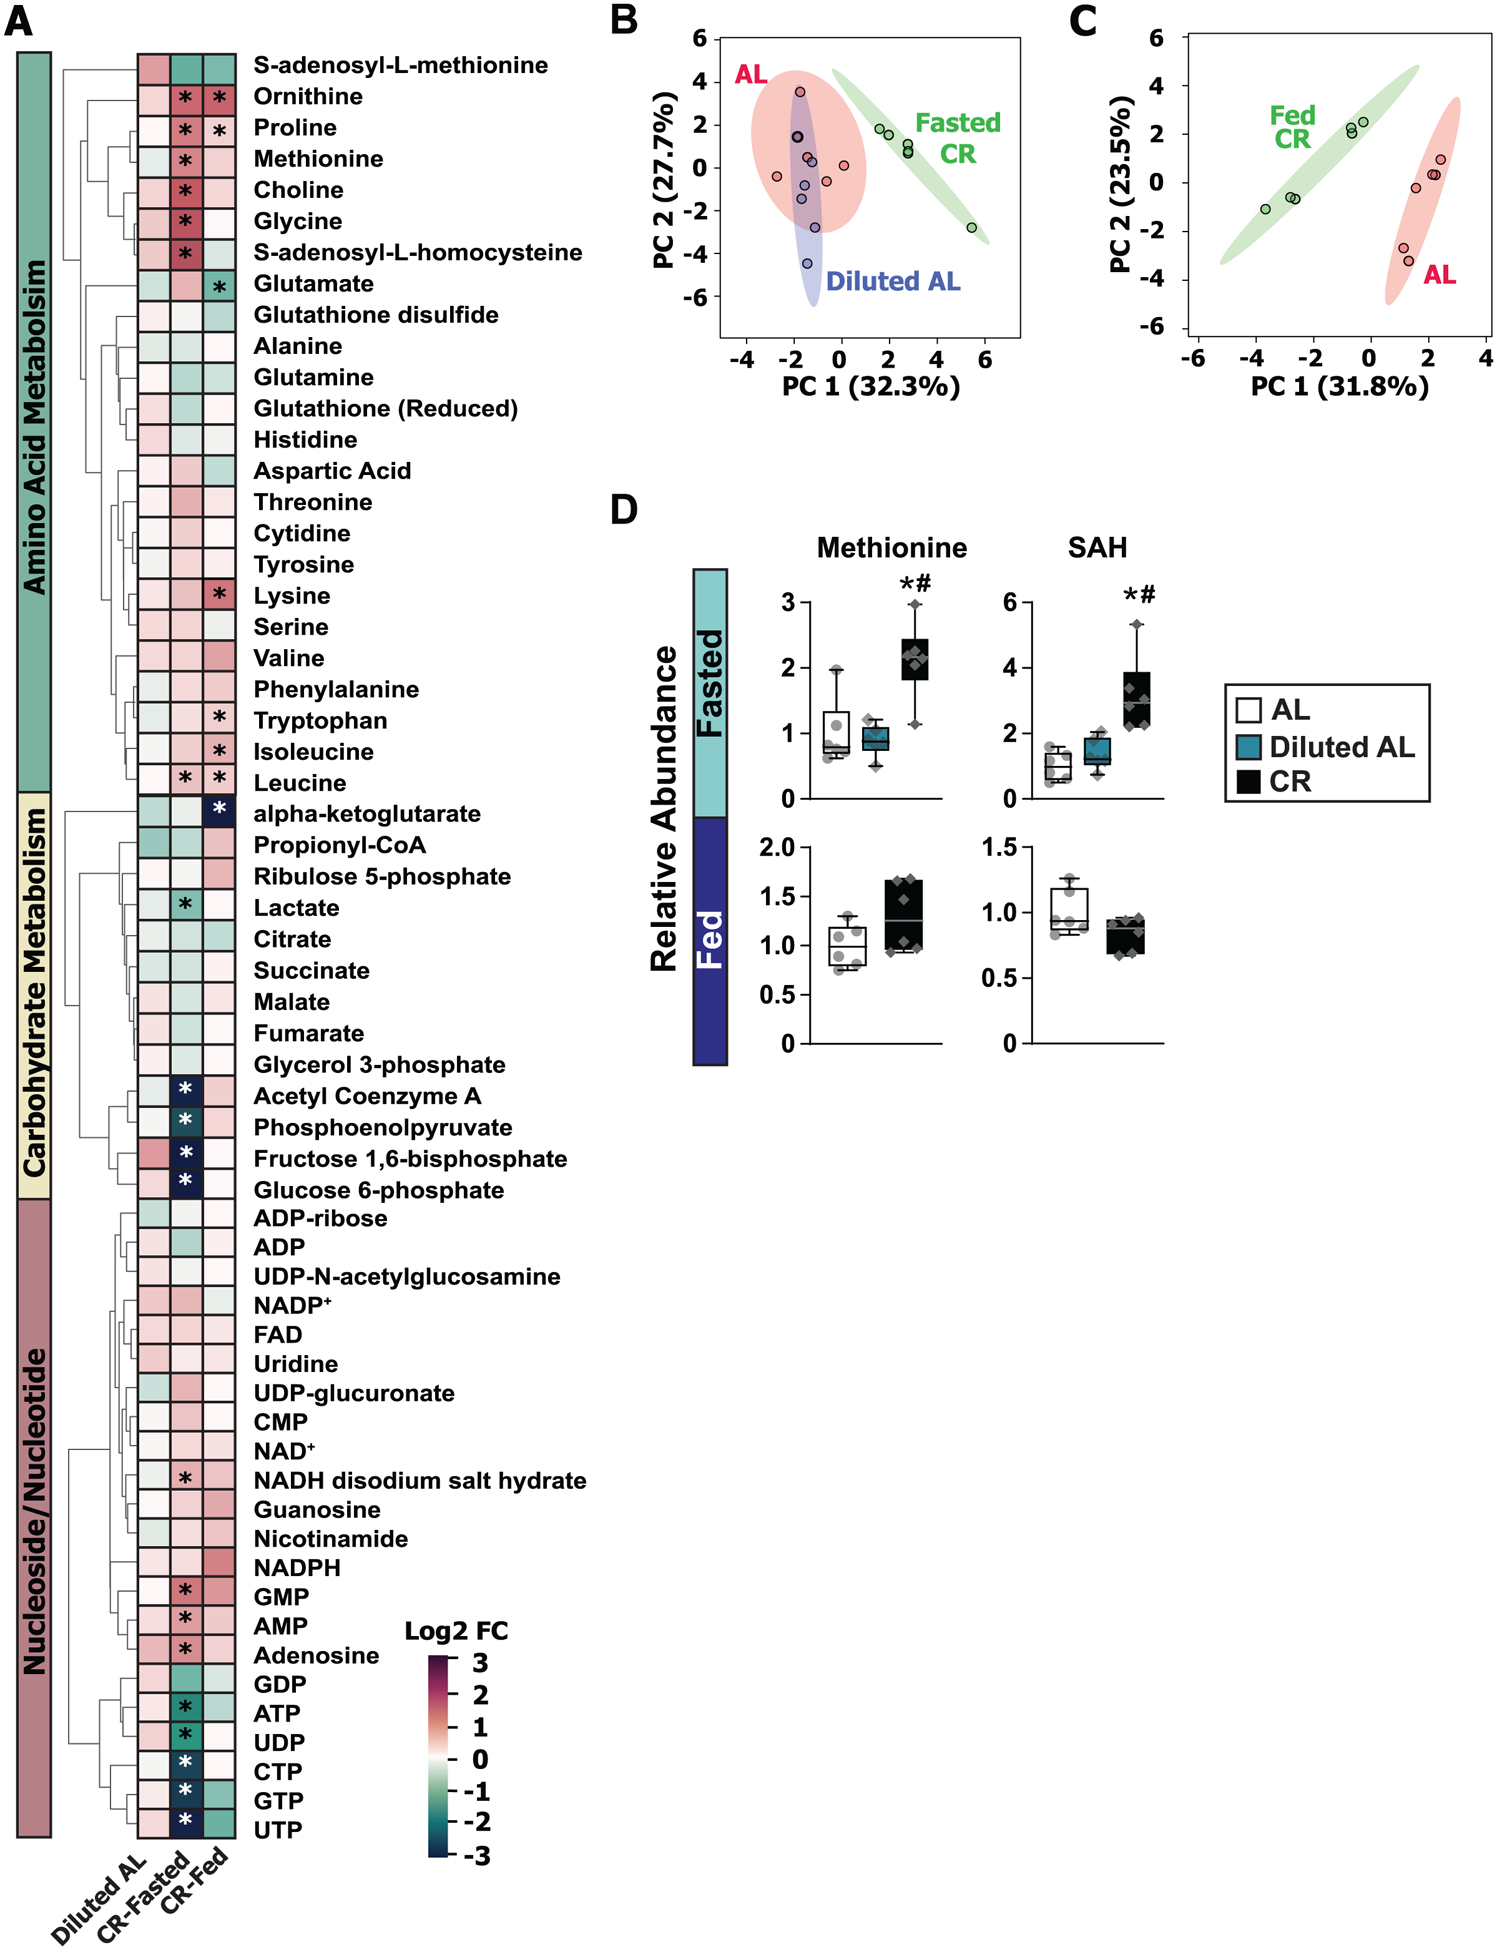
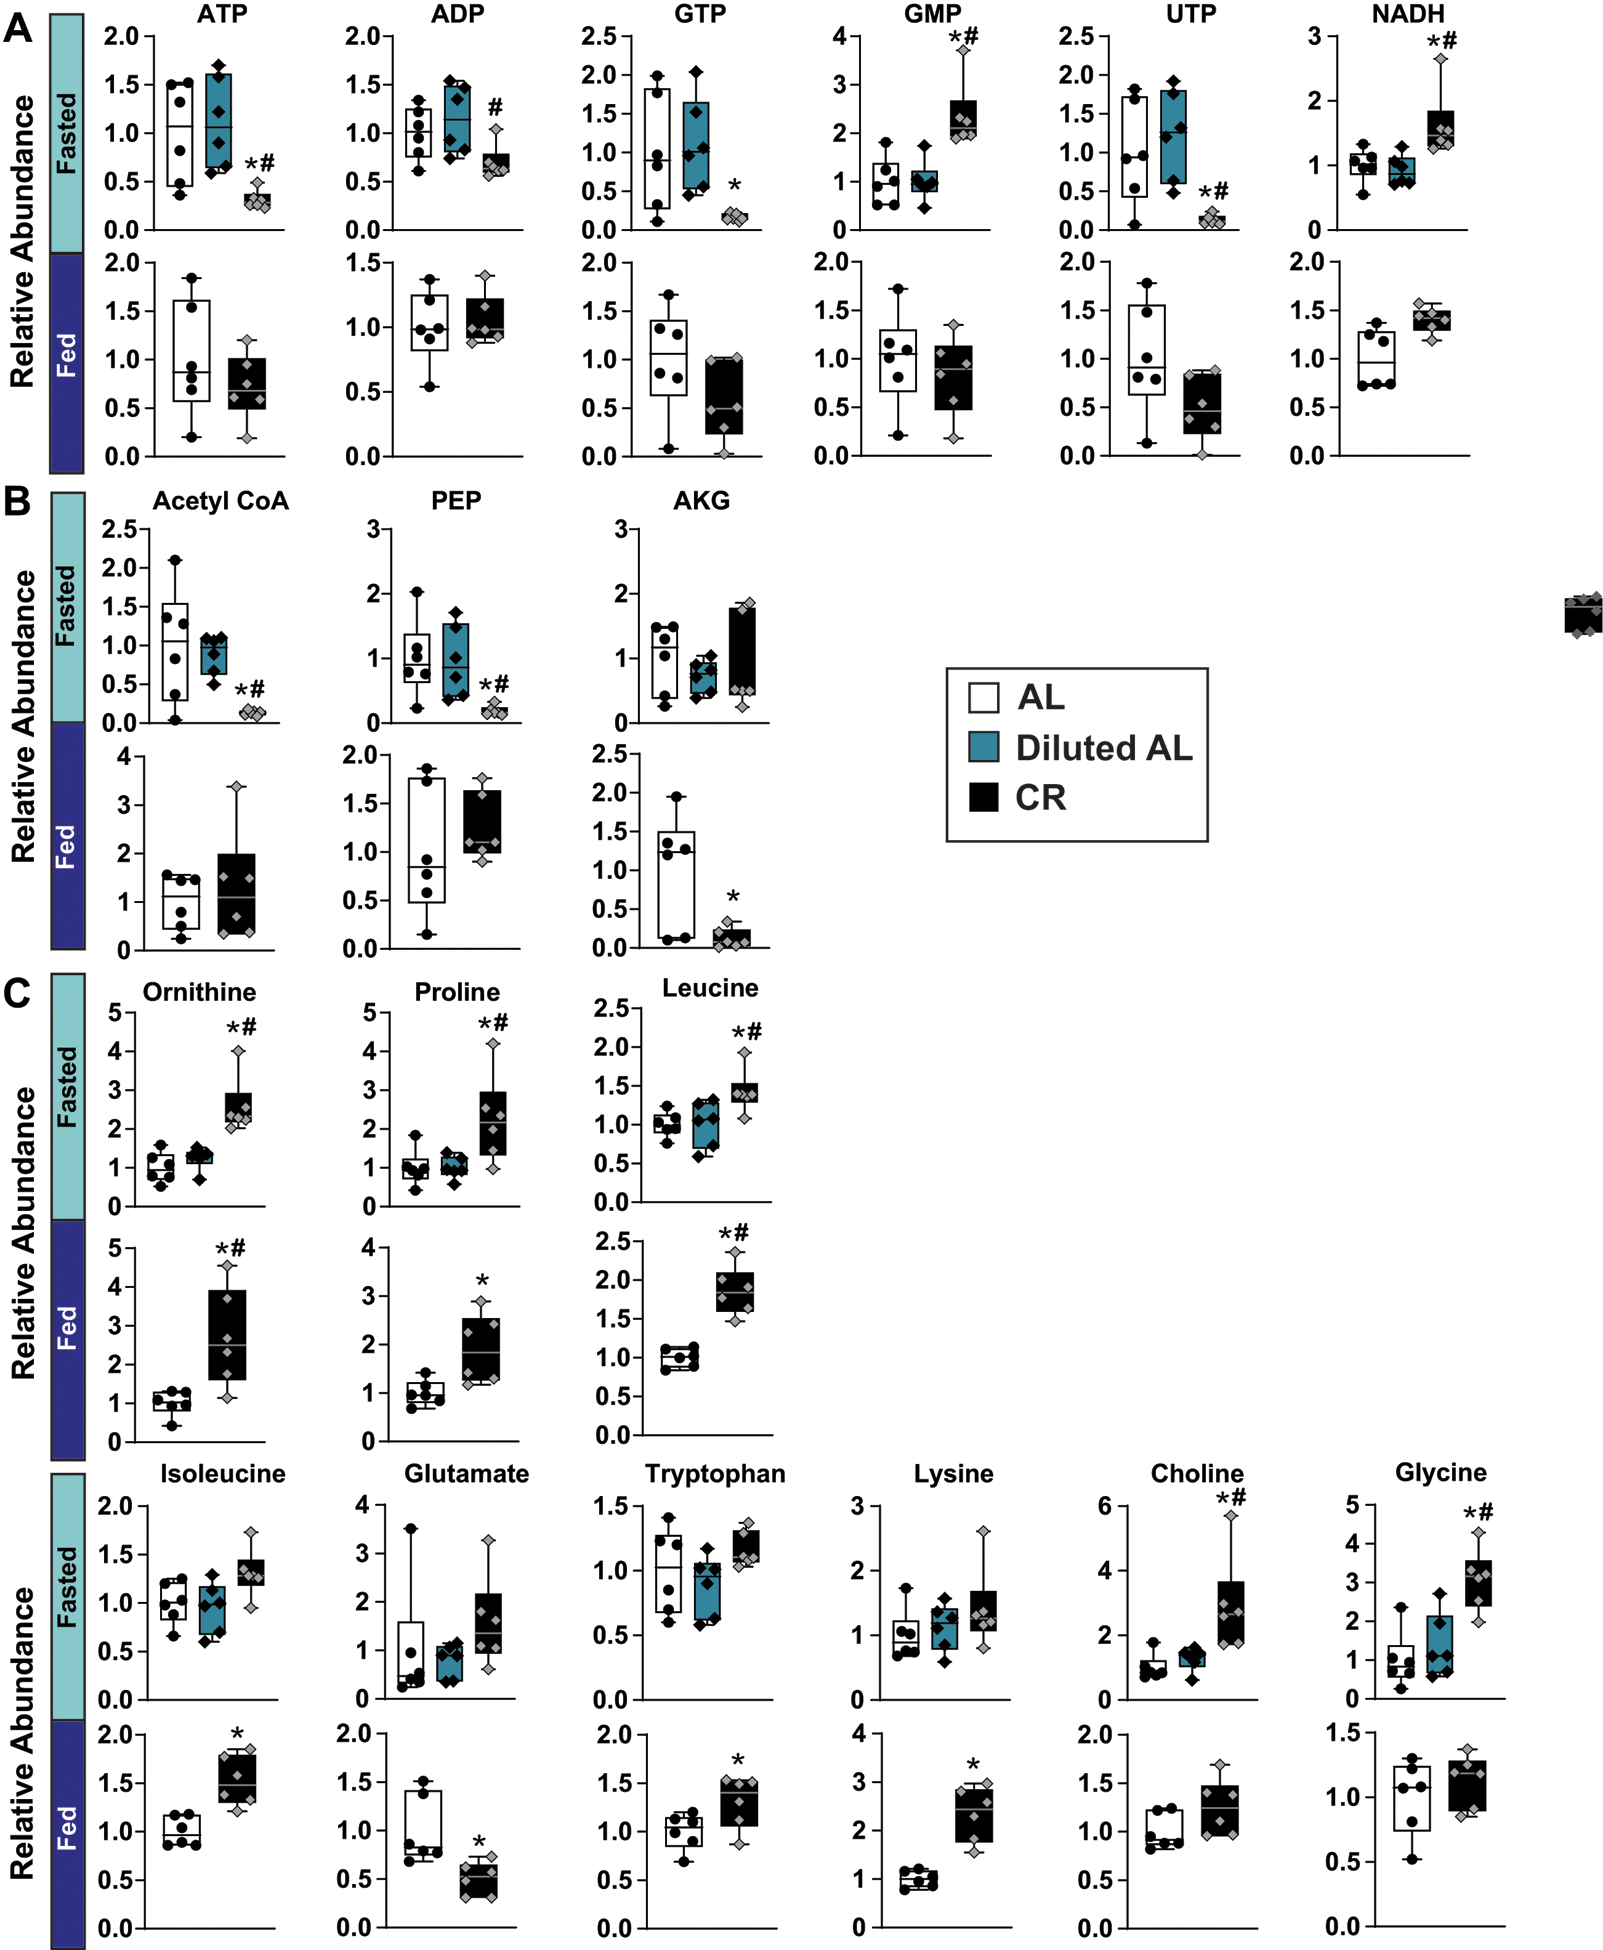
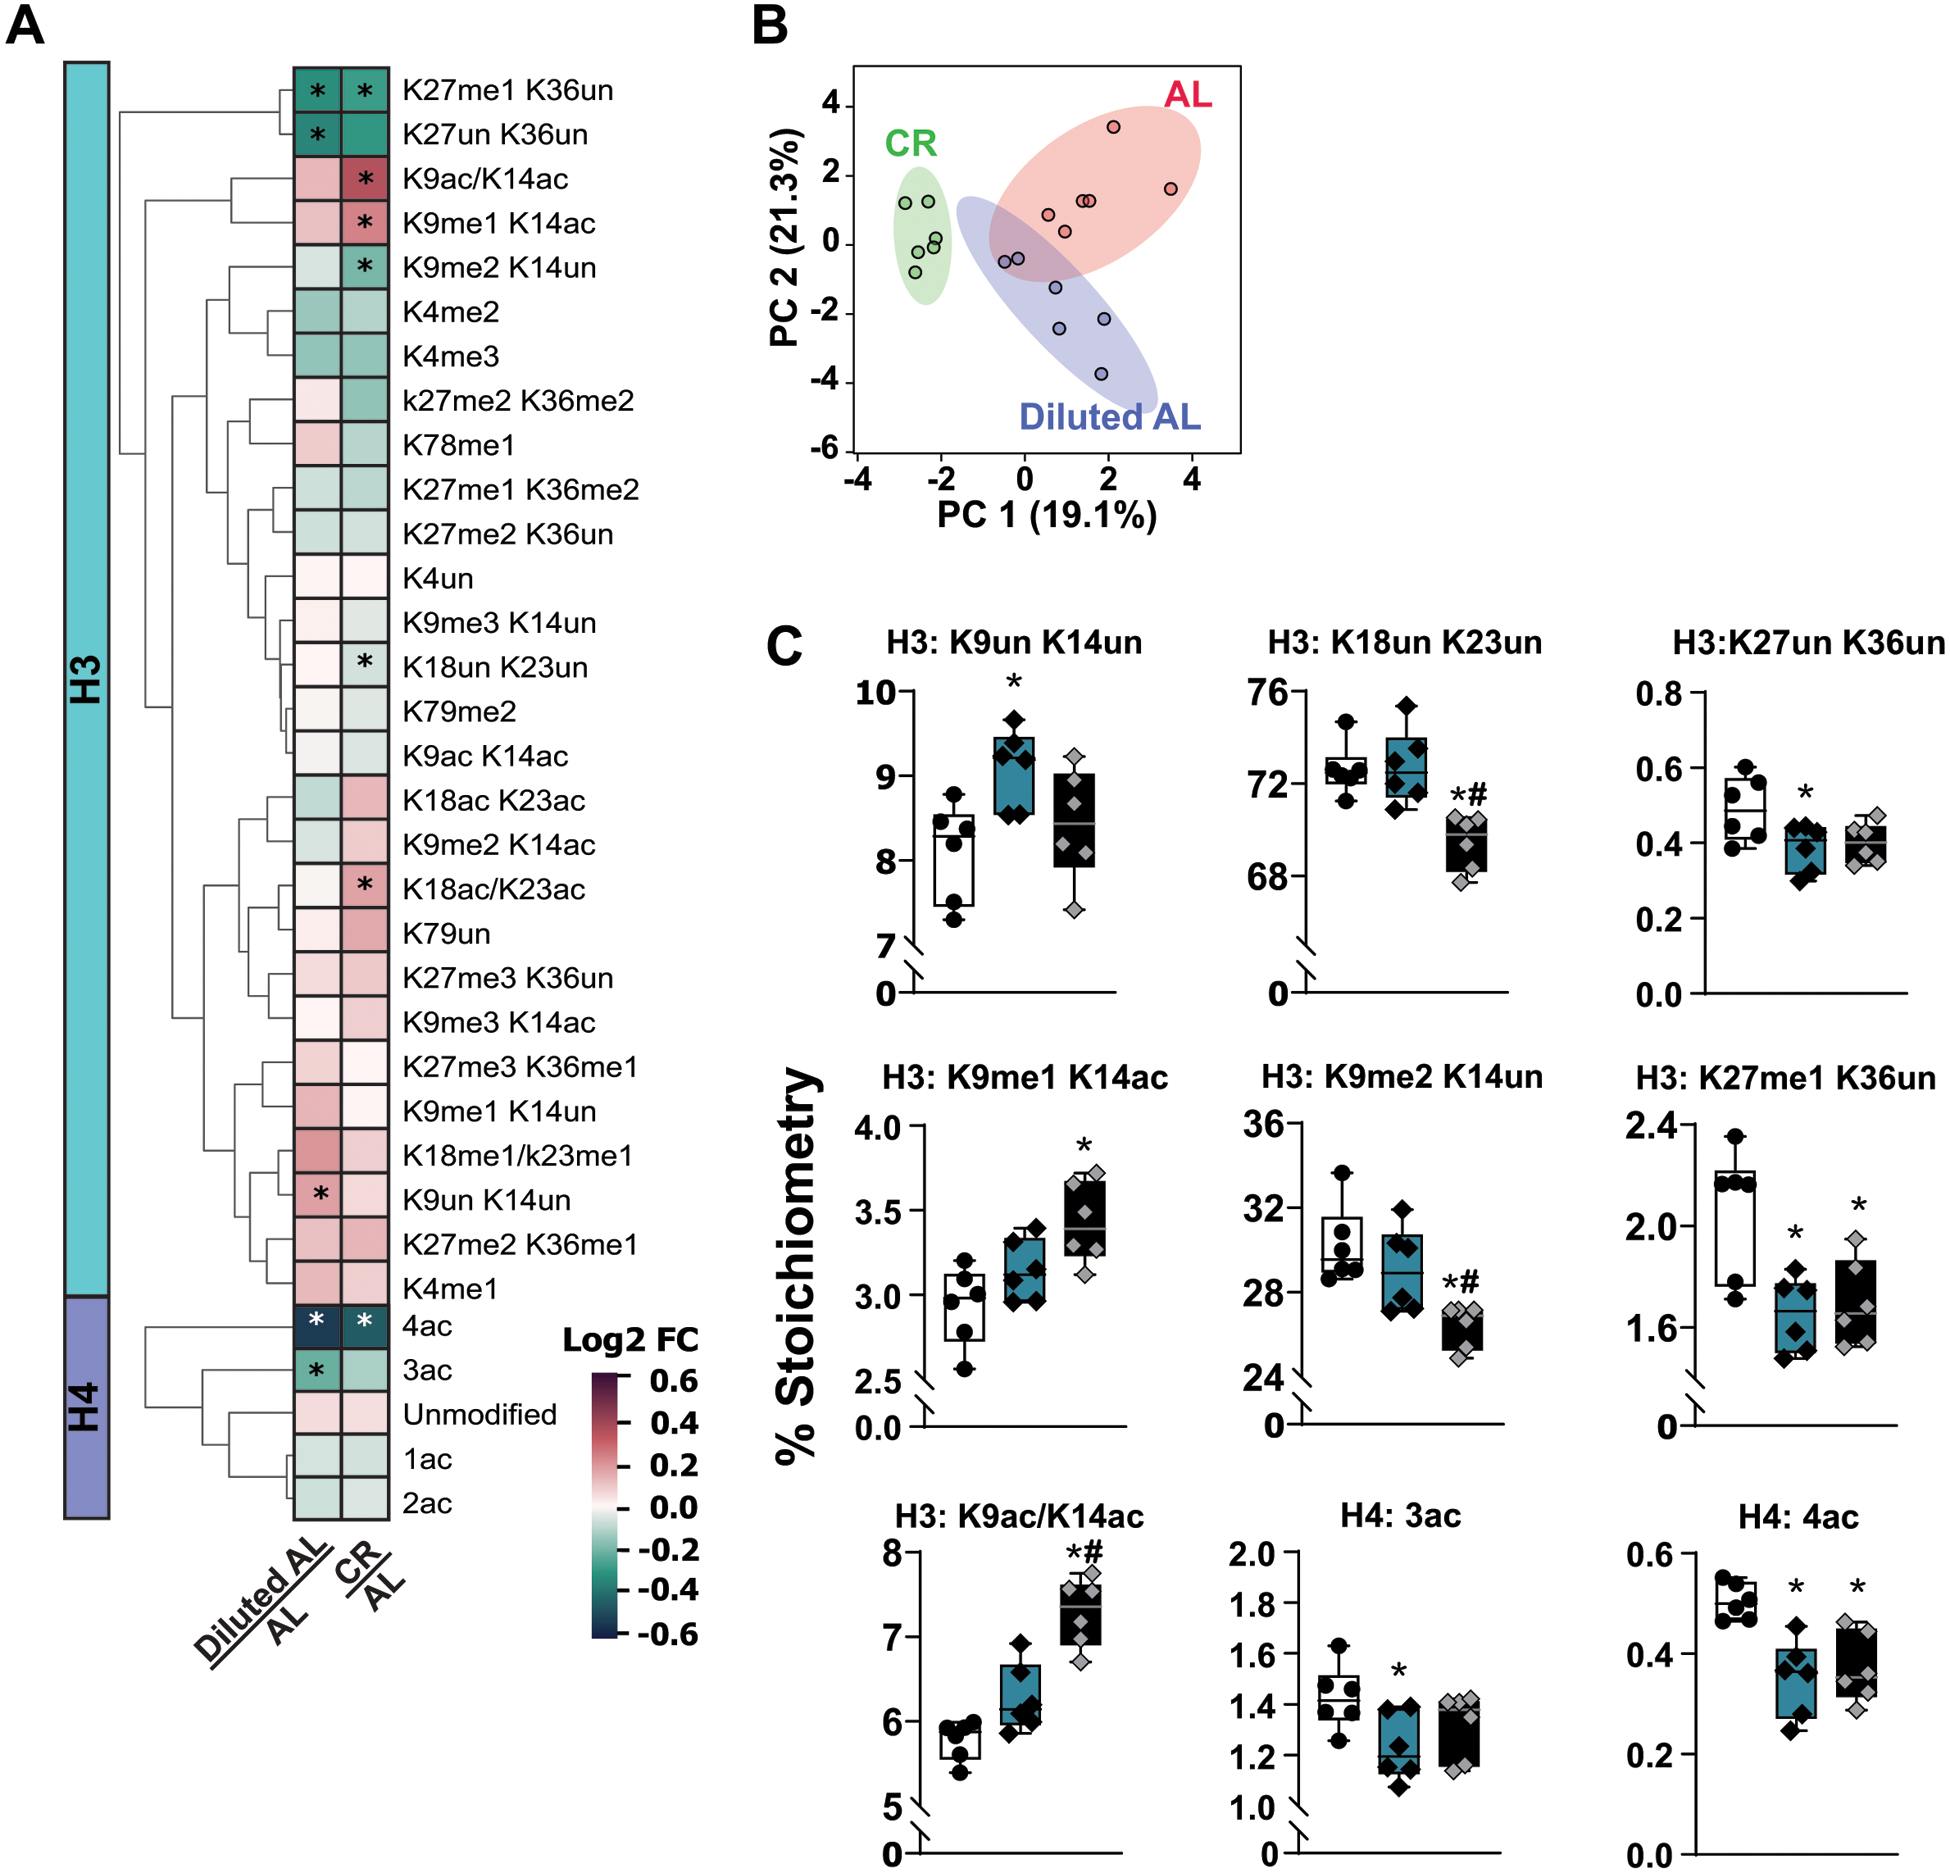
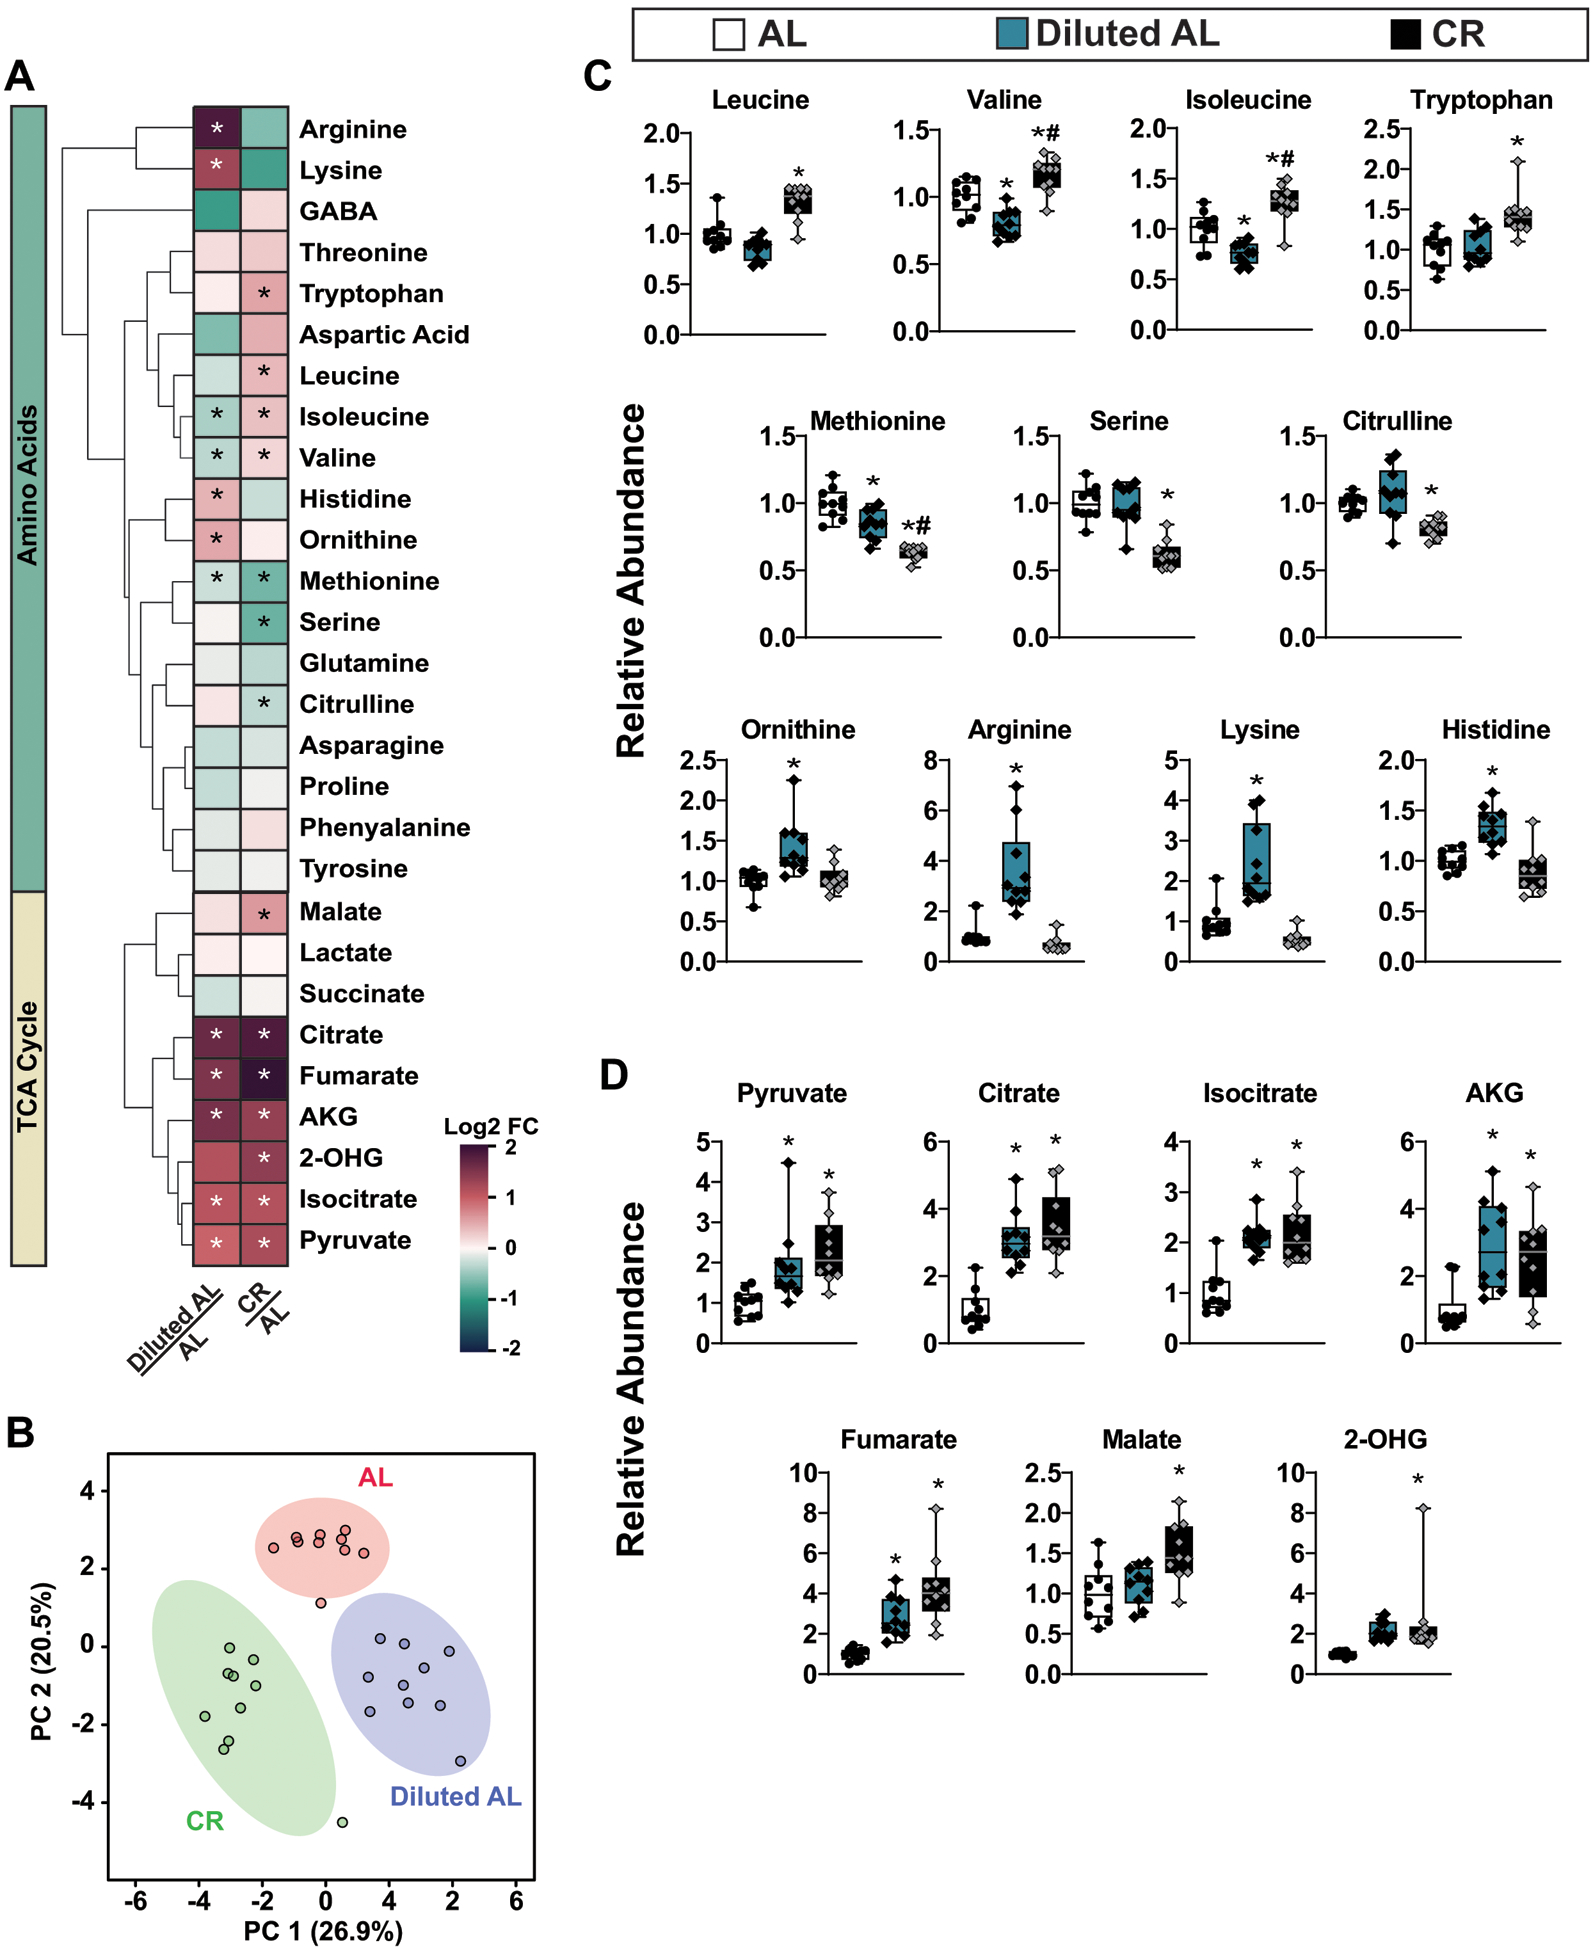
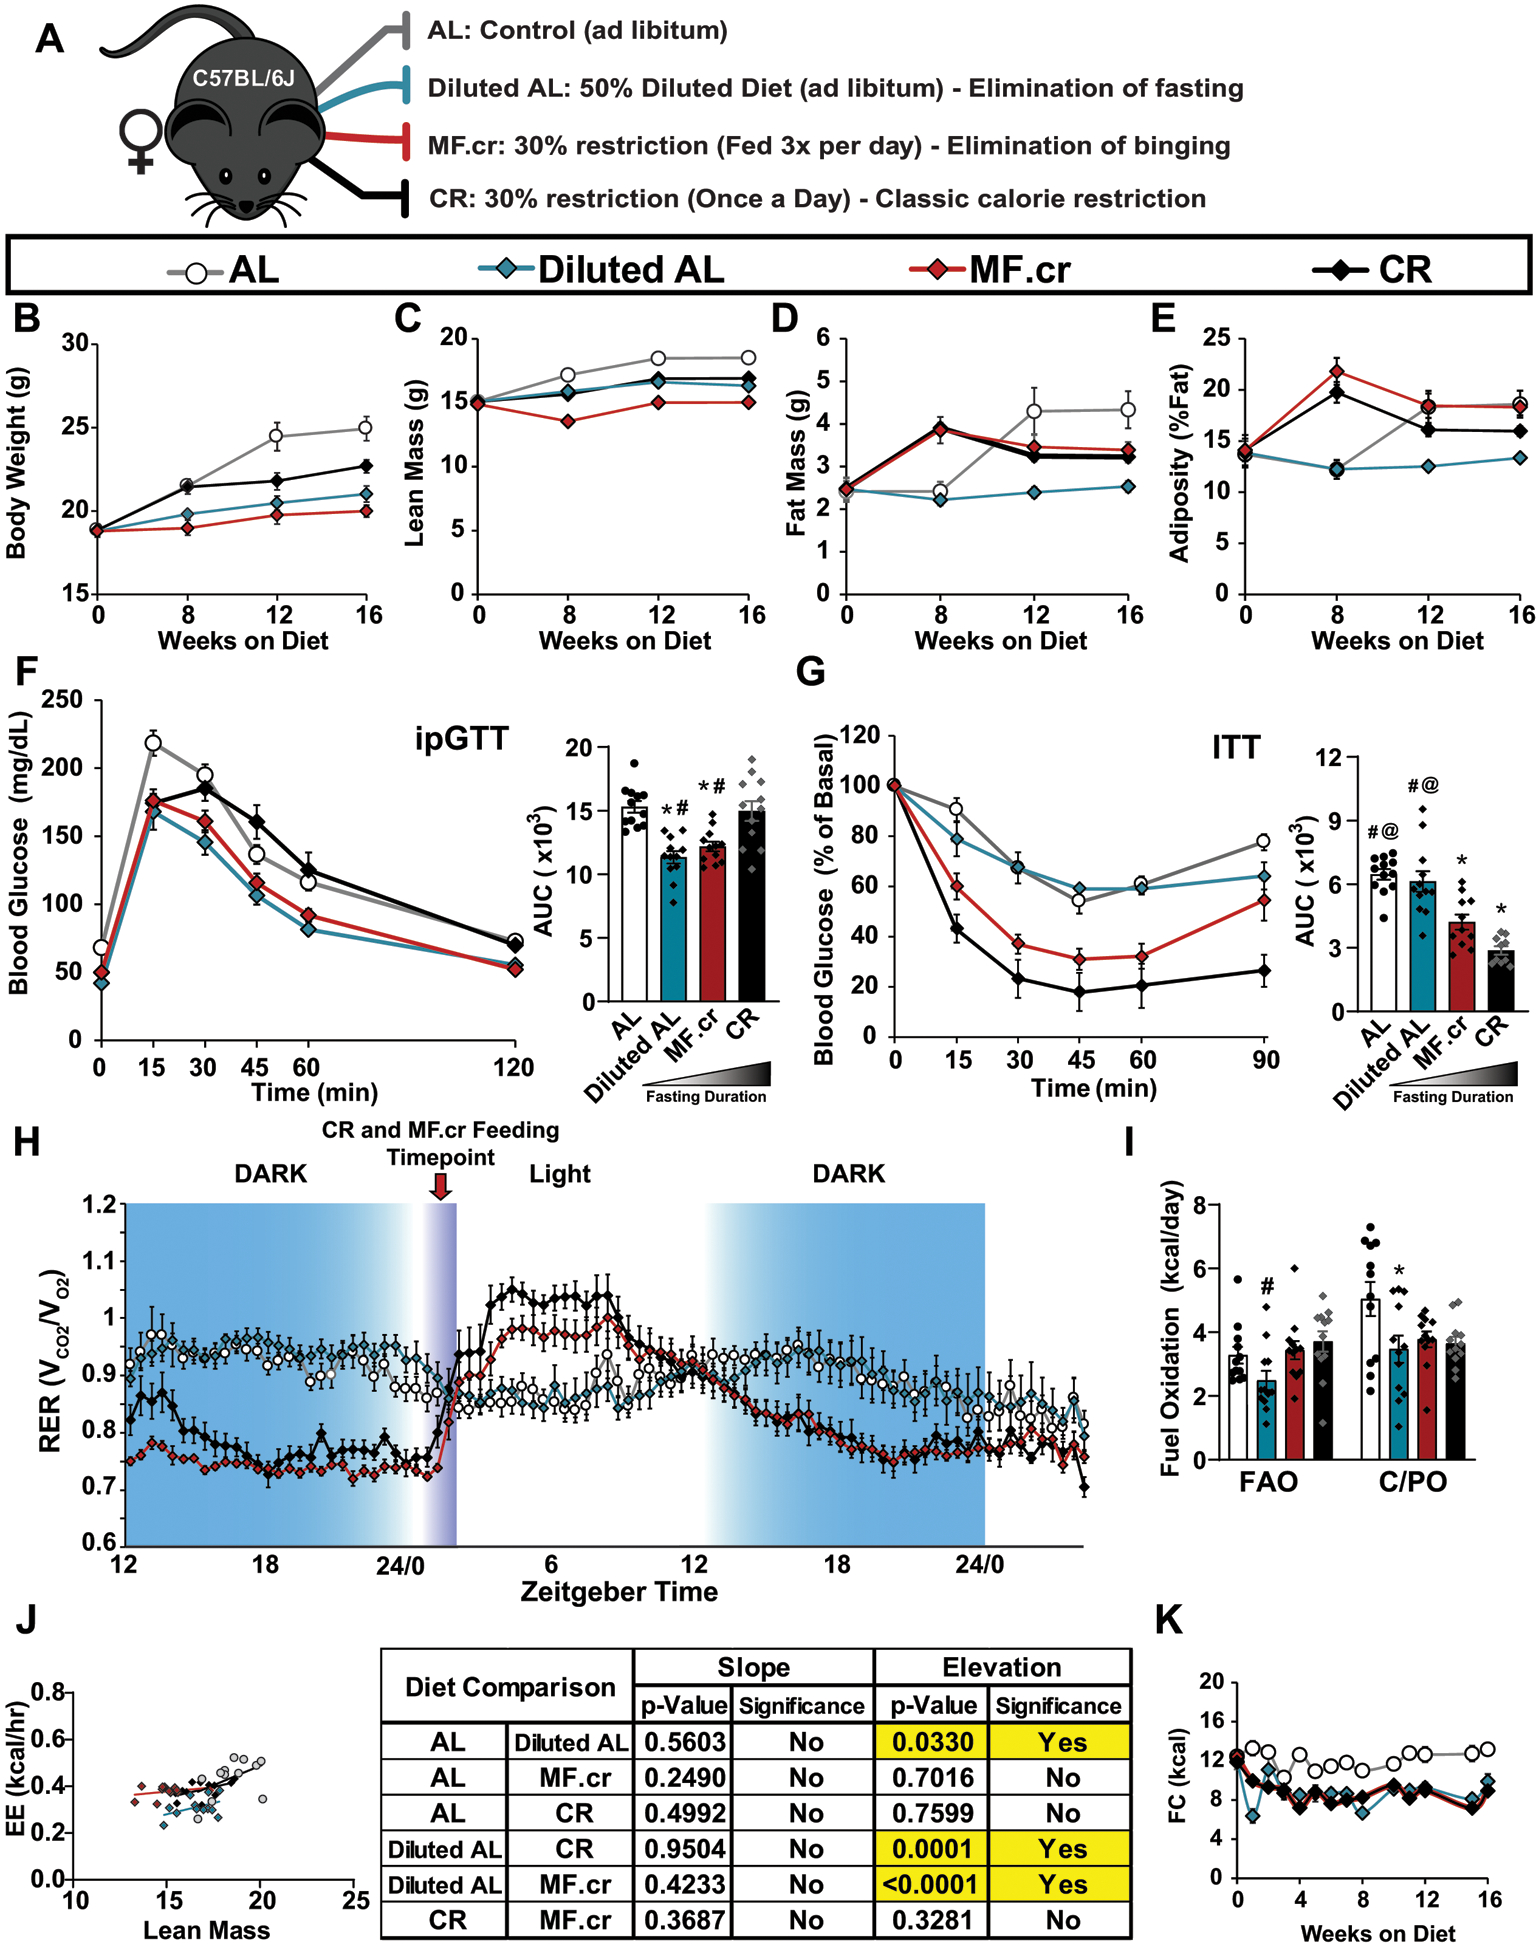
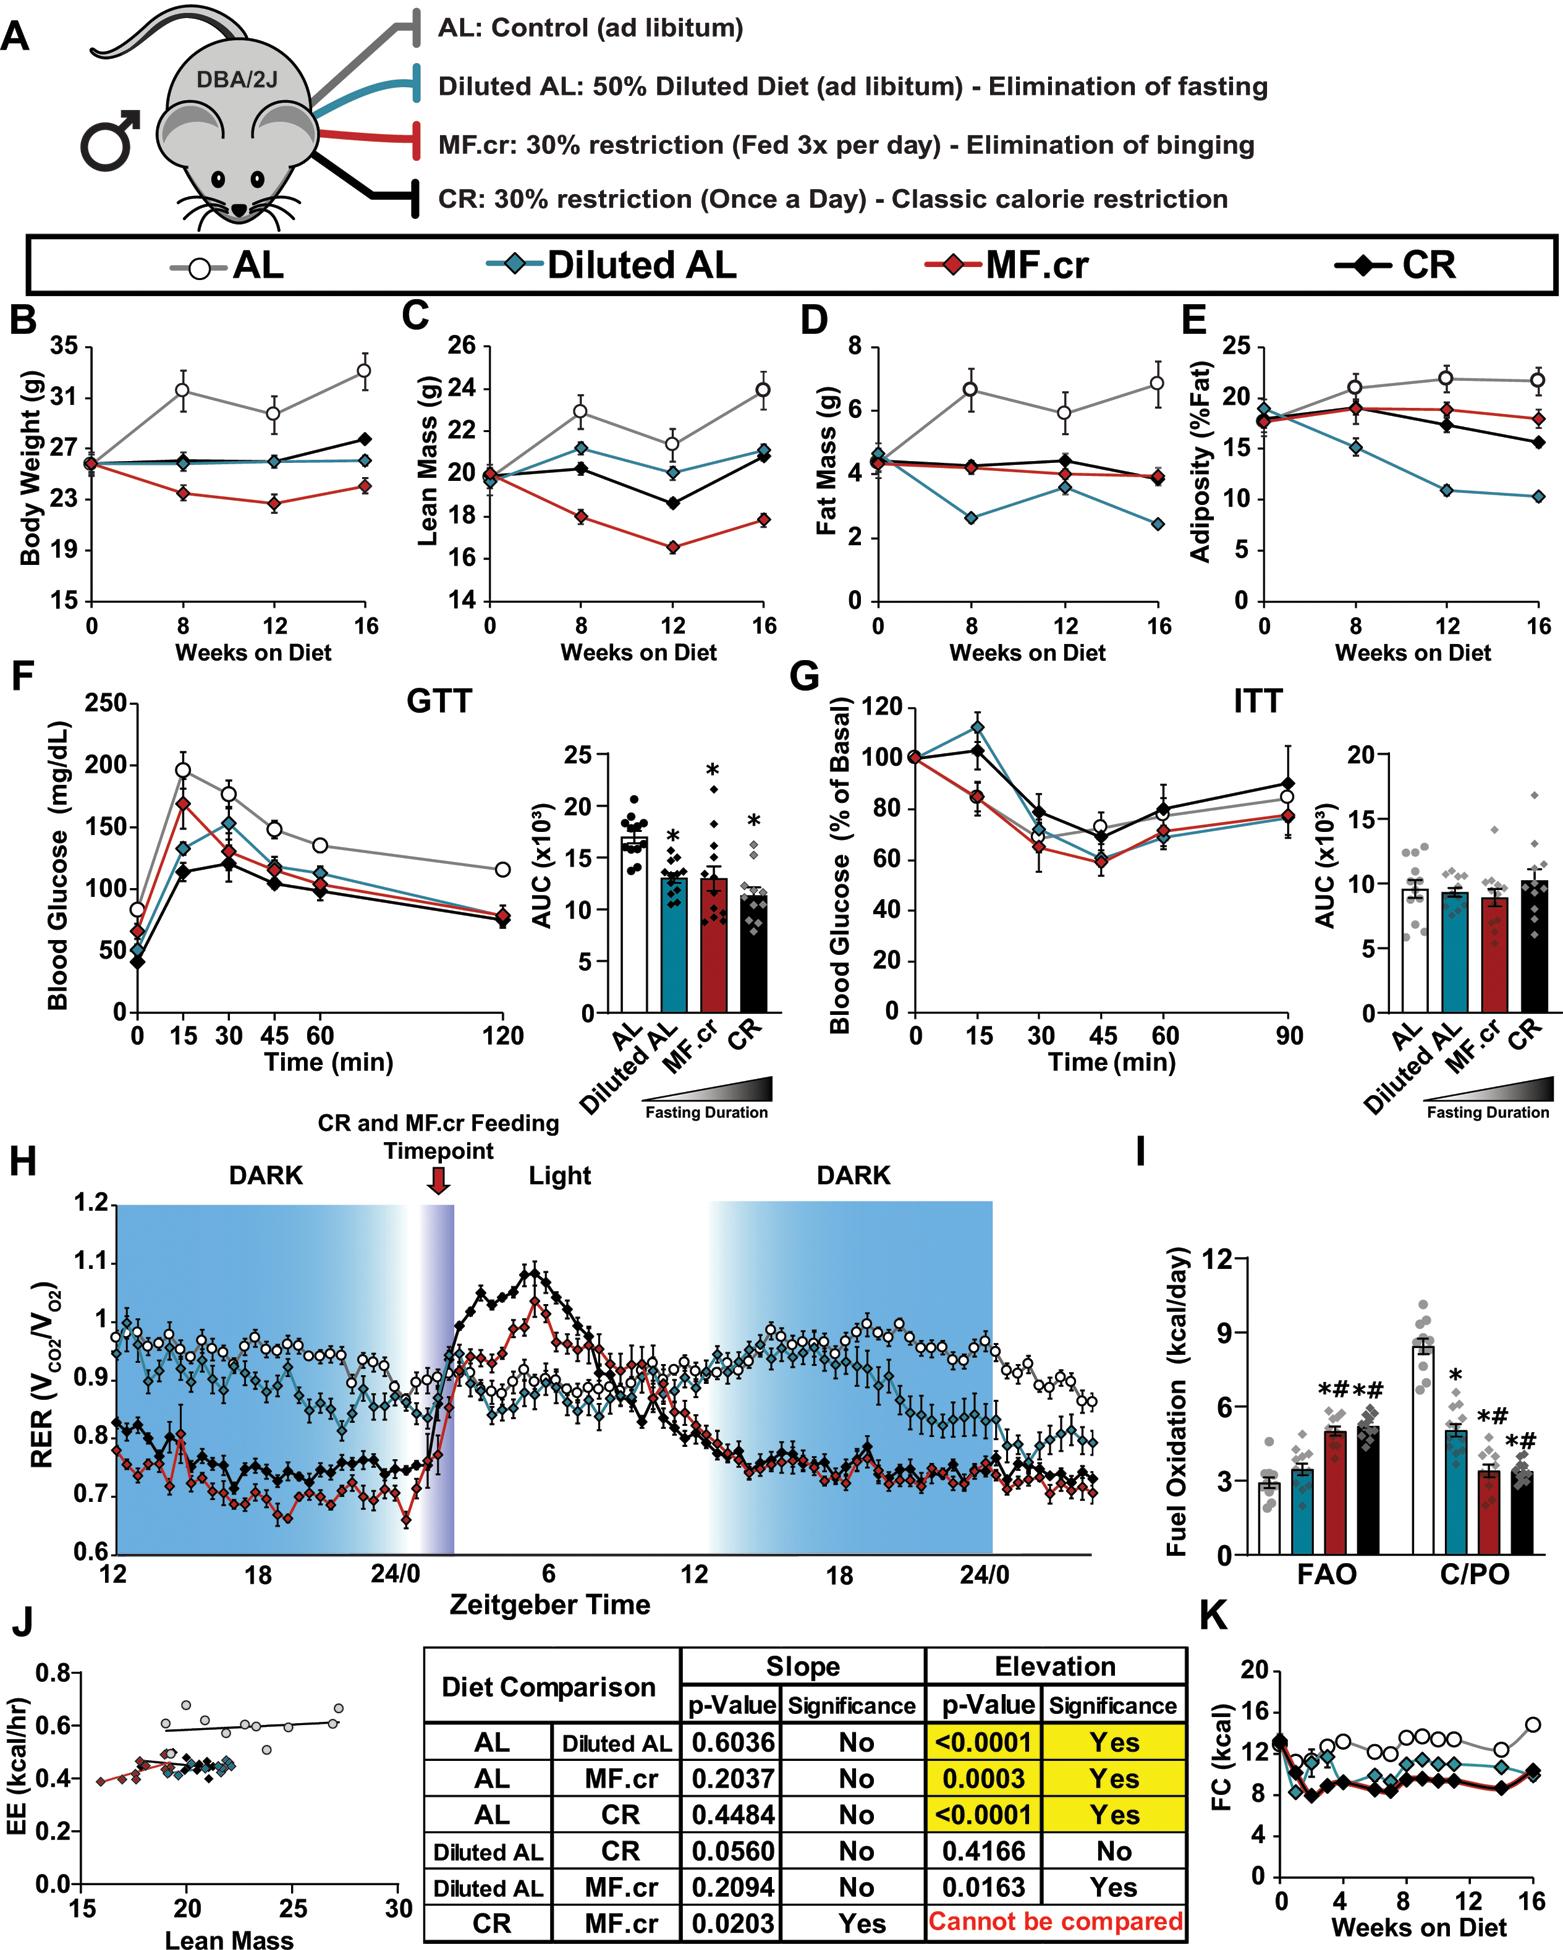
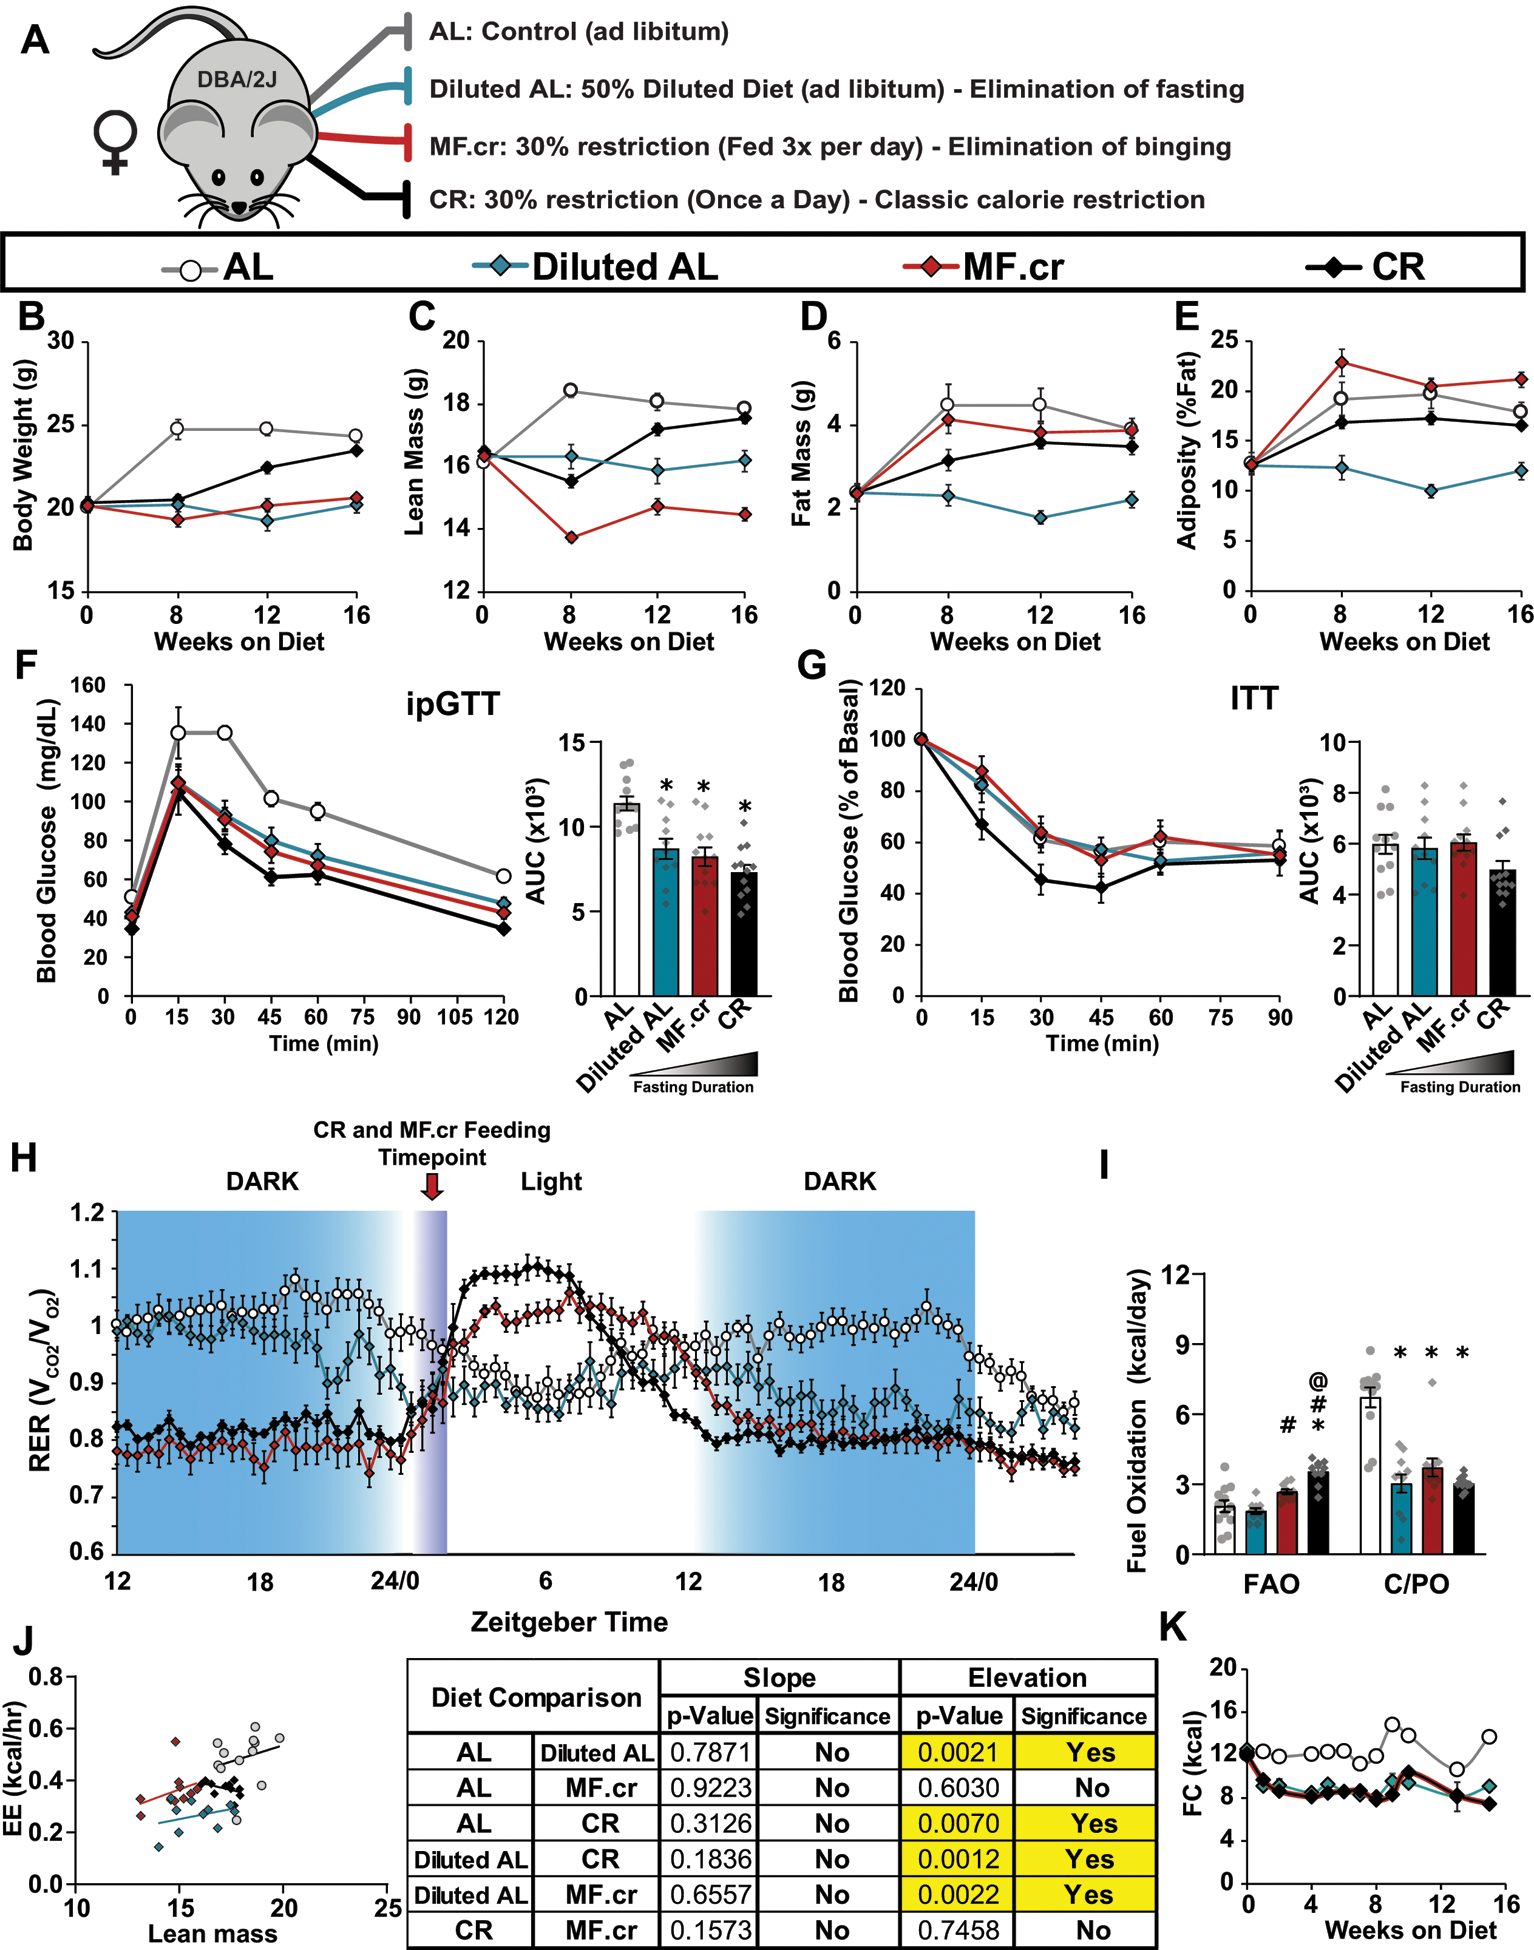
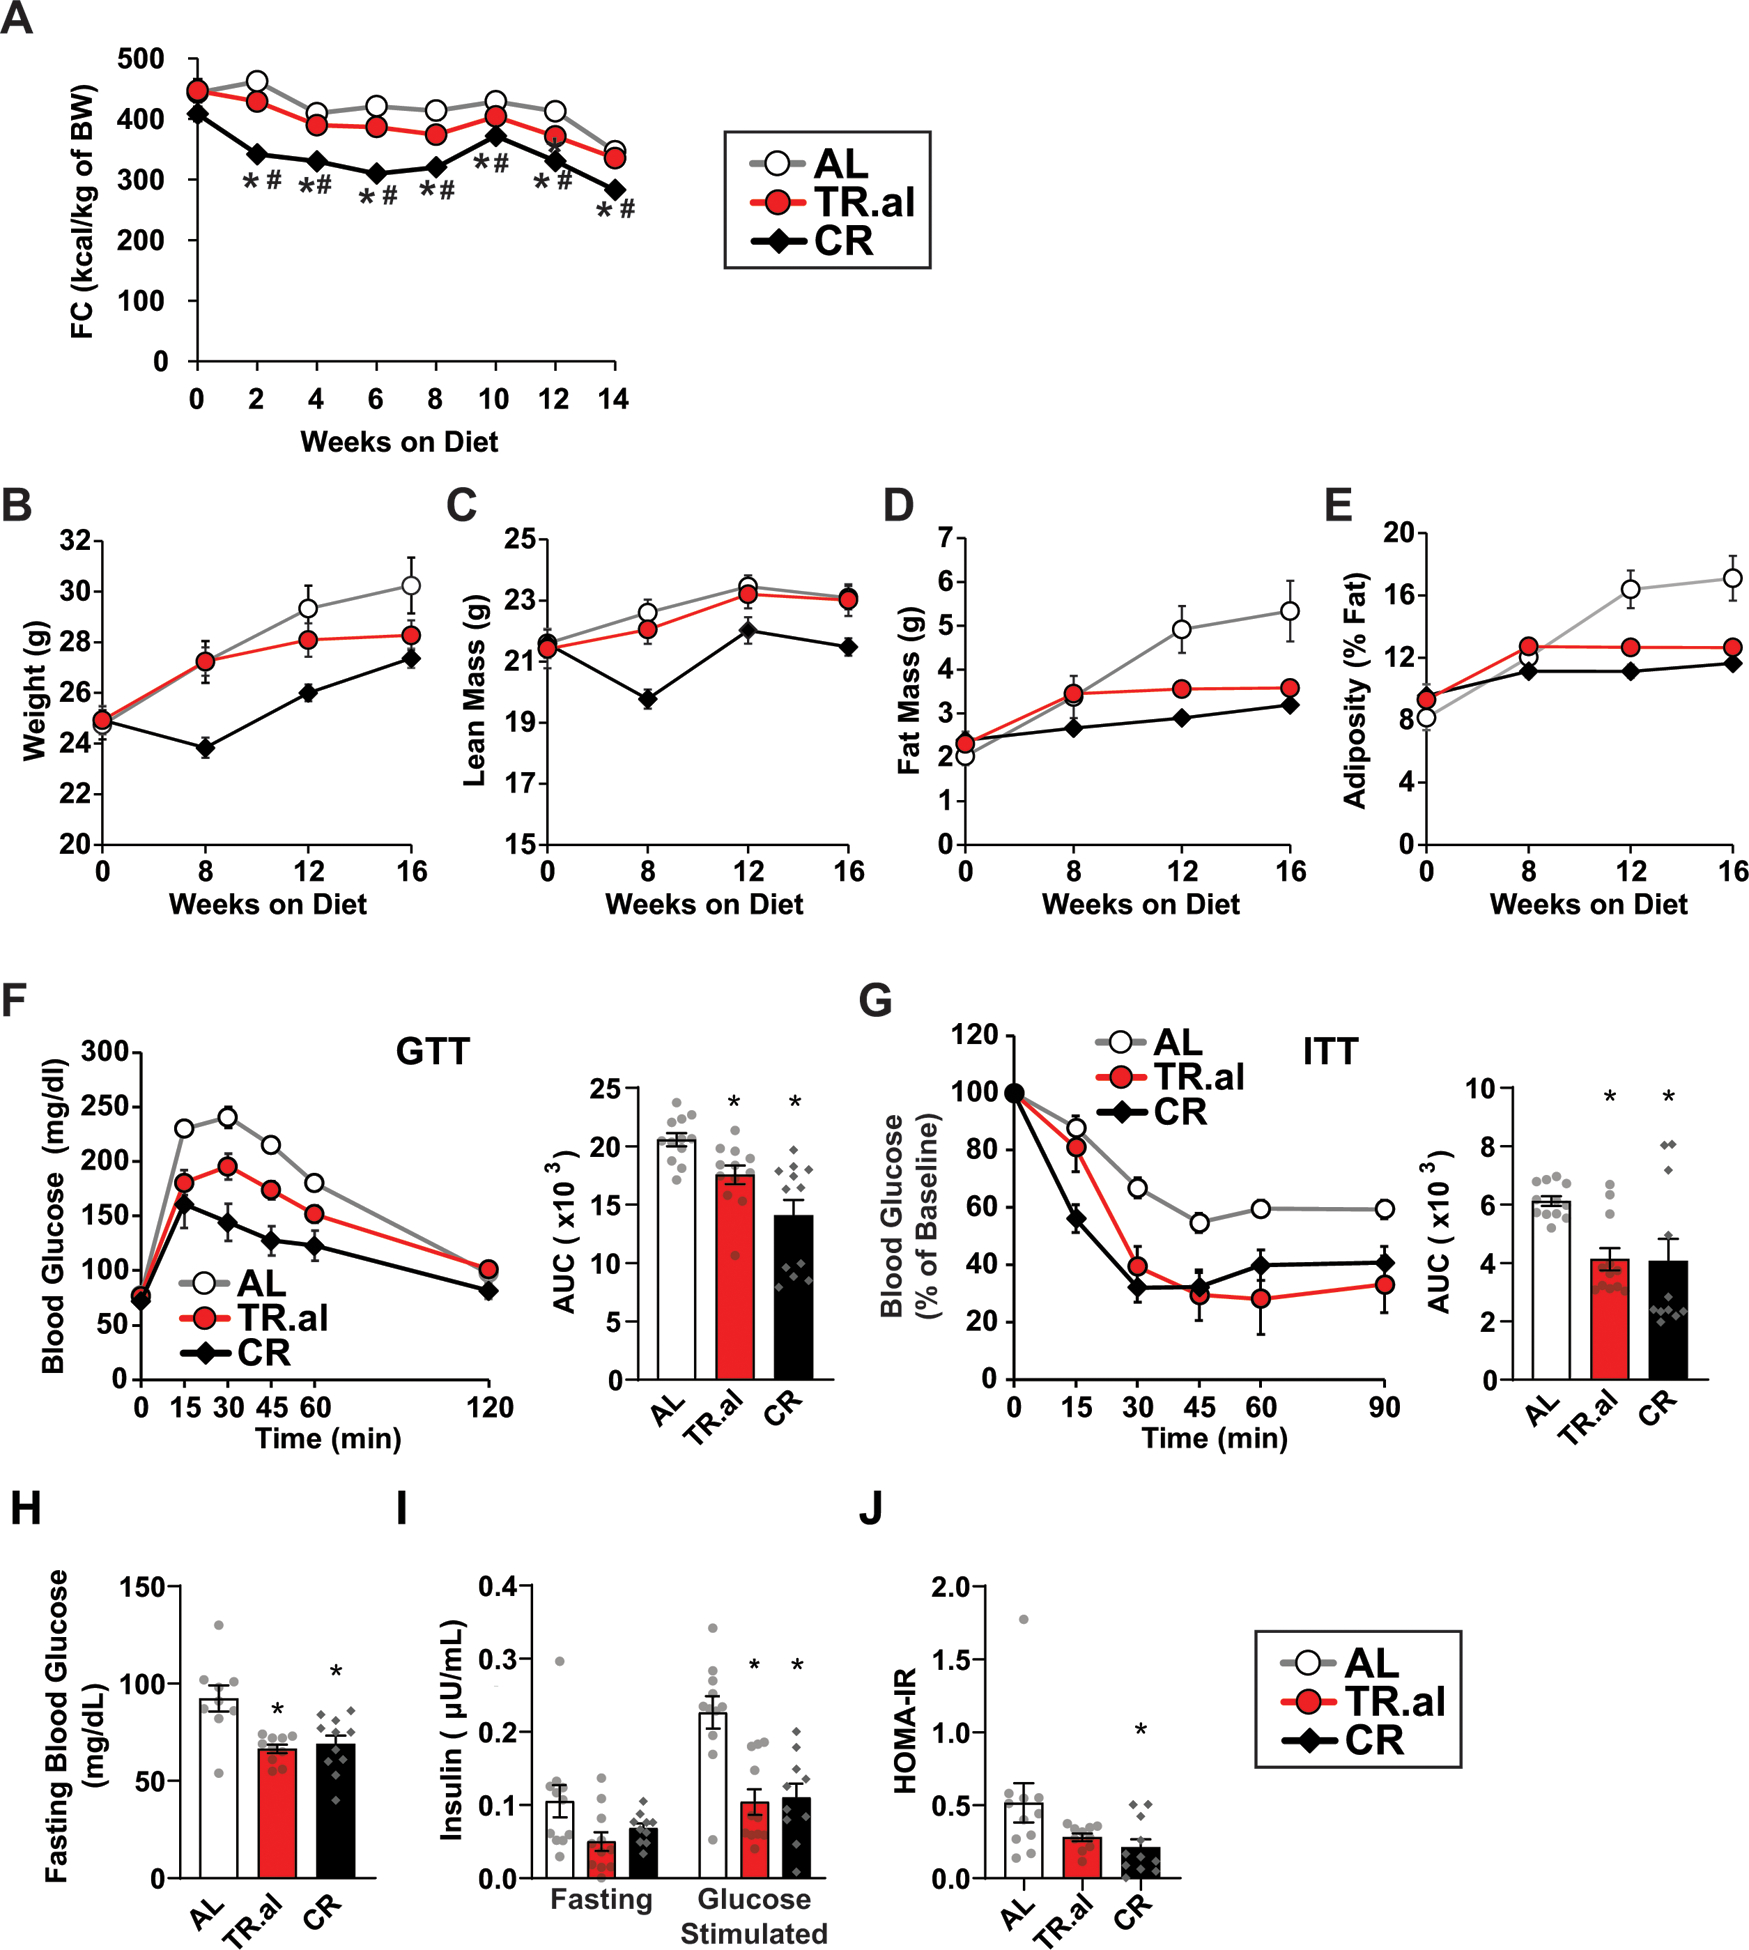
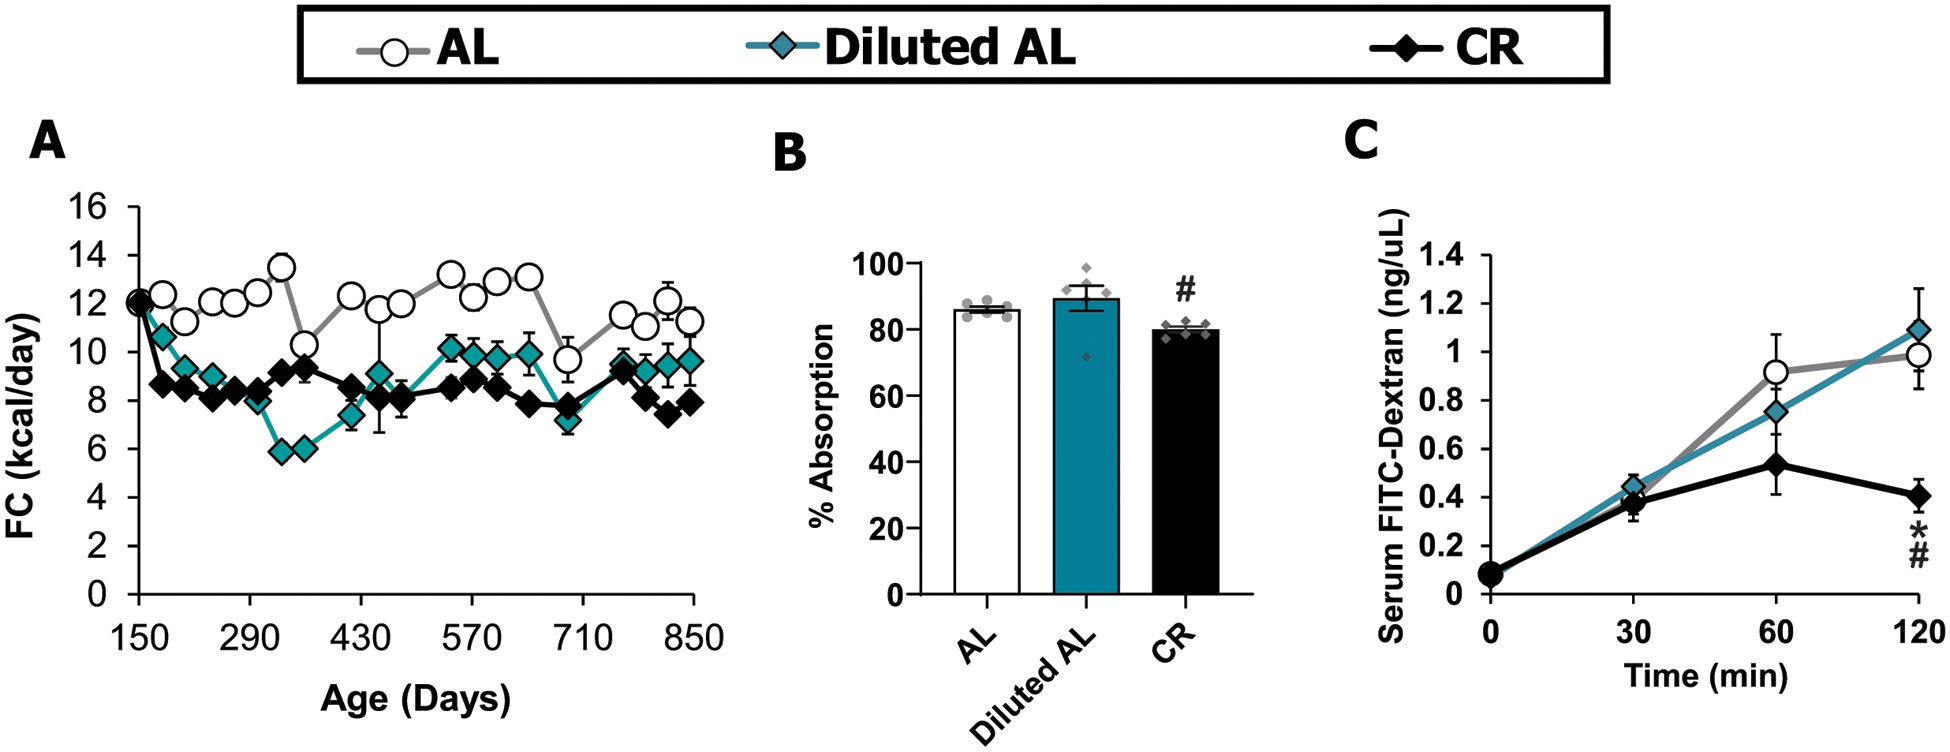
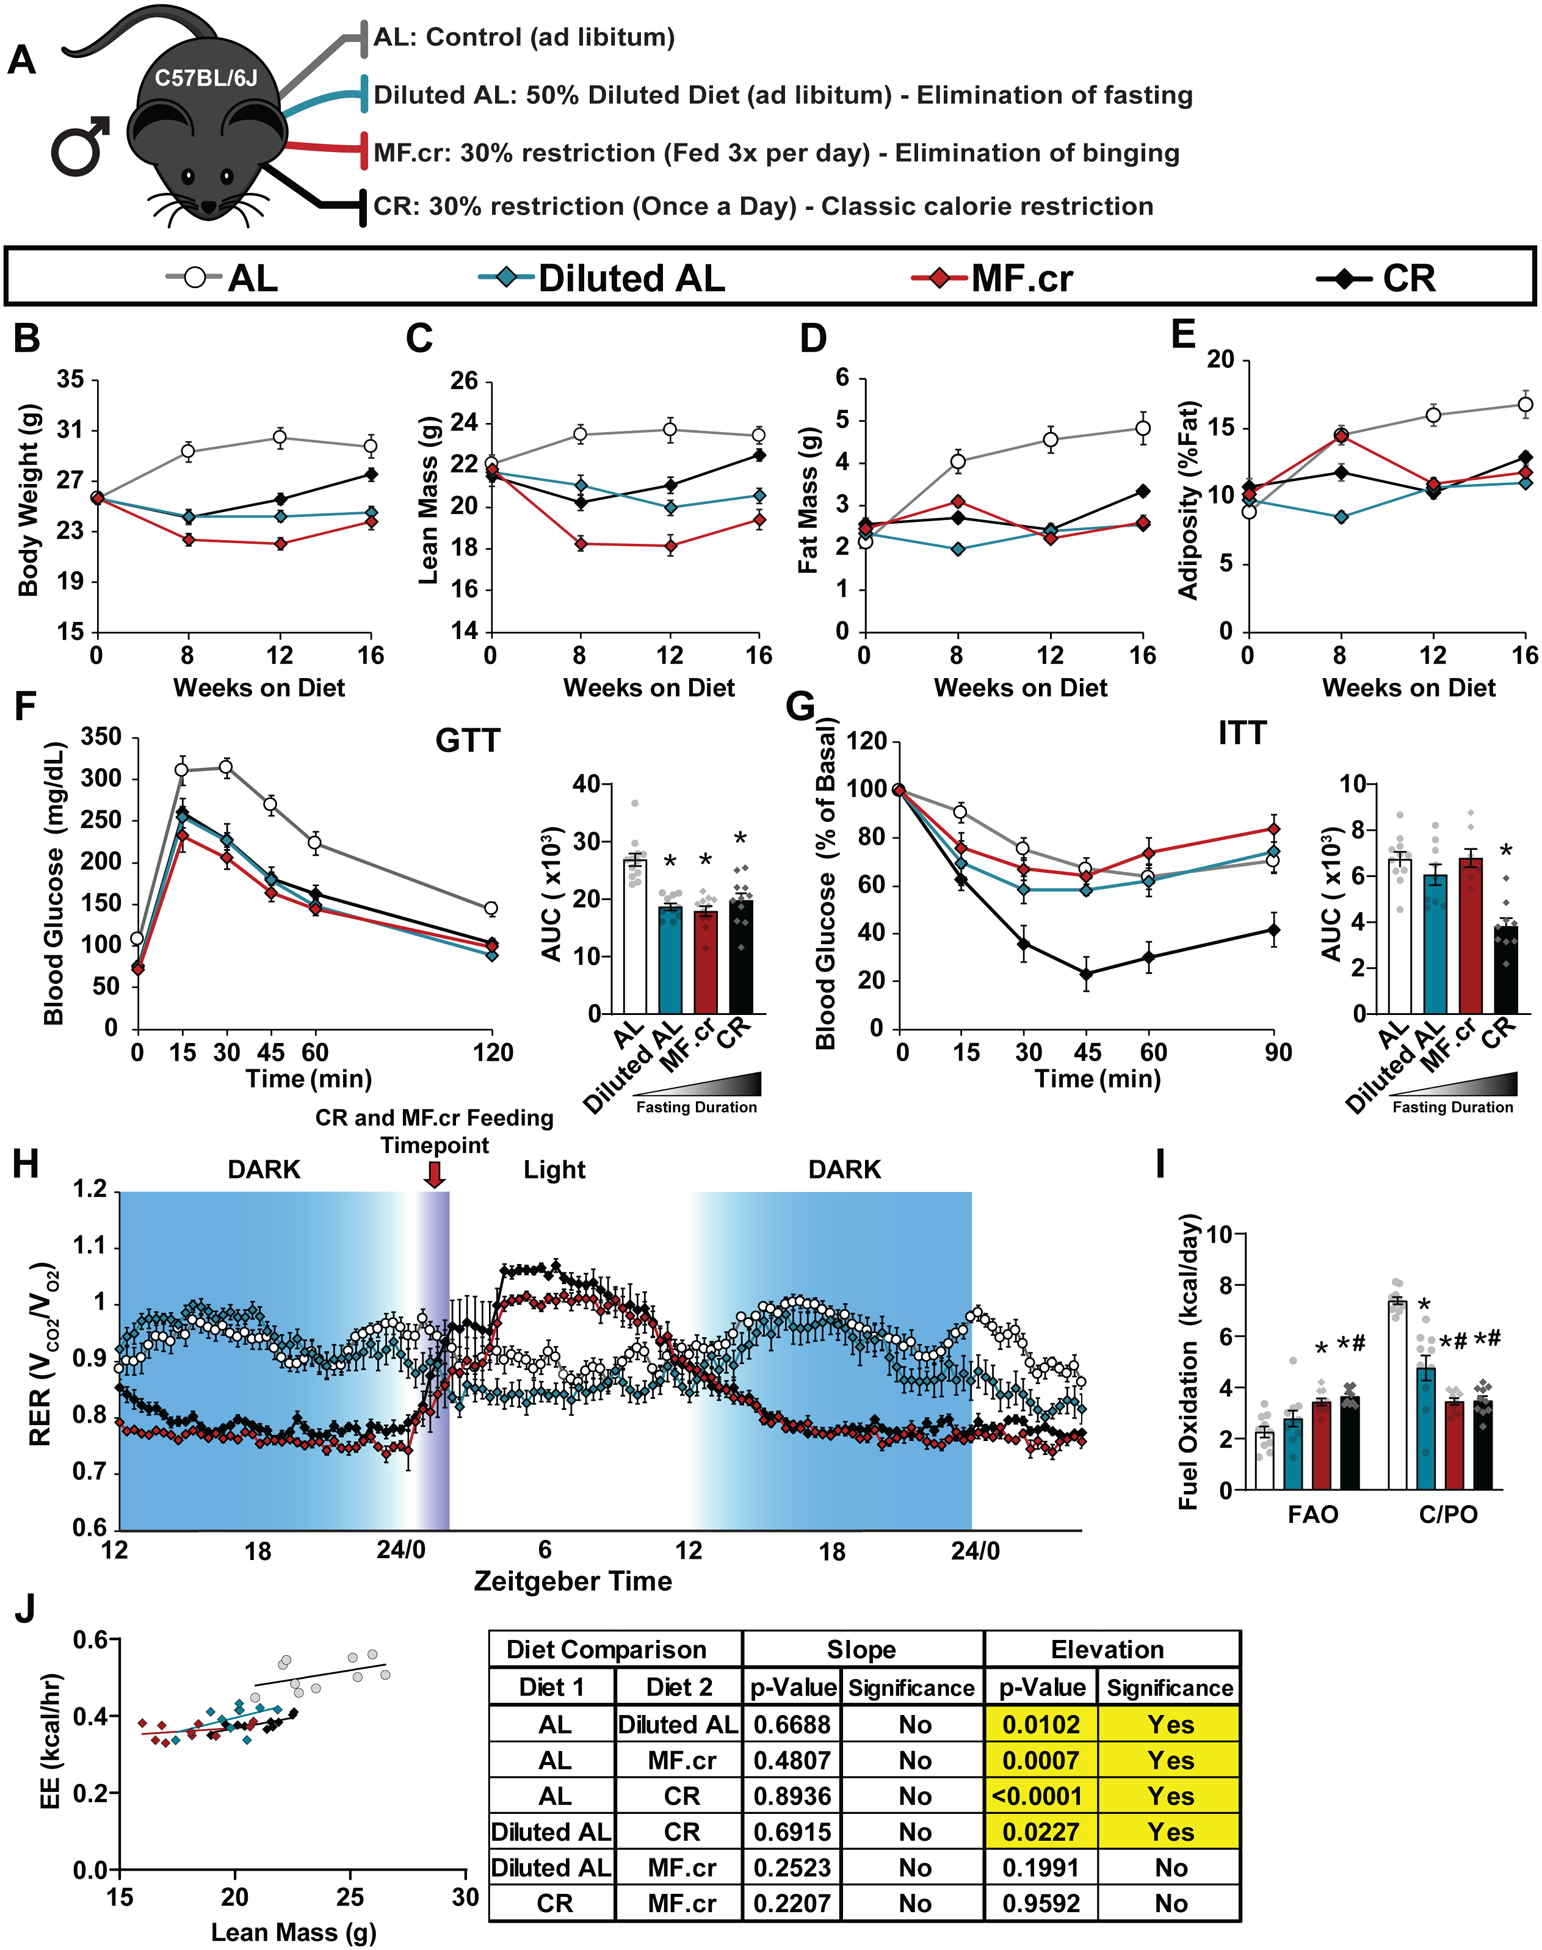
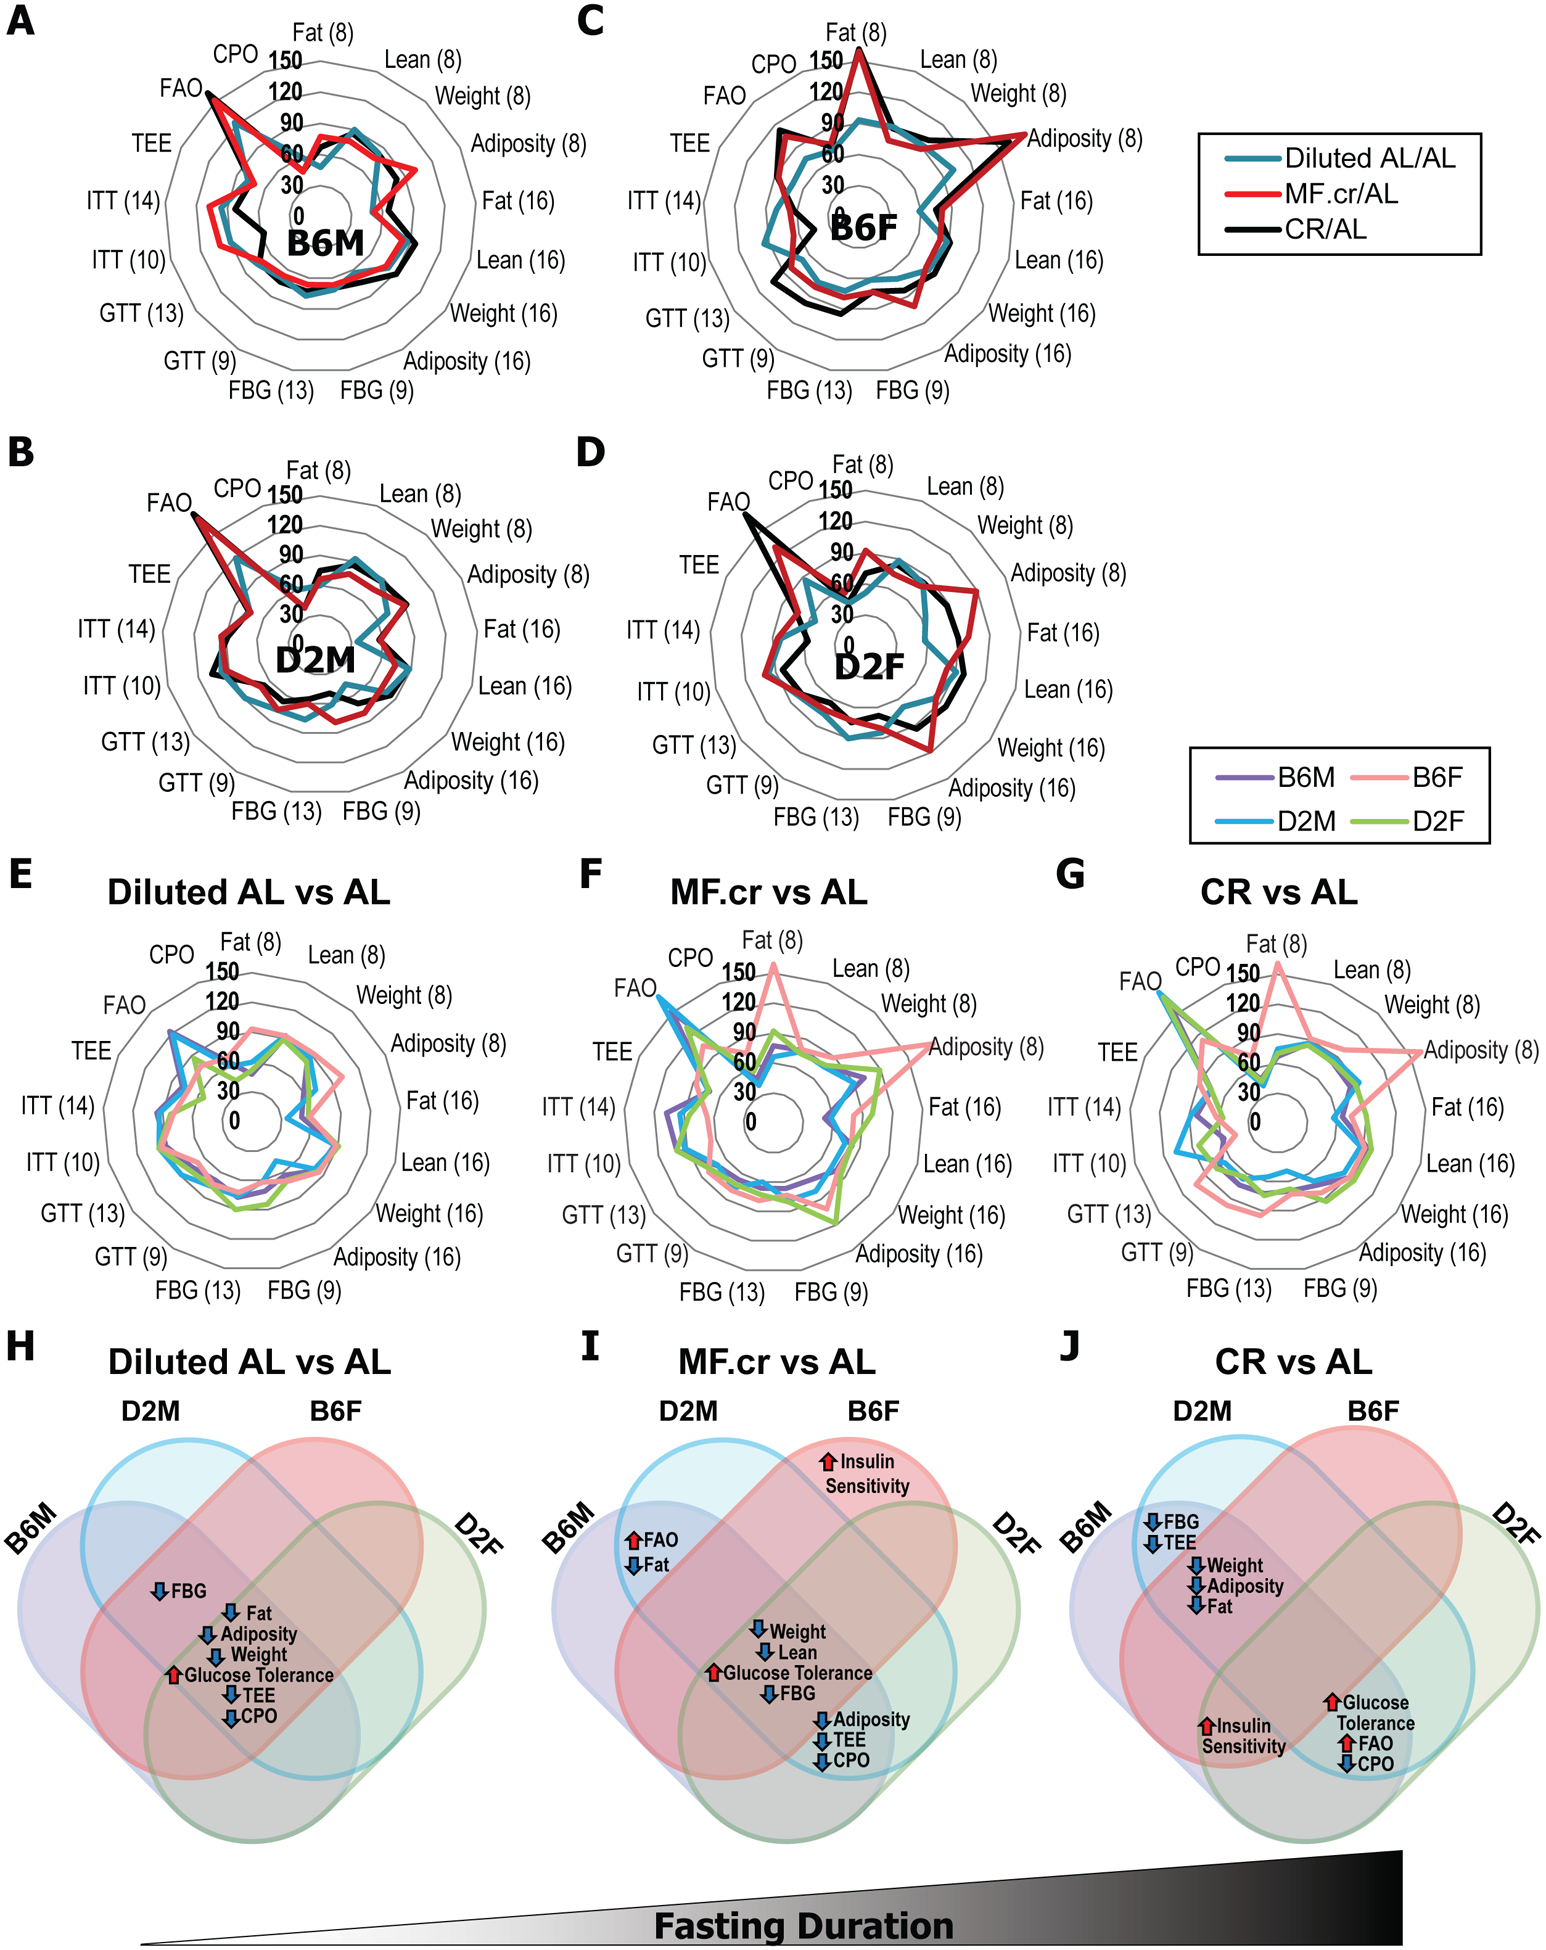
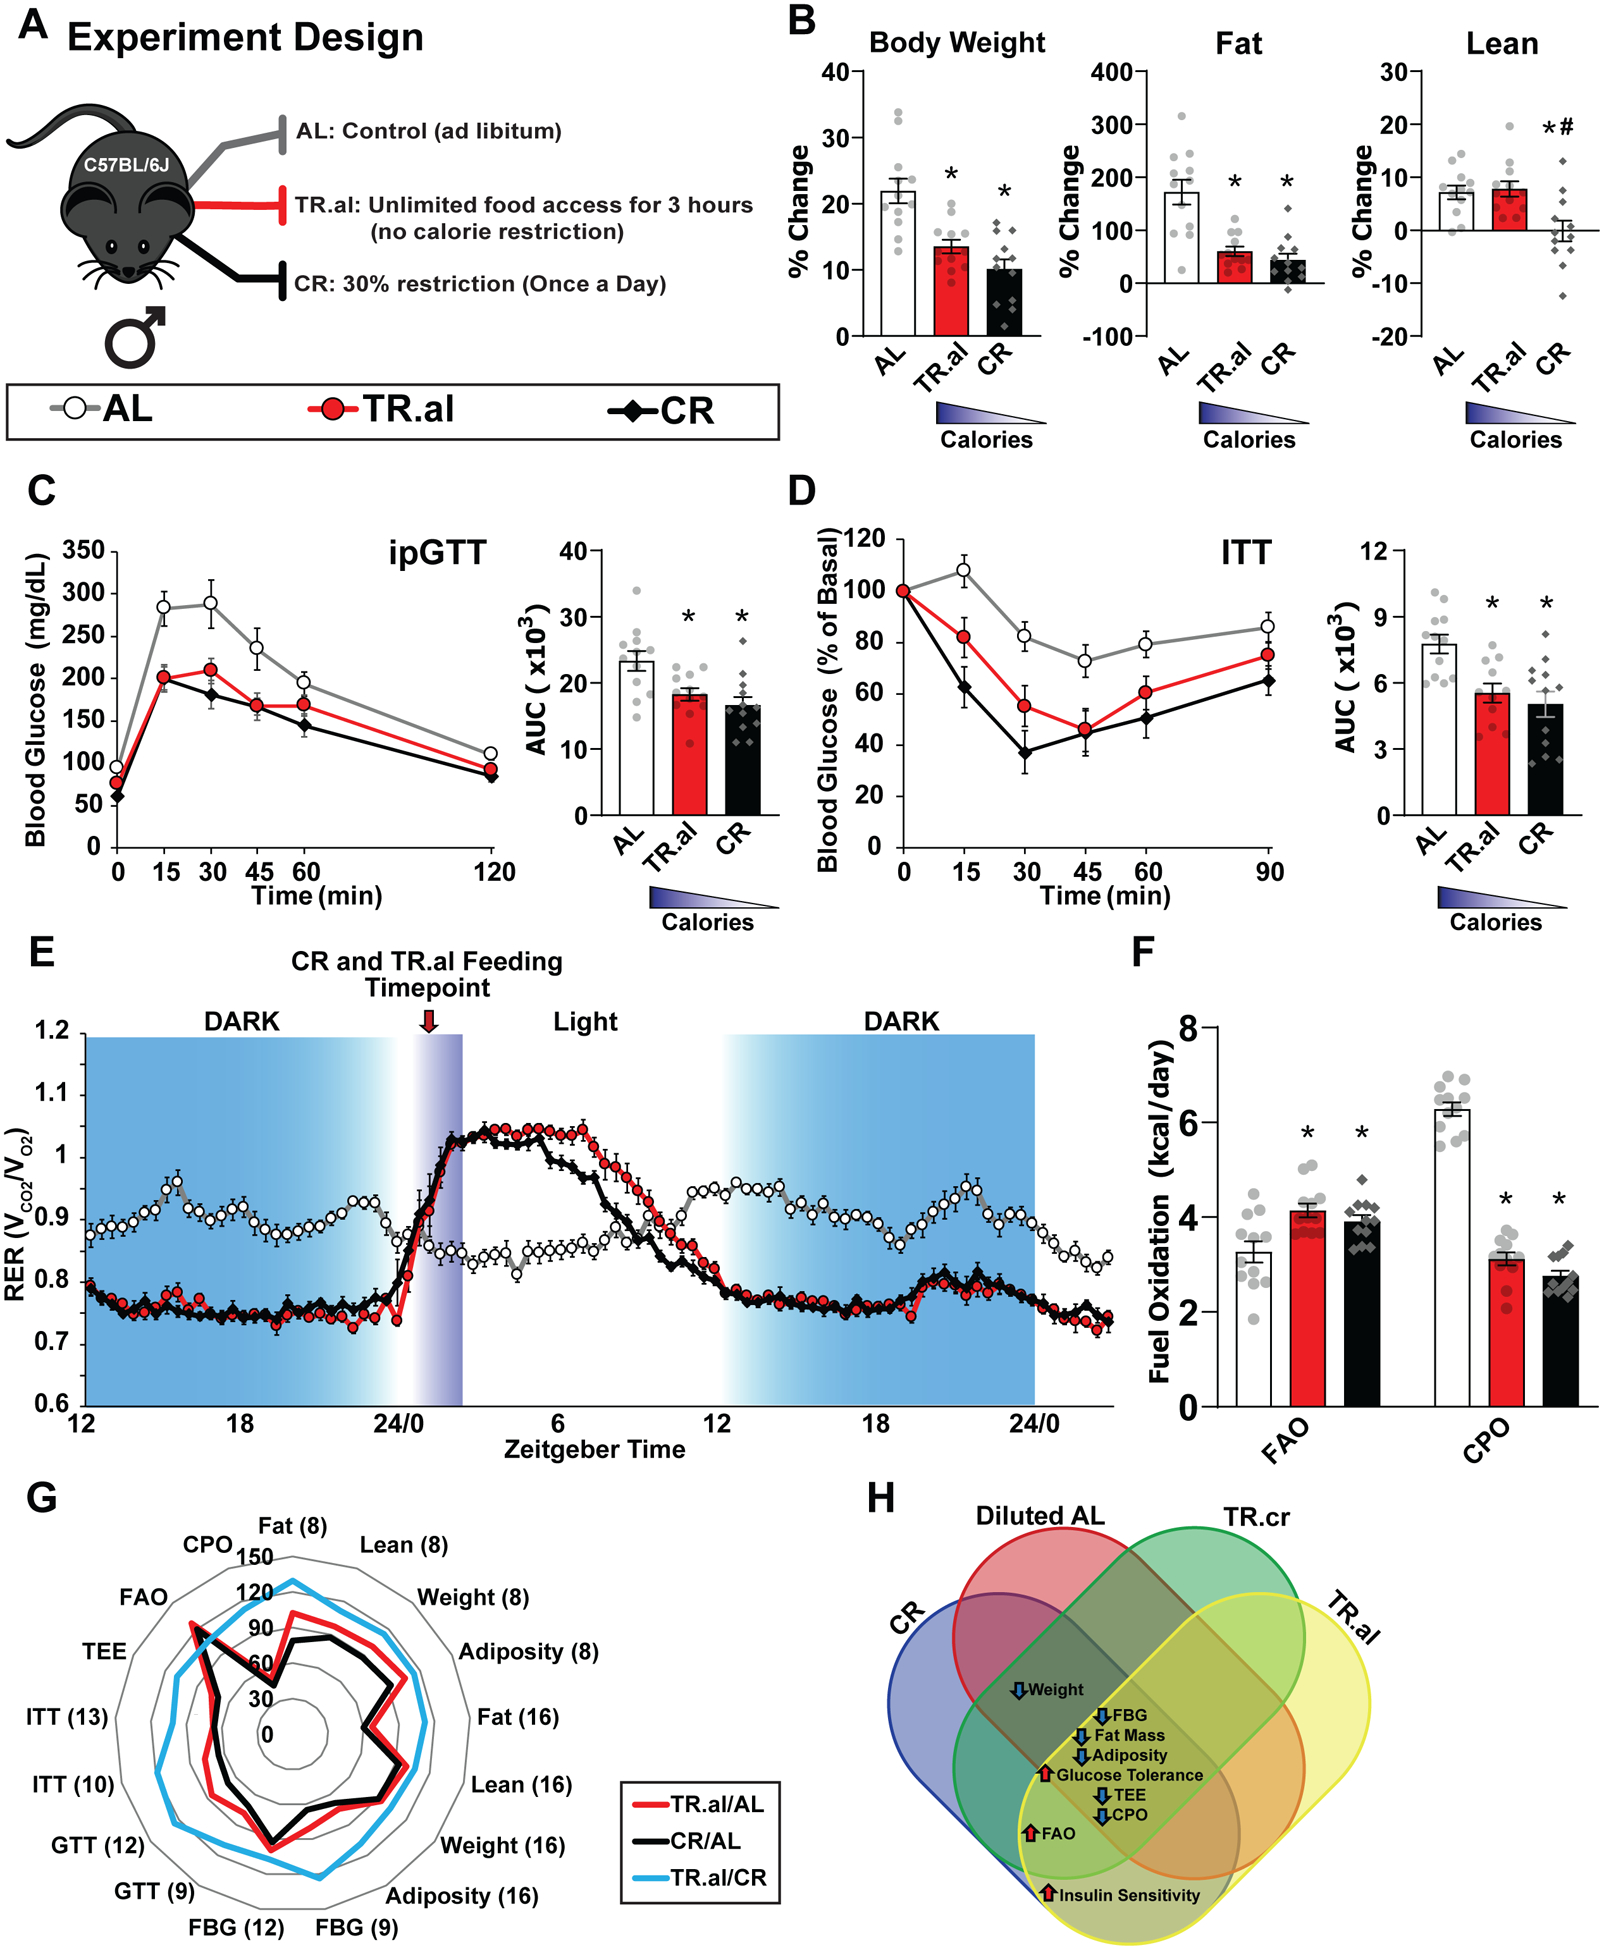
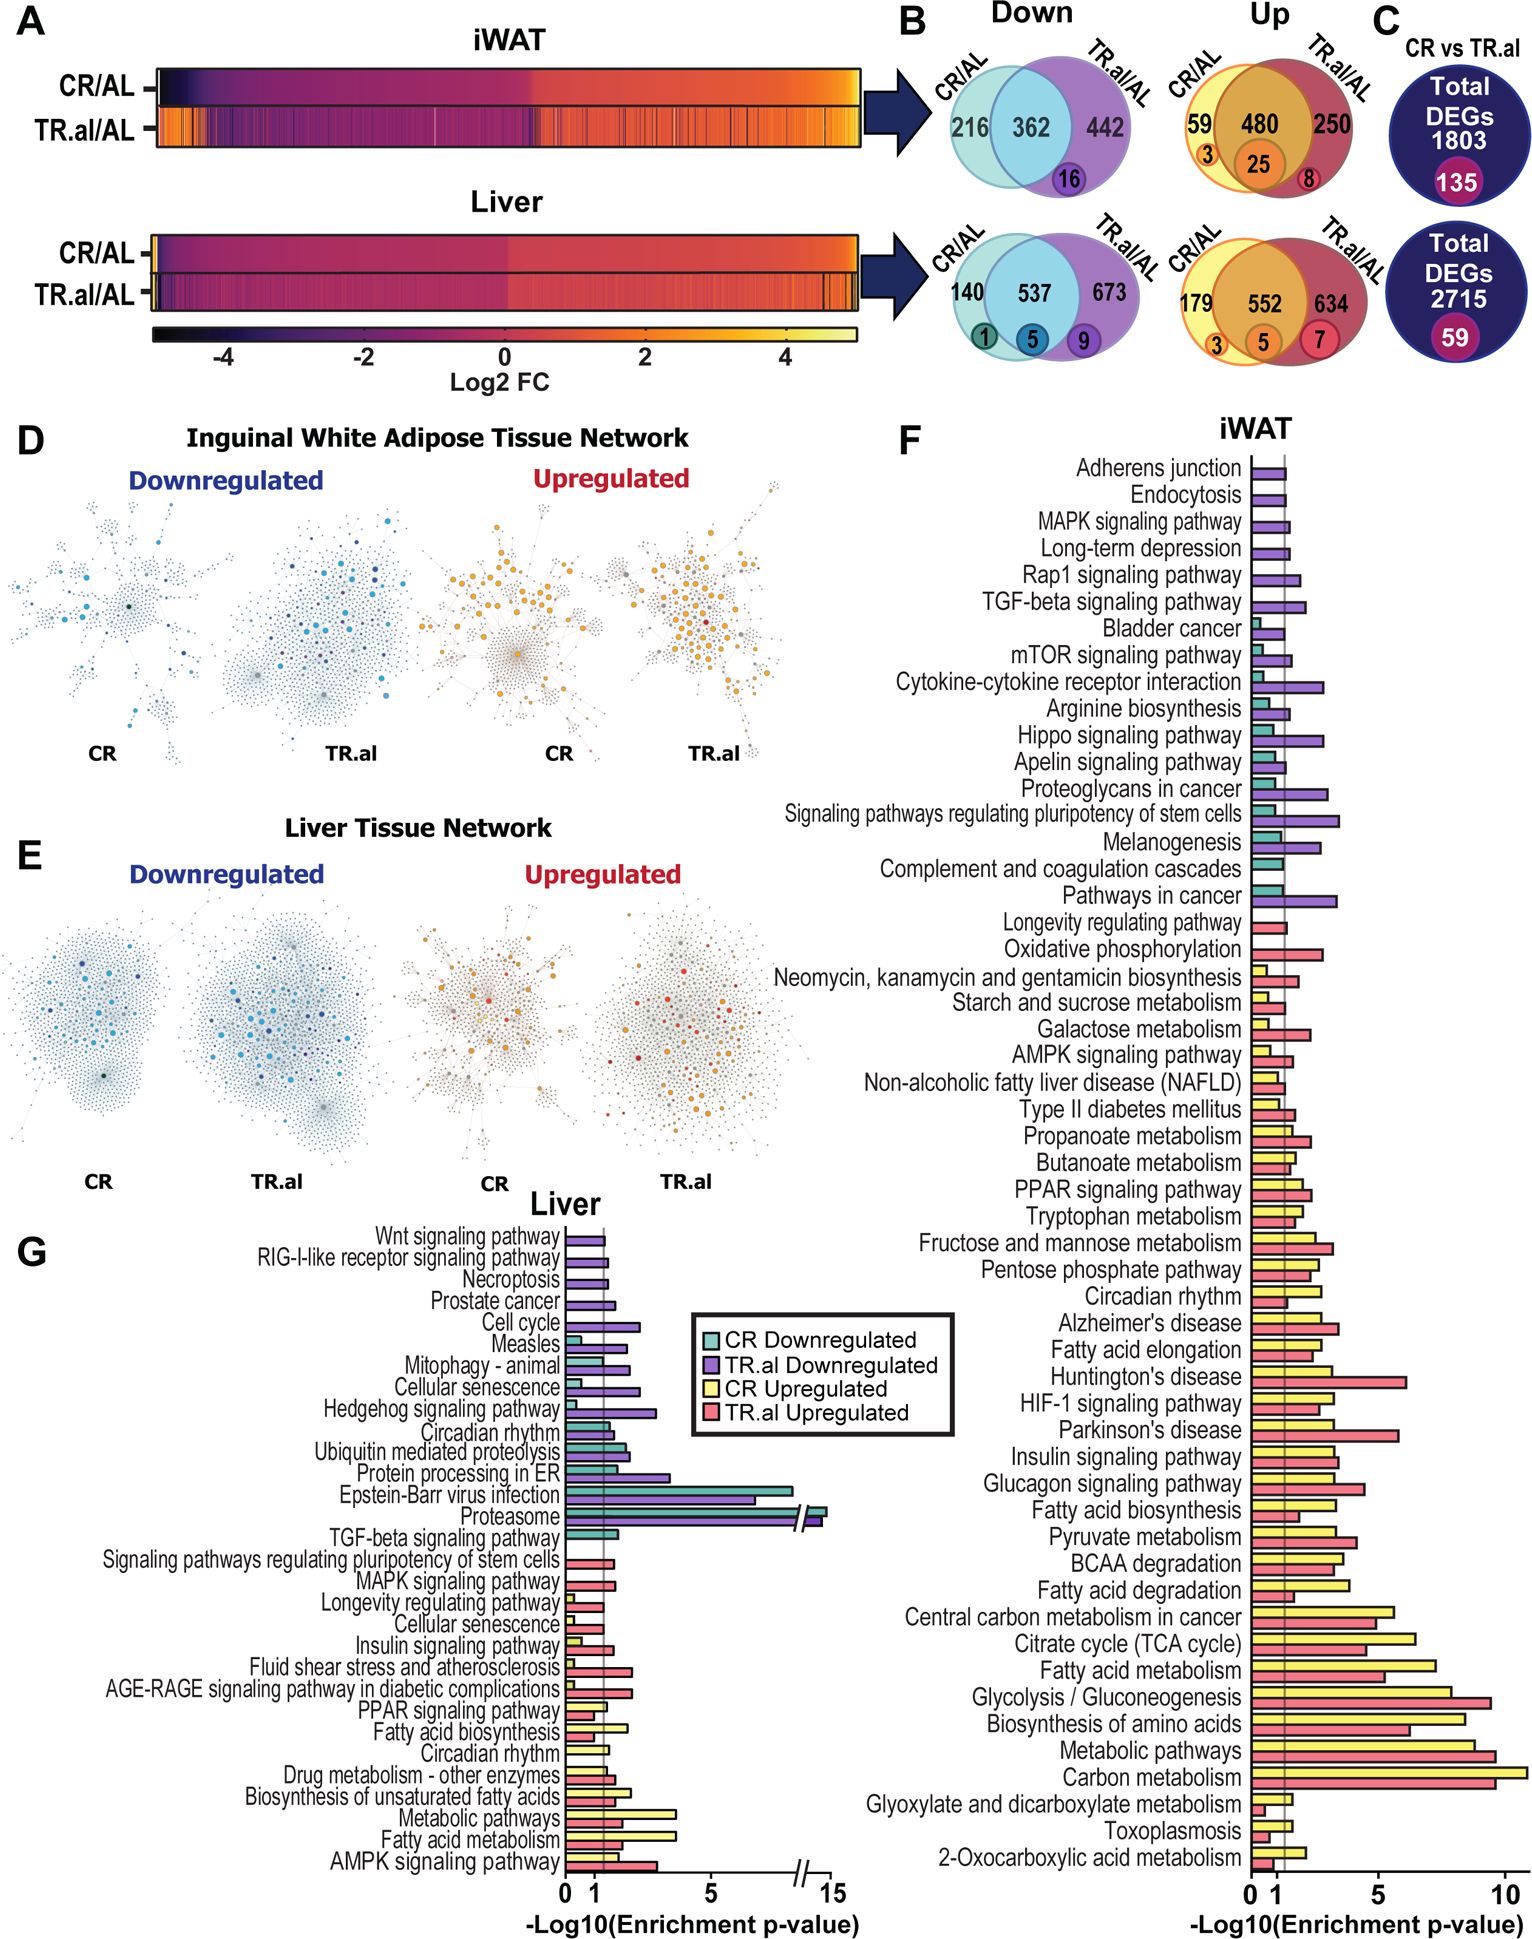
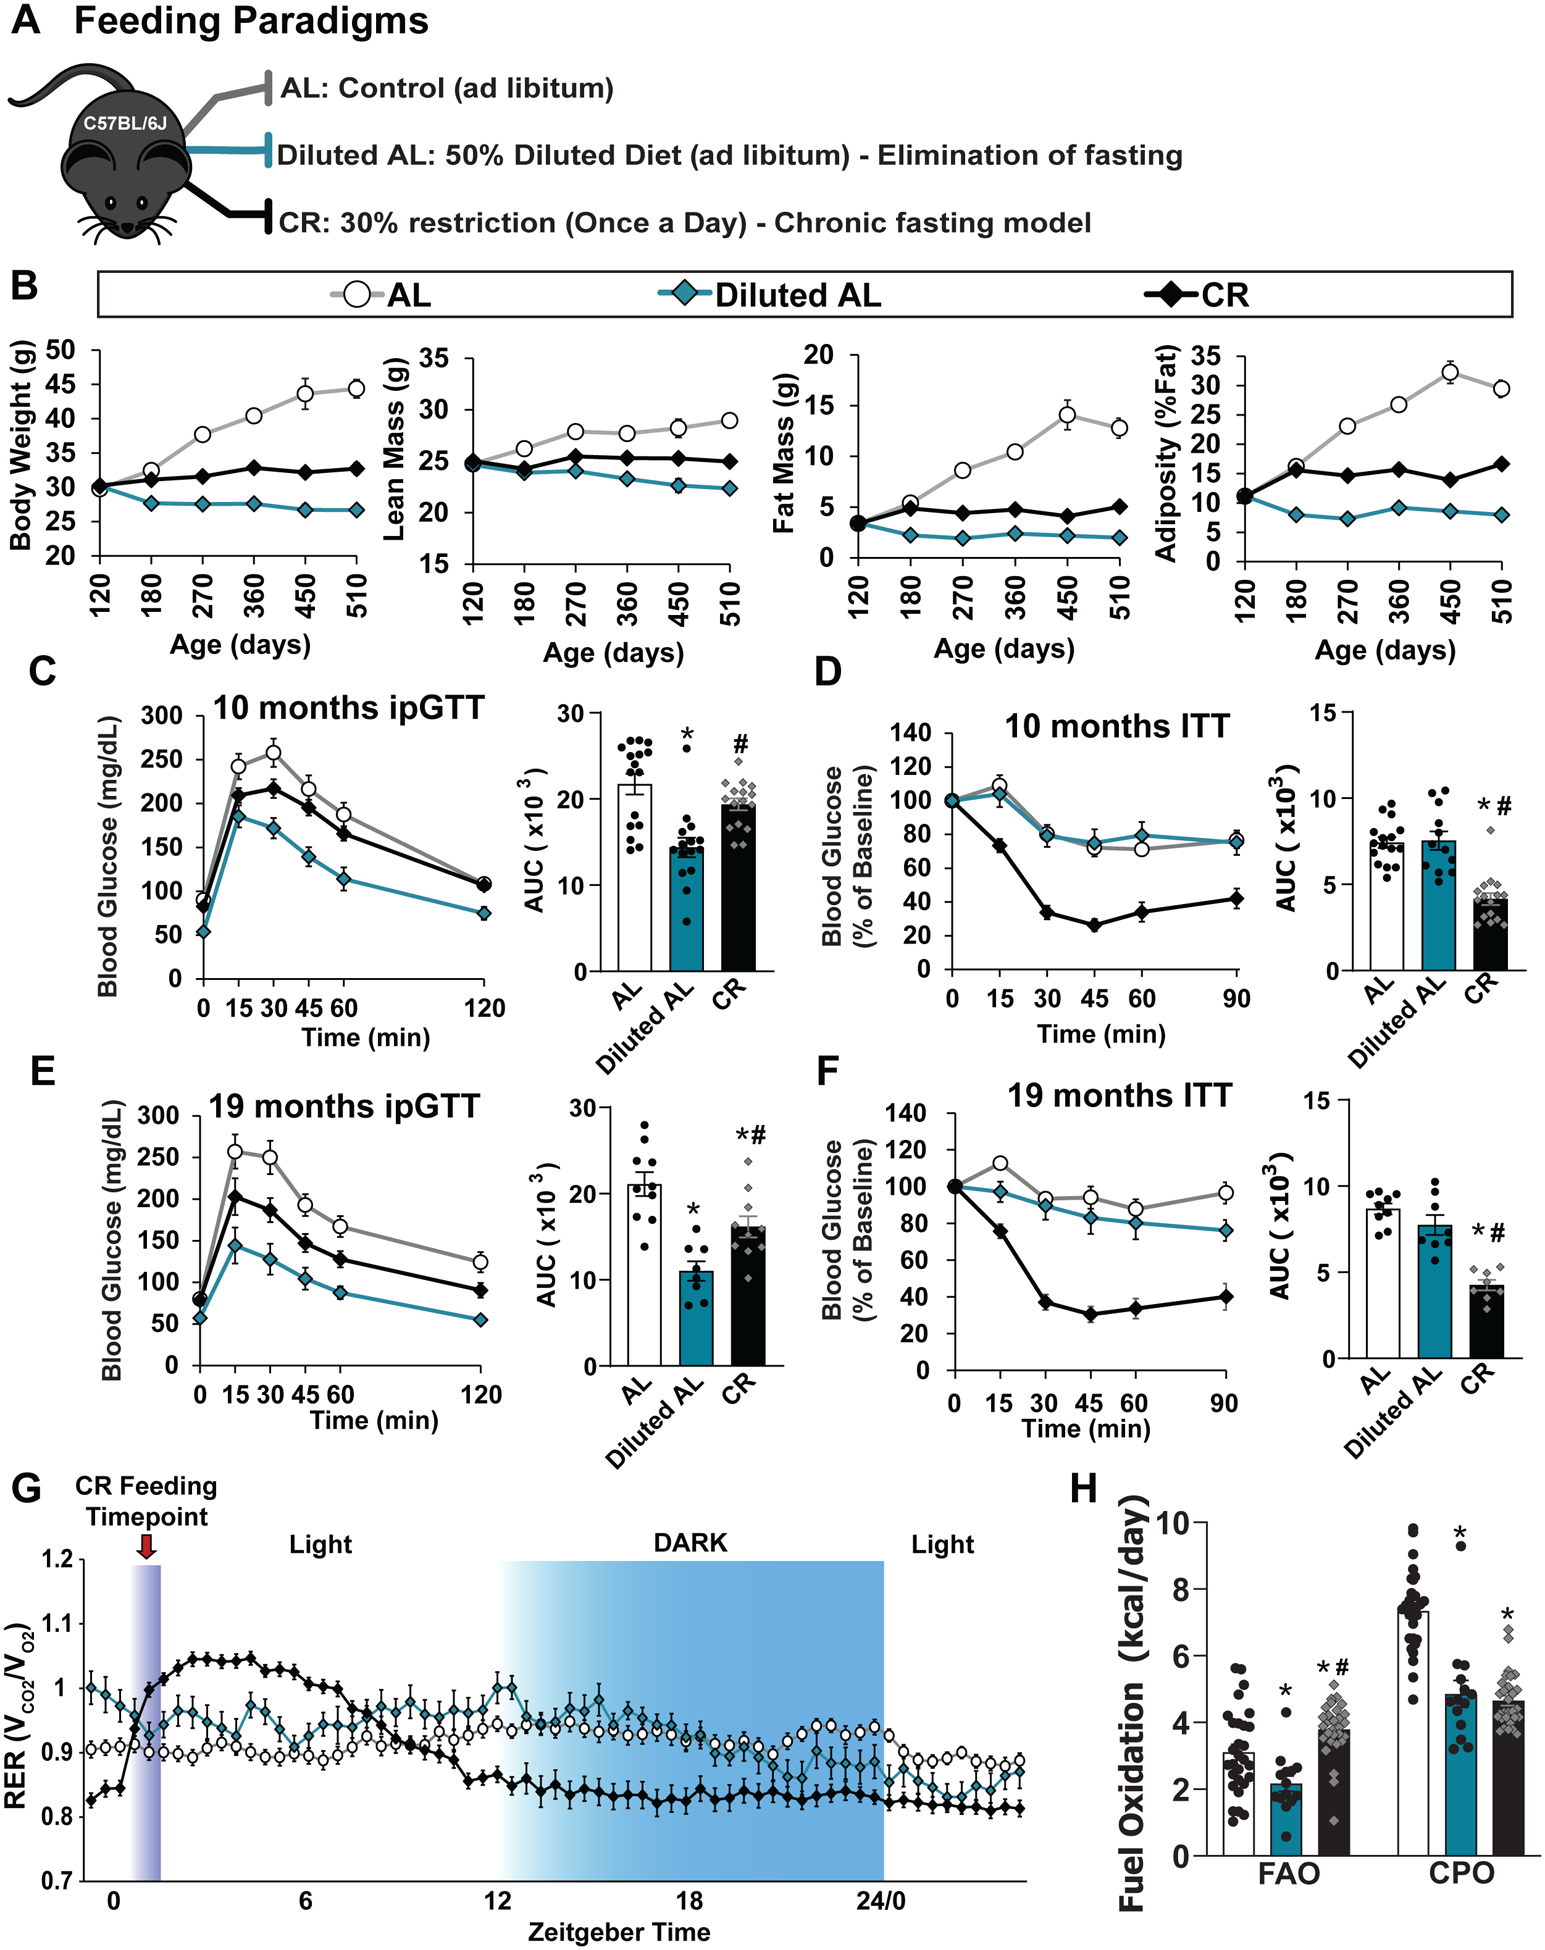
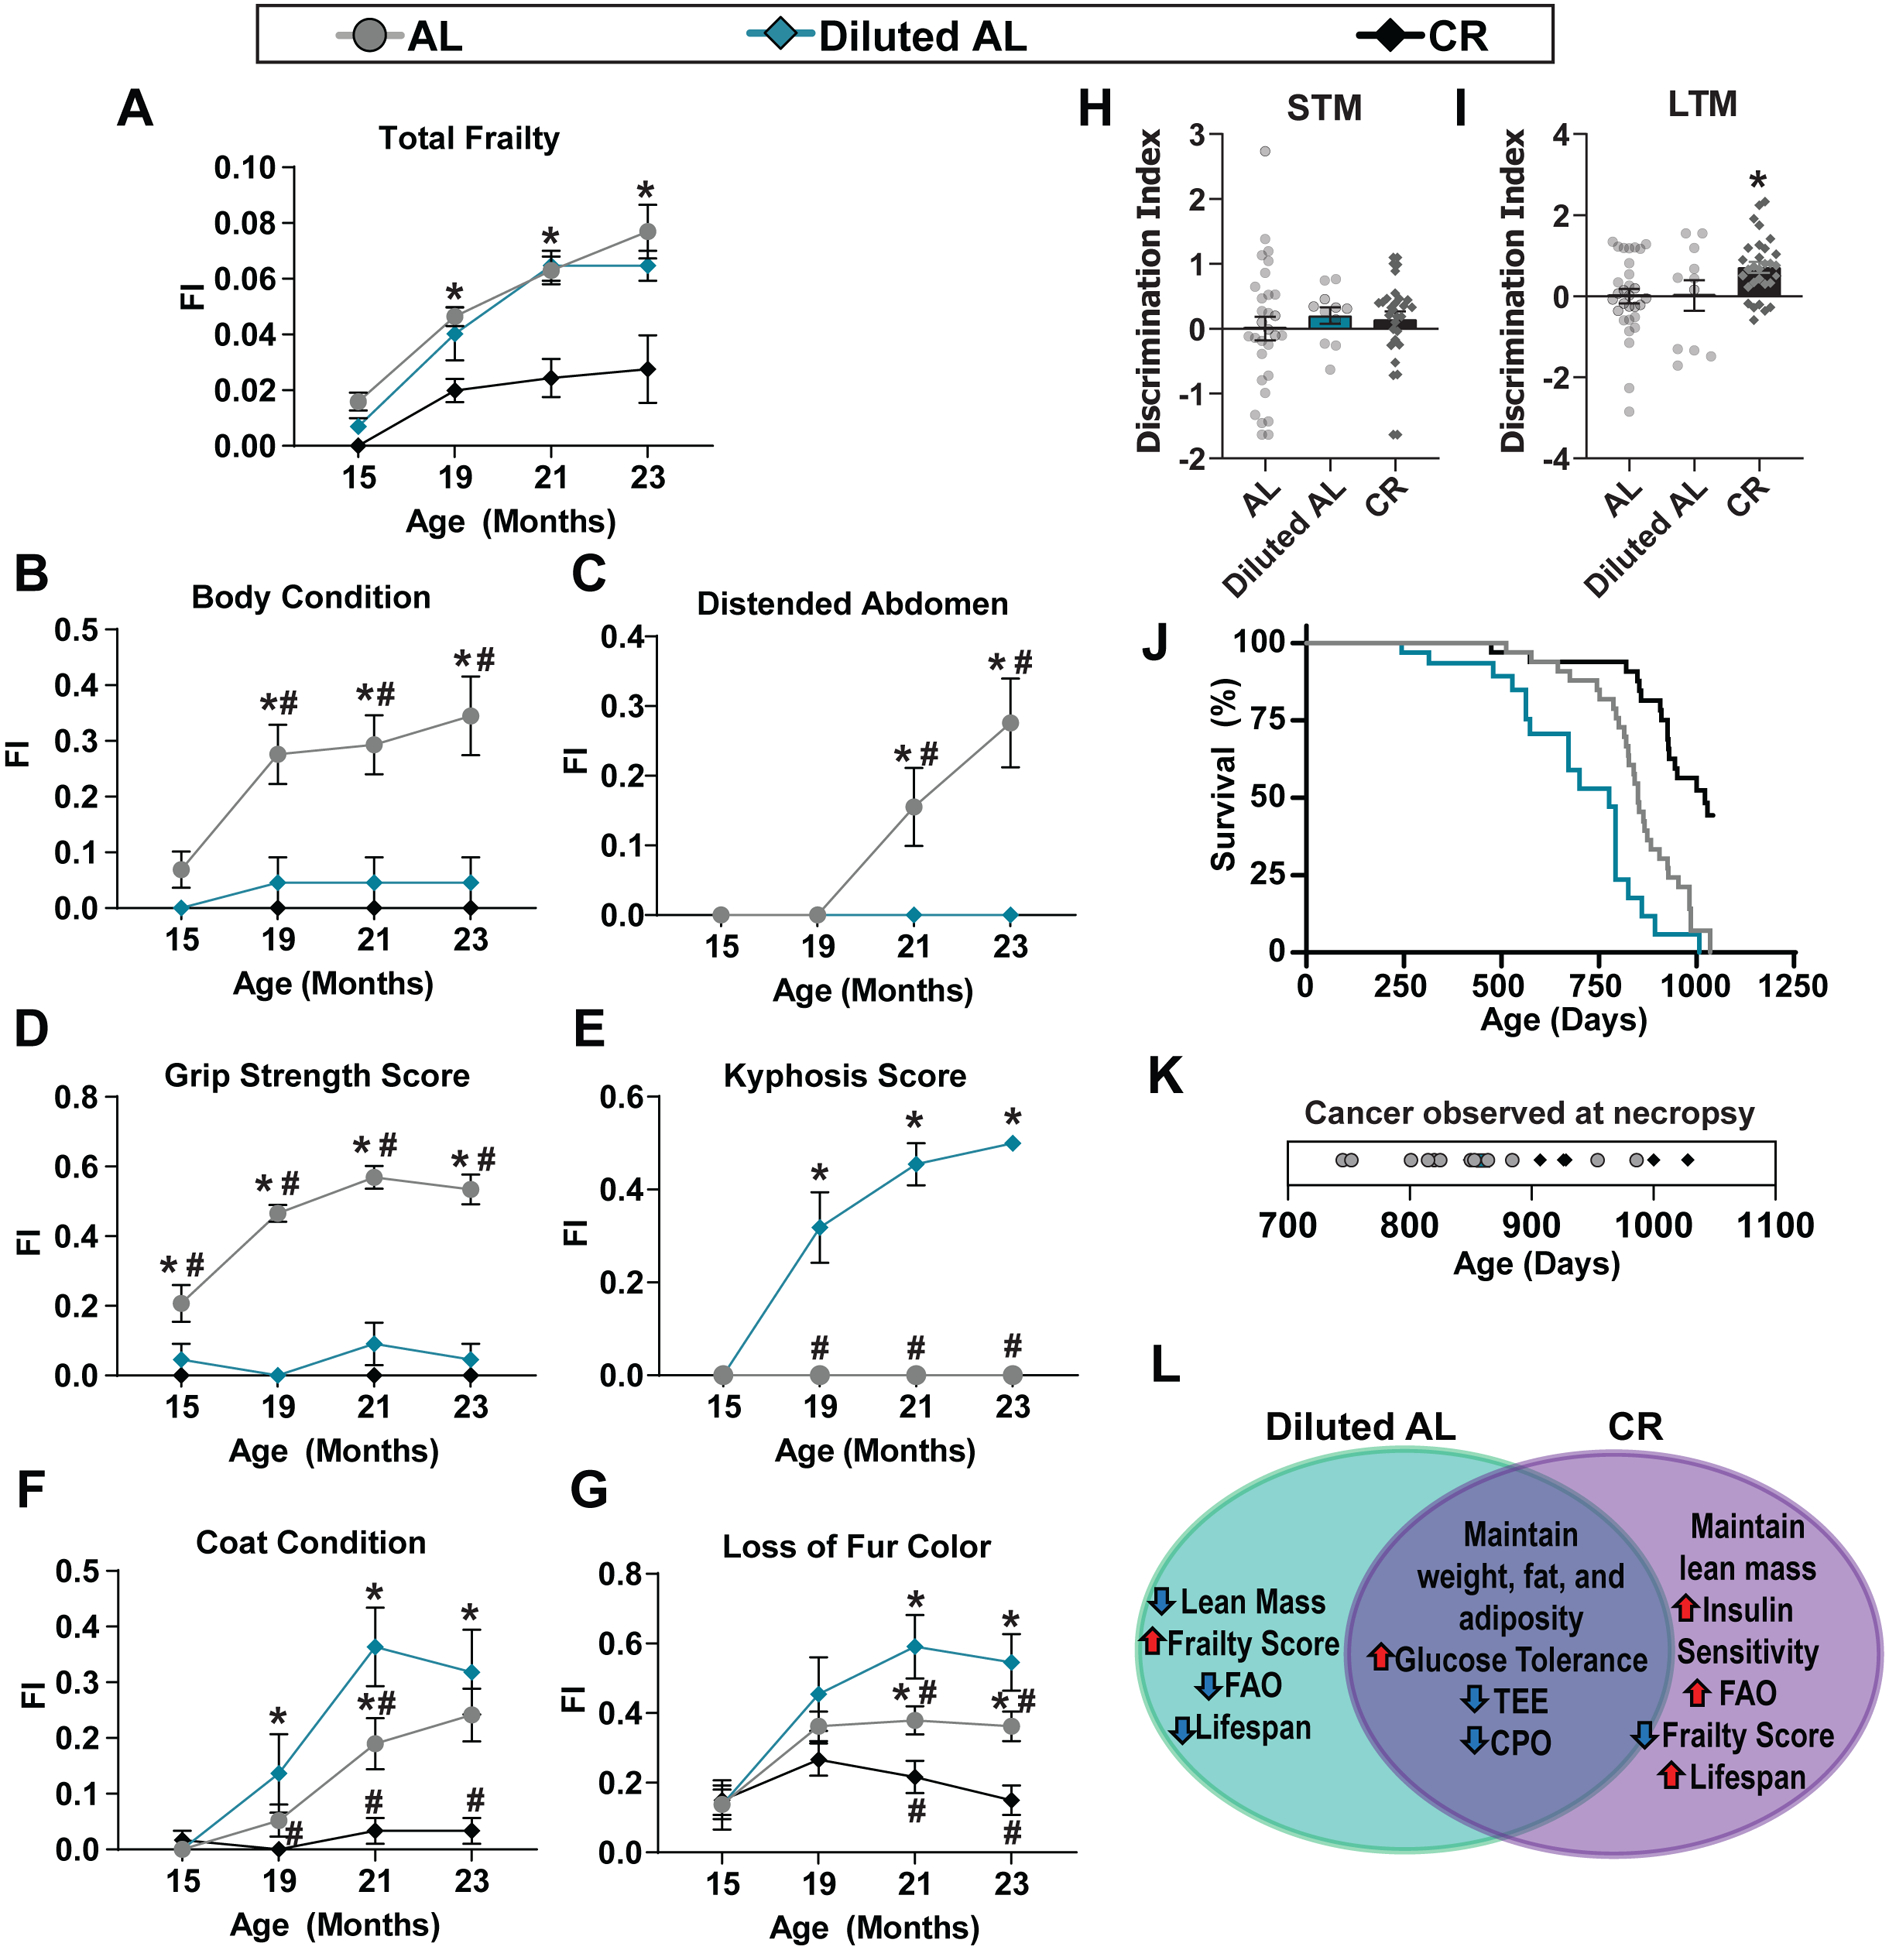
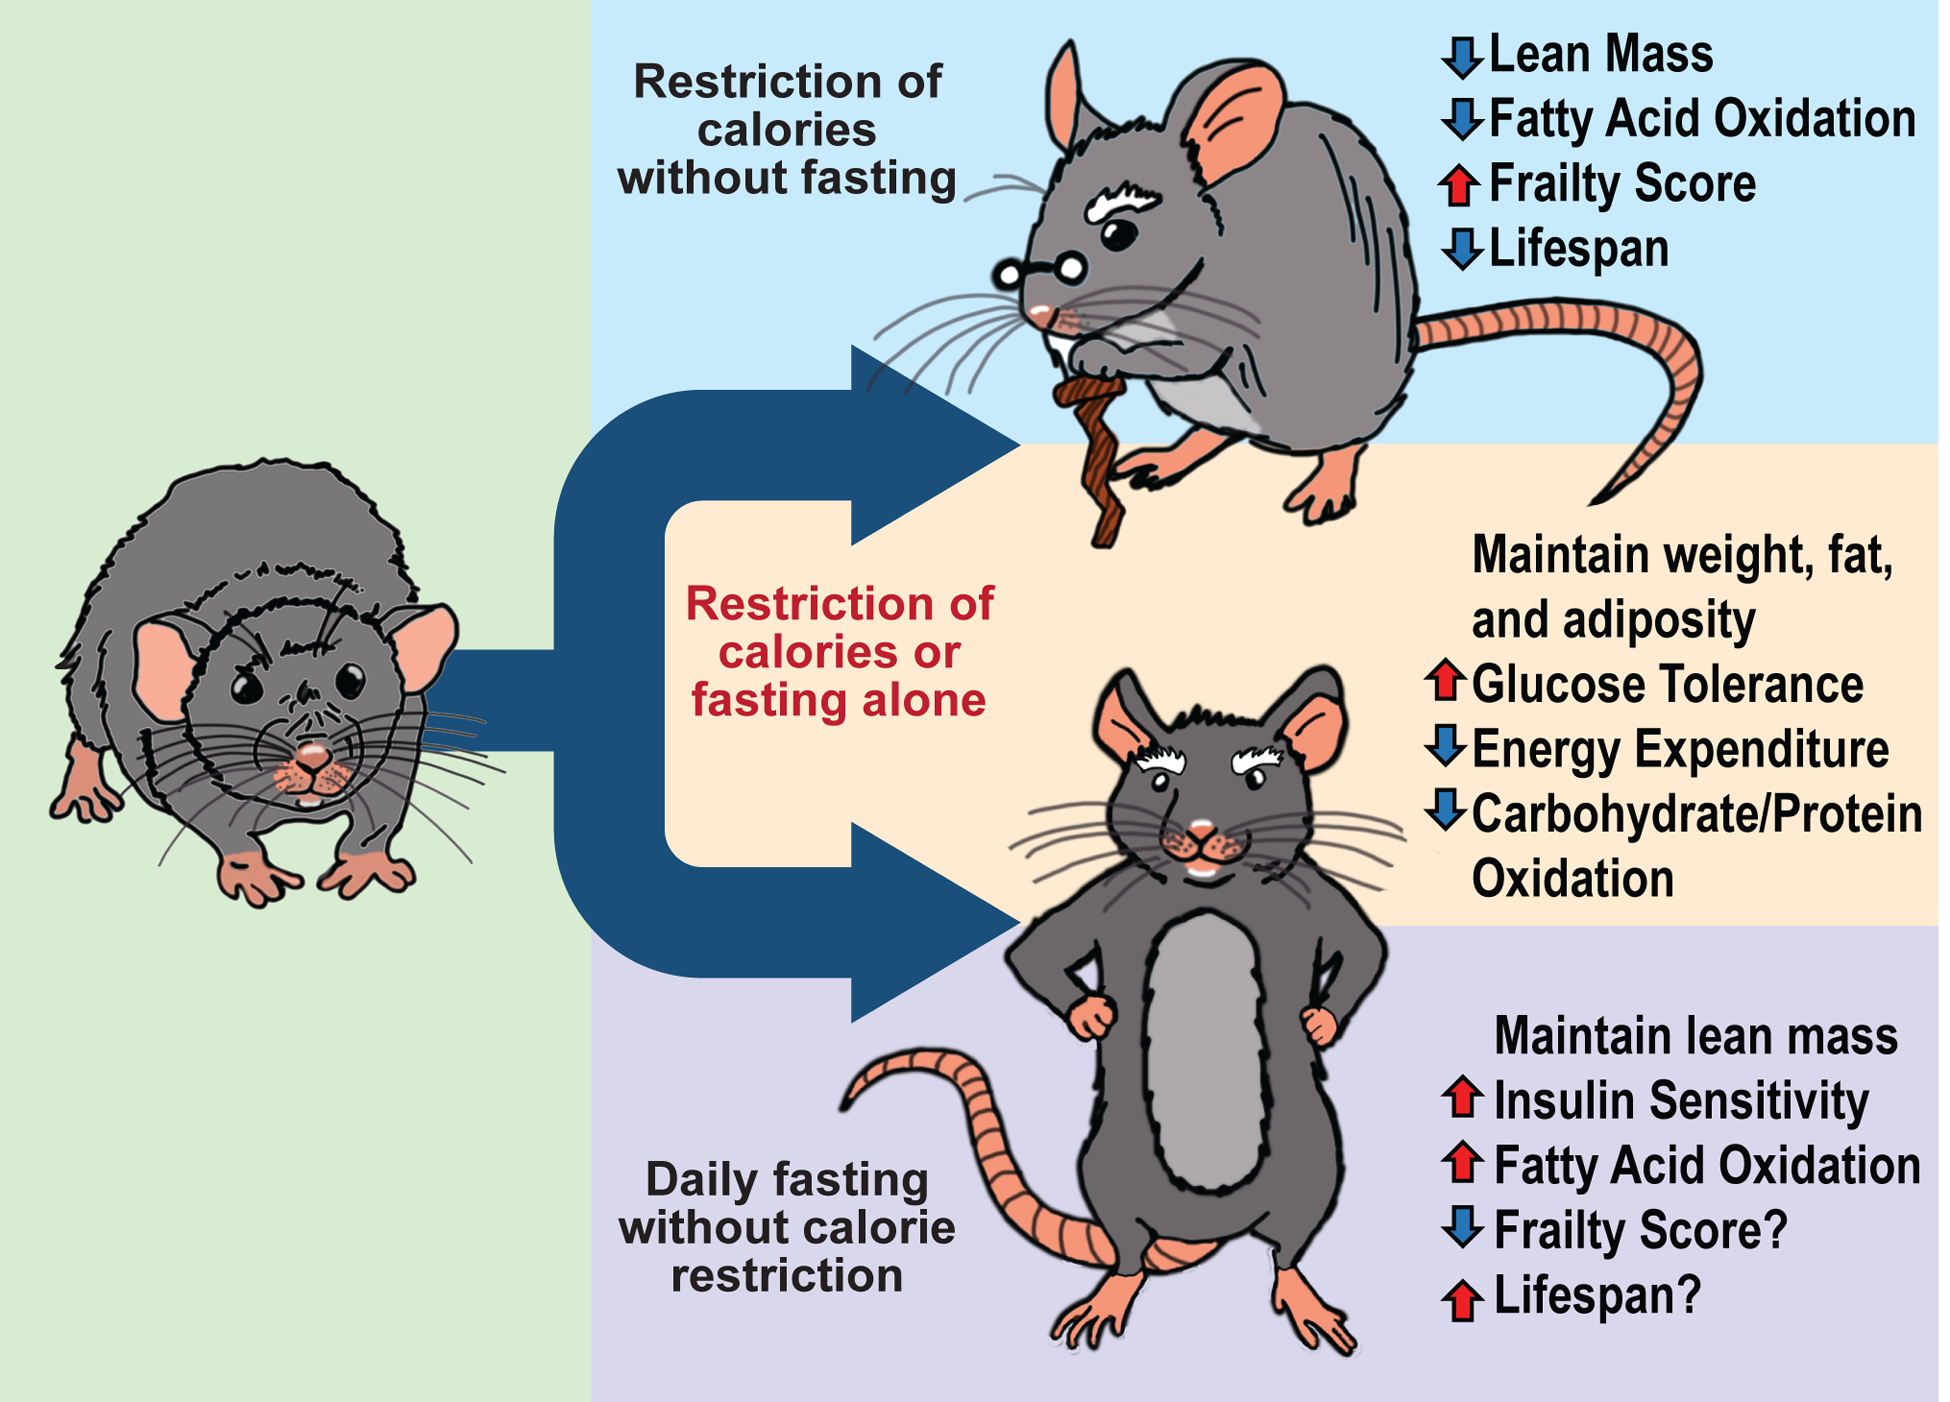
Calorie restriction (CR) promotes healthy ageing in diverse species. Recently, it has been shown that fasting for a portion of each day has metabolic benefits and promotes lifespan. These findings complicate the interpretation of rodent CR studies, in which animals typically eat only once per day and rapidly consume their food, which collaterally imposes fasting. Here we show that a prolonged fast is necessary for key metabolic, molecular and geroprotective effects of a CR diet. Using a series of feeding regimens, we dissect the effects of calories and fasting, and proceed to demonstrate that fasting alone recapitulates many of the physiological and molecular effects of CR. Our results shed new light on how both when and how much we eat regulate metabolic health and longevity, and demonstrate that daily prolonged fasting, and not solely reduced caloric intake, is likely responsible for the metabolic and geroprotective benefits of a CR diet.


Conflict of interest statement

COMPETING INTERESTS

D.W.L has received funding from, and is a scientific advisory board member of, Aeovian Pharmaceuticals, which seeks to develop novel, selective mTOR inhibitors for the treatment of various diseases. J.M.D. is a consultant for FORGE Life Sciences and co-founder of Galilei Bio-Sciences. The remaining authors declare no competing interests.

Figures

Extended Data Fig. 1
Extended Data Fig. 1. Additional measures of glucose homeostasis in male C57BL/6J mice
(A) Food Consumption (B) Glucose (AL, n = 12; Diluted AL, n = 10; MF.cr, n = 11; CR, n = 12 biologically independent mice) (C) and insulin (AL, n = 12; Diluted AL, n = 11; MF.cr, n = 10; CR, n = 8 biologically independent mice) tolerance tests after 13 or 14 weeks on the indicated diets. * symbol represents a significant difference versus AL-fed mice (p = 0.0009); # symbol represents a significant difference versus Diluted AL-fed mice (p = 0.0021); * symbol represents a significant difference versus MF.cr-fed mice (p = 0.0013) based on Tukey’s test post one-way ANOVA. (D-F) Fasting blood glucose (D), fasting and glucose-stimulated insulin secretion (15 minutes) (E), and calculated HOMA-IR (F). (D-F) AL, n = 9; Diluted AL, n = 8; MF.cr, n = 9; CR, n = 9 biologically independent mice; * symbol represents a significant difference versus AL-fed mice (Diluted AL, p = 0.0256; CR, p = 0.0127); insulin levels in fasted and glucose-stimulated states were analyzed separately. All data are represented as mean ± SEM.
Extended Data Fig. 2
Extended Data Fig. 2. Fasting is required for CR-mediated reprogramming of the hepatic metabolome
Targeted metabolomics were performed on the livers of male C57BL/6J mice fed AL, Diluted AL and CR diets (n = 6 biologically independent mice per diet). A) Heatmap of 59 targeted metabolites, represented as log2-fold change vs. AL-fed mice. B) sPLS-DA of liver metabolomics with CR mice sacrificed in the fasted state. C) sPLS-DA of liver metabolomics with CR sacrificed in the fed state. (D) Relative abundance of methionine and its metabolite S-Adenosyl-Homocysteine. * symbol represents a significant difference versus AL mice (p ≤ 0.0023); # symbol represents a significant difference versus Diluted AL mice (p ≤ 0.0024) based on Tukey’s test post one-way ANOVA. Overlaid box plots show center as median and 25th-75th percentiles; whiskers represent minima and maxima.
Extended Data Fig. 3
Extended Data Fig. 3. Additional hepatic metabolomic data
(A-C) Hepatic metabolites that showed a statistically significant difference during the fasted or fed state (n = 6 biologically independent mice per diet). A) Relative abundance of nucleotide/nucleoside metabolites. B) Relative abundance of TCA cycle metabolites. C) Relative abundance of amino acid metabolites. (A-C) * symbol represents a significant difference versus AL mice (p ≤ 0.05); # symbol represents a significant difference versus Diluted AL mice (p ≤ 0.05) based on Tukey’s test post one-way ANOVA. Overlaid box plots show center as median and 25th-75th percentiles; whiskers represent minima and maxima.
Extended Data Fig. 4
Extended Data Fig. 4. Fasting is required for CR-mediated reprogramming of the hepatic epigenome
Histone proteomics were performed on the livers of male C57BL/6J mice fed AL, Diluted AL and CR diets (n = 6 mice per group). A) Heatmap of histone H3 and H4 peptides represented as log2-fold change from AL. B) sPLS-DA of histone modifications. C) Statistically significant modified histones. (A-C) * symbol represents a significant difference versus AL mice (p ≤ 0.05); # symbol represents a significant difference versus Diluted AL mice (p ≤ 0.05) based on Tukey’s test post one-way ANOVA. Overlaid box plots show center as median and 25th-75th percentiles; whiskers represent minima and maxima
Extended Data Fig. 5
Extended Data Fig. 5. Metabolomic profile of skeletal muscle from AL, Diluted AL and CR mice
Targeted metabolomics were performed on skeletal muscle from male C57BL/6J mice fed AL, Diluted AL, and CR diets (n =10 biologically independent mice per diet). A) Heatmap of 28 targeted metabolites, represented as log2-fold change vs. AL-fed mice. B) sPLS-DA of skeletal muscle metabolites. C) Relative abundance of amino acid metabolites. D) Relative abundance of TCA cycle metabolites. (A-D) * symbol represents a significant difference versus AL mice (p ≤ 0.05); # symbol represents a significant difference versus Diluted AL mice (p ≤ 0.05) based on Tukey’s test post one-way ANOVA. Overlaid box plots show center as median and 25th-75th percentiles; whiskers represent minima and maxima.
Extended Data Fig. 6
Extended Data Fig. 6. The effect of three calorie restriction regimens on female C57BL/6J mice
(A) Outline of feeding regimens: AL, Diluted AL, CR and MF.cr. (B-E) Body composition measurement over 16 weeks on diet (AL, n = 12; Diluted AL, n = 10; MF.cr, n = 12; CR, n = 12 biologically independent mice); total body weight (B), lean mass (C), fat mass (D) and adiposity (E). (F-G) Glucose (n = 12 biologically independent mice per diet) (F) and insulin (AL, n = 12; Diluted AL, n = 12; MF.cr, n = 11; CR, n = 10 biologically independent mice) (G) tolerance tests after 9 or 10 weeks on the indicated diets. * symbol represents a significant difference versus AL-fed mice (Diluted AL, p < 0.0001; MF.cr, p ≤ 0.0012, CR, p < 0.0001); # symbol represents a significant difference versus Diluted AL-fed mice (MF.cr, p = 0.0019; CR, p ≤ 0.0001); @ symbol represents a significant difference versus MF.cr-fed mice (CR, p = 0.0043) based on Tukey’s test post one-way ANOVA. (H-J) Metabolic chamber analysis of mice fed the indicated diets. (H) Respiratory exchange ratio vs. time (n = 12 biologically independent mice per diet) (I) Fuel utilization was calculated for the 24-hour period following the indicated (arrow) refeeding time (n = 12 biologically independent mice per diet). * symbol represents a significant difference versus AL (Diluted AL, p = 0.0255); # symbol represents a significant difference versus Diluted AL (CR, p = 0.0274) based on Tukey’s test post one-way ANOVA performed separately for FAO and C/PO). (J) Energy expenditure as a function of lean mass was calculated for the 24-hour period following the indicated (arrow) refeeding time (n = 12 biologically independent mice per diet, data for each individual mouse is plotted; slopes and intercepts were calculated using ANCOVA). K) Food consumption (AL, n = 12; Diluted AL, n = 12; MF.cr, n = 12; CR, n = 11–12). All data are represented as mean ± SEM.
Extended Data Fig. 7
Extended Data Fig. 7. The effect of three calorie restriction regimens on male DBA/2J mice
(A) Outline of feeding regimens: AL, Diluted AL, CR and MF.cr. (B-E) Body composition measurement over 16 weeks on diet (AL, n = 11; Diluted AL, n = 11; MF.cr, n = 12; CR, n = 12 biologically independent mice); total body weight (B), lean mass (C), fat mass (D) and adiposity (E). (F-G) Glucose (AL, n = 12; Diluted AL, n = 12; MF.cr, n = 12; CR, n = 11 biologically independent mice) (F) and insulin (AL, n = 12; Diluted AL, n = 12; MF.cr, n = 12; CR, n = 11 biologically independent mice) (G) tolerance tests after 9 or 10 weeks on the indicated diets. * symbol represents a significant difference versus AL-fed mice (Diluted AL, p = 0.0059; MF.cr, p = 0.0052; CR, p < 0.0001) based on Tukey’s test post one-way ANOVA. (H-J) Metabolic chamber analysis of mice fed the indicated diets. (H) Respiratory exchange ratio vs. time (AL, n = 12; Diluted AL, n = 11; MF.cr, n = 11; CR, n = 11 biologically independent mice) (I) Fuel utilization was calculated for the 24-hour period following the indicated (arrow) refeeding time (AL, n = 12; Diluted AL, n = 11; MF.cr, n = 11; CR, n = 11 biologically independent mice). * symbol represents a significant difference versus AL (Diluted AL, p < 0.0001; MF.cr, p < 0.0001; CR, p < 0.0001); # symbol represents a significant difference versus Diluted AL (MF.cr, p ≤ 0.0002; CR, p ≤ 0.0001) based on Tukey’s test post one-way ANOVA performed separately for FAO and C/PO). (J) Energy expenditure as a function of lean mass was calculated for the 24-hour period following the indicated (arrow) refeeding time (AL, n = 12; Diluted AL, n = 11; MF.cr, n = 11; CR, n = 11 biologically independent mice, data for each individual mouse is plotted; slopes and intercepts were calculated using ANCOVA). K) Food consumption (n = 12 biologically independent mice per diet). All data are represented as mean ± SEM.
Extended Data Fig. 8
Extended Data Fig. 8. The effect of three calorie restriction regimens on female DBA/2J mice
(A) Outline of feeding regimens: AL, Diluted AL, CR and MF.cr. (B-E) Body composition measurement over 16 weeks on diet (AL, n = 12; Diluted AL, n = 7; MF.cr, n = 11; CR, n = 12 biologically independent mice); total body weight (B), lean mass (C), fat mass (D) and adiposity (E). (F-G) Glucose (AL, n = 12; Diluted AL, n = 11; MF.cr, n = 12; CR, n = 12 biologically independent mice) (F) and insulin (AL, n = 12; Diluted AL, n = 11; MF.cr, n = 12; CR, n = 12 biologically independent mice) (G) tolerance tests after 9 or 10 weeks on the indicated diets. * symbol represents a significant difference versus AL-fed mice (Diluted AL, p = 0.0033; MF.cr, p = 0.0003; CR, p < 0.0001) based on Tukey’s test post one-way ANOVA. (H-J) Metabolic chamber analysis of mice fed the indicated diets. (H) Respiratory exchange ratio vs. time (AL, n = 11; Diluted AL, n = 11; MF.cr, n = 11; CR, n = 10 biologically independent mice) (I) Fuel utilization was calculated for the 24-hour period following the indicated (arrow) refeeding time (AL, n = 11; Diluted AL, n = 11; MF.cr, n = 11; CR, n = 10 biologically independent mice). * symbol represents a significant difference versus AL (Diluted AL, p < 0.0001; MF.cr, p < 0.0001; CR, p < 0.0001); # symbol represents a significant difference versus Diluted AL (MF.cr, p ≤ 0.0128; CR, p < 0.0001) ; @ symbol represents a significant difference versus MF.cr (CR, p ≤ 0.0074) based on Tukey’s test post one-way ANOVA performed separately for FAO and C/PO). (J) Energy expenditure as a function of lean mass was calculated for the 24-hour period following the indicated (arrow) refeeding time (AL, n = 11; Diluted AL, n = 11; MF.cr, n = 11; CR, n = 10 biologically independent mice, data for each individual mouse is plotted; slopes and intercepts were calculated using ANCOVA). K) Food consumption (AL, n = 12; Diluted AL, n = 7–12; MF.cr, n = 12; CR, n = 12 biologically independent mice). All data are represented as mean ± SEM.
Extended Data Fig. 9
Extended Data Fig. 9. Additional data for C57BL/6J male mice fed CR or TR.al diets
A) Food consumption (n = 12 biologically independent mice per diet). B-E) Body composition (body weight, lean mass, fat mass and adiposity) of C57BL/6J male mice fed the indicated diets for 4 months (n = 12 biologically independent mice per diet; statistics on supplementary table 7). F-G) Glucose (n = 12 biologically independent mice per diet) (F) and insulin (AL, n = 12; TR.al, n = 12; CR, n = 11 biologically independent mice) (G) tolerance tests were performed after 13–14 weeks, respectively on the indicated diets. (H-J) Fasting blood glucose (H), fasting and glucose-stimulated insulin secretion (15 minutes) (I), and calculated HOMA2-IR (J) (AL, n = 12; TR.al, n = 11; CR, n = 12 biologically independent mice). * symbol represents a significant difference versus AL (TR.al, p ≤ 0.0018; CR, p ≤ 0.0477); # symbol represents a significant difference versus TR.al (MF.cr, p ≤ 0.0187; CR, p = 0.0478) based on Tukey’s test post one-way ANOVA. All data are represented as mean ± SEM.
Extended Data Fig. 10
Extended Data Fig. 10. Food consumption, absorption and gut integrity
A) Food consumption (AL, n = 27–33; Diluted AL, n = 8–33; CR, n = 30–33 biologically independent mice). B) Food absorption calculation by bomb calorimetry of 19-month-old C57BL/6J male mice fed the indicated diets for 13 months (n = 6 biologically independent mice per diet) C) Gut integrity calculation by FITC-dextran of 20-month-old C57BL/6J male mice (n = 6 biologically independent mice per diet). * symbol represents a significant difference versus AL (CR, p = 0.0160); # symbol represents a significant difference versus Diluted AL (CR, p ≤ 0.0281) based on Tukey’s test post two-way ANOVA) Data are represented as mean ± SEM.
Figure 1:
Figure 1:. Prolonged fasting is required for the CR-mediated increase in insulin sensitivity and alterations in fuel source selection in male C57BL/6J mice.
(A) Outline of feeding regimens: AL, Diluted AL, CR and MF.cr. (B-E) Body composition measurement over 16 weeks on diet (n = 10 biologically independent mice per diet); total body weight (B), lean mass (C), fat mass (D) and adiposity (E). (F-G) Glucose (AL, n = 12; Diluted AL, n = 10; MF.cr, n = 11; CR, n = 11 biologically independent mice) (F) and insulin (AL, n = 11; Diluted AL, n = 9; MF.cr, n = 8; CR, n = 9 biologically independent mice) (G) tolerance tests after 9 or 10 weeks on the indicated diets. * symbol represents a significant difference versus AL-fed mice (P<0.0001) based on Tukey’s test post one-way ANOVA. (H-J) Metabolic chamber analysis of mice fed the indicated diets. (H) Respiratory exchange ratio vs. time (n = 10 biologically independent mice per diet) (I) Fuel utilization was calculated for the 24-hour period following the indicated (arrow) refeeding time (n = 10 biologically independent mice per diet). * symbol represents a significant difference versus AL (Diluted AL, p <0.0001; MF.cr, p ≤ 0.0018; CR, p ≤ 0.0002); # symbol represents a significant difference versus Diluted AL (MF.cr, p = 0.0097; CR, p ≤ 0.0283) based on Tukey’s test post one-way ANOVA performed separately for FAO and C/PO). (J) Energy expenditure as a function of lean mass was calculated for the 24-hour period following the indicated (arrow) refeeding time (n = 10 mice per diet, data for each individual mouse is plotted; slopes and intercepts were calculated using ANCOVA). All data are represented as mean ± SEM.
Figure 2:
Figure 2:. Distinct physiological responses to diet in different strains and sexes of mice.
(A-G) Radar chart visualization of 17 phenotypes measured in C57BL/6J and DBA/2J male and female mice while consuming the indicated diets. (A-D) The distance from the center represents the effect of each restricted diet vs. AL-fed mice (no difference = 100%; Blue – Diluted AL; Red – MF.cr; Black – CR). (E-G) The distance from the center represents the effect of (E) Diluted AL-fed vs. AL, (F) MF.cr-fed vs. AL-fed, and (G) CR vs. AL for the indicated strain and sexes of mice (no difference = 100%). FBG = Fasting blood glucose, GTT and ITT = computed area under the curve for each test; number in parentheses refers to the weeks on the diet each phenotype was determined. (H-J) Summary comparison of diet effect on phenotypes compared to AL for each strain and sex.
Figure 3:
Figure 3:. Fasting alone recapitulates the metabolic effects of a CR diet.
A) Schematic of feeding paradigms: AL, TR.al, and CR. B) Change in body weight, fat, and lean mass over the course of 16 weeks consuming the indicated diets (n = 12 biologically independent mice per diet). (C-D) Glucose (n = 12 biologically independent mice per diet) * symbol represents a significant difference versus AL-fed mice (TR.al, p = 0.0204; CR, p = 0.0019) based on Tukey’s test post one-way ANOVA. (C) and insulin (AL, n = 12; TR.al, n = 11; n = 8; CR, n = 12 biologically independent mice) * symbol represents a significant difference versus AL-fed mice (TR.al, p = 0.0086; CR, p = 0.0010) based on Tukey’s test post one-way ANOVA. (D) tolerance tests were conducted after mice were fed the indicated diets for 9 or 10 weeks, respectively. E) Respiratory exchange ratio (RER) vs. time (n = 12 biologically independent mice per diet). F) Fuel utilization was calculated for the 24-hour period following the indicated (arrow) refeeding time (n = 12 biologically independent mice per diet). * symbol represents a significant difference versus AL (TR.al, p ≤ 0.0027; CR, p ≤ 0.0306) based on Tukey’s test post one-way ANOVA performed separately for FAO and C/PO). G) Radar chart visualization of 17 phenotypes measured in male C57BL/6J while consuming the indicated diets. (A-G) H) Comparison of diet effect on the phenotypes of C57BL/6J male mice for all feeding regimens examined in this manuscript. All data are represented as mean ± SEM.
Figure 4:
Figure 4:. Fasting and calorie restriction result in highly similar transcriptomic signatures in liver and white adipose tissue.
Transcriptional profiling was performed on liver and iWAT from mice fed the AL, CR, or TR.al regimens (n = 6 per diet group). (A) Heatmap of differently expressed genes of CR and TR.al-fed mice compared to AL-fed mice in liver and iWAT. (B-C) Overlap between genes differentially expressed in CR-fed mice and TR.al-fed mice relative to AL-fed mice. Numbers in Venn diagrams represent the number of genes (large circle) and functionally enriched pathways (small circle) identified found from network construction in D-E. (D-E) Network construction of significantly upregulated and downregulated genes of CR and TR.al group in iWAT (D) and liver (E) using NetworkAnalyst. Node size represents number of edges connected to a node and the colors represented by directionality of enrichment. Downregulated: green – CR specific, light blue – CR and TR.al p<0.05, dark blue – CR and TR.al with only TR.al p<0.05, purple – TR.al specific p<0.05, gray – edges and unknown nodes. Upregulated: yellow – CR specific, orange – CR and TR.al p <0.05, dark orange – CR and TR.al with only TR.al p<0.05, red – TR.al specific p<0.05, gray – edges and unknown nodes. (F-G) Significantly upregulated and downregulated pathways identified from network construction in iWAT (F) and liver (G). Bar graphs represents pathways identified enriched in CR and/or TR.al-fed mice with enrichment p<0.05 as computed with the hypergeometric test.
Figure 5.
Figure 5.. Prolonged fasting is required for the CR-mediated increase in insulin sensitivity and fuel selection in aged mice.
(A) Outline of feeding paradigms: AL, Diluted AL and CR. Diets were fed to C57BL/6J male mice starting at 4 months of age. (B) Change in body composition (body weight, fat mass, lean mass and adiposity) were tracked longitudinally (n varies by days; AL, n= 12–33; Diluted AL, n = 13–33 mice; CR, n = 13–33 biologically independent mice; statistics in Supplementary Table 10). (C) Glucose tolerance test performed at 10 months of age (AL, n = 16; Diluted AL, n = 15; CR, n = 16 biologically independent mice). * symbol represents a significant difference versus AL-fed mice (Diluted AL, p <0.0001); # symbol represents a significant difference versus Diluted AL-fed mice (CR, p = 0.0040) based on Tukey’s test post one-way ANOVA. (D) Insulin tolerance test performed at 10 months of age (AL, n = 16; Diluted AL, n = 12; CR, n = 16 biologically independent mice). * symbol represents a significant difference versus AL-fed mice (CR, p < 0.0001); # symbol represents a significant difference versus Diluted AL-fed mice (CR, p<0.0001) based on Tukey’s test post one-way ANOVA. (E) Glucose tolerance test performed at 19 months of age (AL, n = 10; Diluted AL, n = 8; CR, n = 10 biologically independent mice). * symbol represents a significant difference versus AL-fed mice (Diluted AL, p <0.0001; CR, p = 0.0237); # symbol represents a significant difference versus Diluted AL-fed mice (CR, p = 0.0270) based on Tukey’s test post one-way ANOVA. F) Insulin tolerance test performed at 19 months of age (AL, n = 9; Diluted AL, n = 8; CR, n = 8 biologically independent mice). * symbol represents a significant difference versus AL-fed mice (CR, p < 0.0001); # symbol represents a significant difference versus Diluted AL-fed mice (CR, p < 0.0001) based on Tukey’s test post one-way ANOVA. (G) Respiratory exchange ratio vs. time at ~15 months in age (AL, n = 29; Diluted AL, n = 13; CR, n = 29 biologically independent mice). (H) Fuel utilization was calculated for the 24-hour period following the indicated (arrow) refeeding time (AL, n = 29; Diluted AL, n = 13; CR, n = 29 biologically independent mice). * symbol represents a significant difference versus AL (Diluted AL, p = 0.0179; CR, p = 0.0352); # symbol represents a significant difference versus Diluted AL (CR, p ≤ 0.0001) based on Tukey’s test post one-way ANOVA performed separately for FAO and C/PO). All data are represented as mean ± SEM.
Figure 6.
Figure 6.. Fasting is required for the geroprotective effects of a CR diet.
(A-G) Frailty of mice was determined from 15–23 months of age and mice that did not survive up to 23 months of age were excluded. Total Frailty (A); specific deficits (B-G) of interests scored as part of the clinical frailty index. (A-G) AL; n = 29, Diluted AL, n = 11, CR, n = 30 biologically independent mice; * symbol represents a significant difference versus AL (CR, p < 0.0001); # symbol represents a significant difference versus Diluted AL (CR, p < 0.0001), based on Tukey’s test post two-way ANOVA. (H-I) A novel object recognition test was performed at 21 months of age to assess (H) short-term (STM) and (I) long-term (LTM) memory. AL; n = 30, Diluted AL, n = 11, CR, n = 30 biologically independent mice; * symbol represents a significant difference versus AL (CR, p < 0.0001); # symbol represents a significant difference versus Diluted AL (CR, p < 0.0001), based on Tukey’s test post two-way ANOVA.(J) Kaplan-Meier plot of the lifespan of mice on the indicated diets starting at 4 months of age; Log-rank test (Mantel-Cox), p < 0.0001, AL vs. Diluted AL and AL vs. CR; log-rank test for trend , p = 0.0001, AL vs. Diluted AL and AL vs. CR. (K) Tumors observed at the time of necropsy; each dot representing a single mouse. (L) Comparison of phenotypes induced by Diluted AL and CR diets, as compared to AL. All data are represented as mean ± SEM.
Figure 7.
Figure 7.
Fasting plays a critical role in the response to a CR diet.

Comment in

References

    1. Green CL, Lamming DW & Fontana L Molecular mechanisms of dietary restriction promoting health and longevity. Nat Rev Mol Cell Biol, doi:10.1038/s41580-021-00411-4 (2021). - DOI - PMC - PubMed
    1. Colman RJ et al. Caloric restriction reduces age-related and all-cause mortality in rhesus monkeys. Nature communications 5, 3557, doi:10.1038/ncomms4557 (2014). - DOI - PMC - PubMed
    1. Kraus WE et al. 2 years of calorie restriction and cardiometabolic risk (CALERIE): exploratory outcomes of a multicentre, phase 2, randomised controlled trial. Lancet Diabetes Endocrinol 7, 673–683, doi:10.1016/S2213-8587(19)30151-2 (2019). - DOI - PMC - PubMed
    1. Belsky DW, Huffman KM, Pieper CF, Shalev I & Kraus WE Change in the Rate of Biological Aging in Response to Caloric Restriction: CALERIE Biobank Analysis. J Gerontol A Biol Sci Med Sci 73, 4–10, doi:10.1093/gerona/glx096 (2017). - DOI - PMC - PubMed
    1. Das SK et al. Body-composition changes in the Comprehensive Assessment of Long-term Effects of Reducing Intake of Energy (CALERIE)-2 study: a 2-y randomized controlled trial of calorie restriction in nonobese humans. Am J Clin Nutr 105, 913–927, doi:10.3945/ajcn.116.137232 (2017). - DOI - PMC - PubMed

Publication types