. 2021 Nov;22(11):1375-1381.
doi: 10.1038/s41590-021-01040-x. Epub 2021 Oct 18.

Circadian clocks guide dendritic cells into skin lymphatics

Affiliations

Circadian clocks guide dendritic cells into skin lymphatics

Stephan J Holtkamp et al. Nat Immunol. 2021 Nov.

Abstract

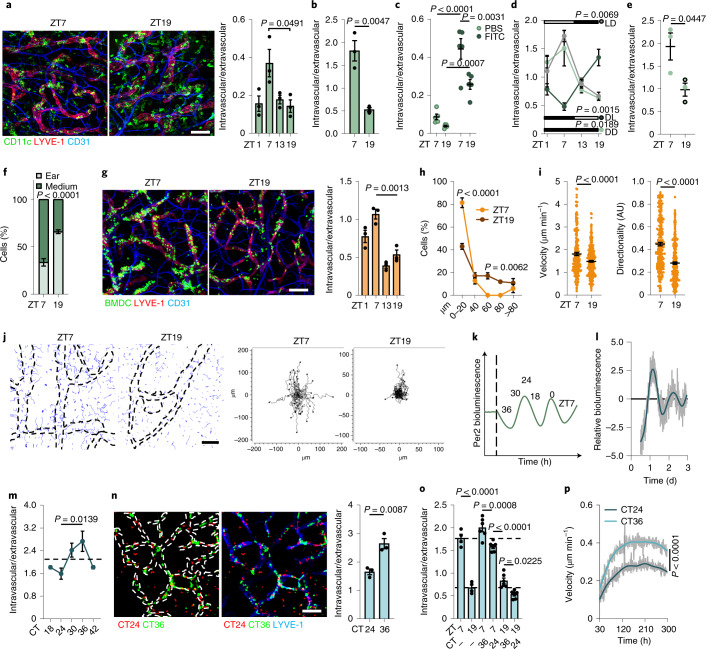
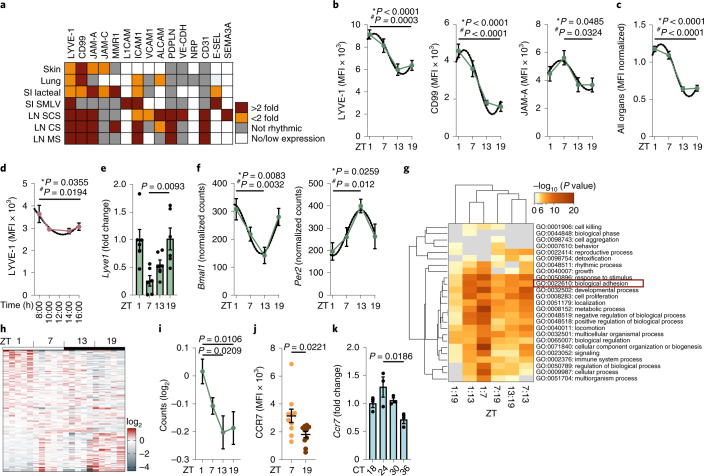
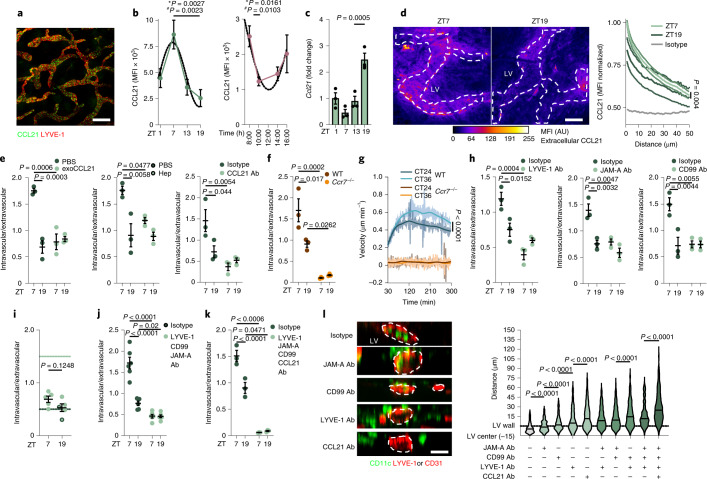
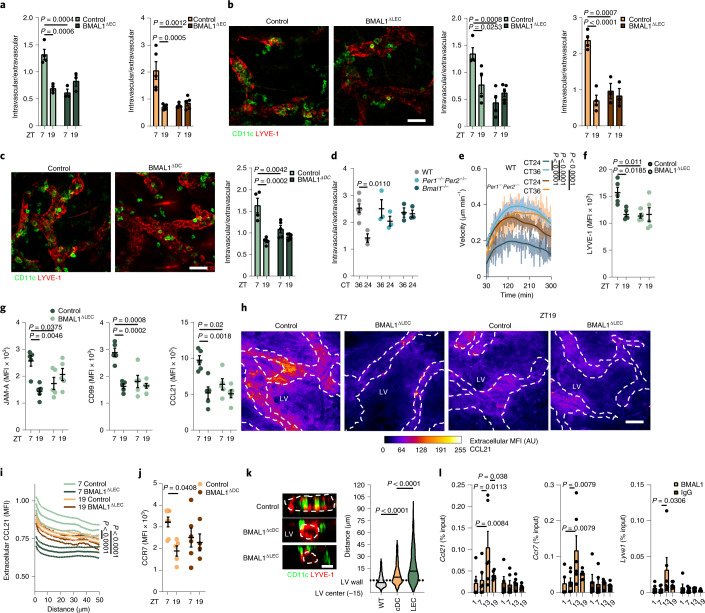
Migration of leukocytes from the skin to lymph nodes (LNs) via afferent lymphatic vessels (LVs) is pivotal for adaptive immune responses1,2. Circadian rhythms have emerged as important regulators of leukocyte trafficking to LNs via the blood3,4. Here, we demonstrate that dendritic cells (DCs) have a circadian migration pattern into LVs, which peaks during the rest phase in mice. This migration pattern is determined by rhythmic gradients in the expression of the chemokine CCL21 and of adhesion molecules in both mice and humans. Chronopharmacological targeting of the involved factors abrogates circadian migration of DCs. We identify cell-intrinsic circadian oscillations in skin lymphatic endothelial cells (LECs) and DCs that cogovern these rhythms, as their genetic disruption in either cell type ablates circadian trafficking. These observations indicate that circadian clocks control the infiltration of DCs into skin lymphatics, a process that is essential for many adaptive immune responses and relevant for vaccination and immunotherapies.


Conflict of interest statement

The authors declare no competing interests.

Figures

Fig. 1
Fig. 1. Migration of dermal DCs into skin lymphatics is circadian.
a,b, Crawl-in assays of ear CD11c+ cells in LVs after 6 h (a) or 24 h (b); n = 3 mice, one-way analysis of variance (ANOVA) with Tukey’s post test (a) and unpaired Student’s t-test (b). c, Ear CD11c+ DCs in LVs after 24-h FITC painting; n = 5 mice from two independent experiments; two-way ANOVA with Sidak post test. d, Ear CD11c+ cells in LVs in light:dark (LD), dark:light (DL) or constant darkness (DD) crawl-in assays; n = 3 mice; one-way ANOVA. e, CD11c+langerin DCs after ear crawl-in assays; n = 3 mice; unpaired Student’s t-test. f, Flow cytometry of ear and medium CD11c+MHCII+CD103EpCAM cDC2s after crawl-out assays; n = 3 mice; two-way ANOVA. g, Localization of ear bone-marrow-derived DCs (BMDCs) after 3-h crawl-in assays; n = 3 mice; one-way ANOVA with Tukey’s post test. h, Localization of ear BMDCs after 1-h crawl-in assays; n = 4 mice; unpaired Student’s t-test. i, Velocity and directionality of BMDCs in ear crawl-in assays; n = 217 and 301 cells, respectively, from four mice from four independent experiments; unpaired Student’s t-test; AU, arbitrary units. j, Migration tracks (blue, left) of BMDCs overlaid onto LVs (dotted lines, left) and coordinates (right); n = 34 cells from four mice from four independent experiments. k, BMDC synchronization with serum at different circadian times (CTs). l, Bioluminescence oscillations from lipopolysaccharide (LPS)-activated Per2:Luc BMDCs after synchronization with serum. m, Synchronized BMDCs after 3-h ear crawl-in assays (non-synchronized control is represented by dotted lines). CT18/CT42 is double plotted to facilitate viewing; n = 4 mice; one-way ANOVA with Tukey’s post test. n, Localization of CT24 and CT36 synchronized BMDCs after crawl-in assays; n = 4 mice; unpaired Student’s t-test. o, Localization of CT24 and CT36 synchronized BMDCs after crawl-in assays; n = 4 non-synchronized and n = 6 synchronized BMDCs; one-way ANOVA with Tukey’s post test. p, Velocity of synchronized BMDCs in collagen migration assays; n = 3 mice; Kruskal–Wallis test with Dunn’s post test. Scale bars, 100 µm. Data are representative of at least two independent experiments (a, b, dh, mp). All data are represented as mean ± s.e.m. Source data
Fig. 2
Fig. 2. Diurnal expression of promigratory factors in LECs and DCs.
a, Immunofluorescence screen of molecules expressed in LYVE-1+ ear LVs. No/low expression is <1.5% of max mean fluorescence intensity (MFI). Each square represents n = 5 mice with four ZTs measured. SI, small intestine;SMLV, sub-mucosal lymphatic vessel;SCS, subcapsular sinus;CS, cortical sinus;MS, medullary sinus. b, Expression profiles of molecules in LYVE-1+ ear LVs. c, Integration of all rhythmic expression profiles across organs collapsed into one graph; n = 5 mice from two independent experiments. d, Expression profile of LYVE-1 in LVs in human skin biopsies from n = 5–9 individuals; asterisks show results from one-way ANOVA, and number signs show results from cosinor analysis (bd). ei, RNA analyses of dermal LECs sorted at four different ZTs. e, Normalized dermal LEC Lyve1 expression; n = 3 mice representative of two independent experiments; one-way ANOVA with Tukey’s post test. f, Normalized clock gene counts determined from RNA sequencing of sorted dermal LECs; n = 5 mice; asterisks show results from one-way ANOVA, and number signs show results from cosinor analysis. g, Significant Gene Ontology (GO) cluster enrichment between different ZTs of dermal LECs. h, Heat map of significantly rhythmically expressed adhesion genes (GO:0022610) in dermal LECs. i, Integration of all genes from h collapsed into one graph; n = 82 genes; one-way ANOVA with Tukey’s post test. j, Flow cytometry of CCR7 on CD11c+MHCII+CD103EpCAM cDC2s; n = 10 mice from two independent experiments; unpaired Student’s t-test. k, Relative Ccr7 expression in synchronized BMDCs across four CTs and normalized to CT18; n = 3 mice representative of two independent experiments; one-way ANOVA with Tukey’s post test. Dotted lines represent fit cosinor curves. All data are represented as mean ± s.e.m. Source data
Fig. 3
Fig. 3. Chronopharmacology of circadian DC migration.
a, Imaging of CCL21 in permeabilized ears. Image is representative of two independent experiments. Scale bar, 70 µm. b, Quantitative immunofluorescence screen of CCL21 in LYVE-1+ LVs in mouse (left; n = 5 mice from two independent experiments) and human (right; n = 5–11 individuals) skin samples; asterisks show results from one-way ANOVA, and number signs show results from cosinor analysis. c, Normalized Ccl21 expression in sorted dermal LECs measured by qPCR. Data are representative of two independent experiments; n = 3 mice; one-way ANOVA with Tukey’s post test. d, Quantitative imaging of non-permeabilized ears for CCL21; n = 5 mice from two independent experiments; Mann–Whitney U-test. Scale bar, 50 µm. e, Ear CD11c+ cells after crawl-in assays and addition of exogenous (exo) CCL21 (left), heparinase (hep) treatment (middle) or anti-CCL21 antibody blockade (right); n = 3 mice representative of two independent experiments. f, Ear BMDCs after crawl-in assays using Ccr7–/– or control cells; n = 3 mice representative of two independent experiments; two-way ANOVA with Sidak post test for e and f. g, Velocity of synchronized WT and Ccr7–/– BMDCs in collagen migration assays; n = 3 mice representative of two independent experiments; Kruskal–Wallis test with Dunn’s post test. h, Ear CD11c+ cells after crawl-in assays and antibody treatment; n = 3 mice representative of two independent experiments; two-way ANOVA with Sidak post test. i, Ear CD11c+ cells after crawl-in assays using Cd99–/– animals (control, dotted lines); n = 5 mice from two independent experiments; unpaired Student’s t-test. j,k, Ear CD11c+ cells after crawl-in assays and antibody treatments; n = 6 mice (from two independent experiments for j) and n = 3 mice (representative from two independent experiments for k); two-way ANOVA with Sidak post test. l, Quantitative imaging of CD11c+ cell distance to LVs after ear crawl-in assays; Student’s t-test; n = 314, 451, 450, 453, 374, 408, 394, 396, 374 and 419 cells (left to right) from three mice. Scale bar, 10 µm. Outline represents orthogonal LV view. Dotted lines represent fit cosinor curves. All data are represented as mean ± s.e.m. Source data
Fig. 4
Fig. 4. Lineage-specific BMAL1 deficiency abrogates rhythms in DC lymphatic trafficking.
ac, Ear CD11c+ cells (green) or BMDCs (orange) after crawl-in assays with lineage-specific Bmal1–/– animals; n = 4, 4, 3 and 3 mice (left) and 5, 5, 4 and 5 mice (right) (a); n = 4, 4, 4 and 5 mice (left) and 4, 4, 3 and 3 (right) (b); n = 4, 4, 5 and 5 mice (c); data are representative of two independent experiments; two-way ANOVA with Sidak post test. b,c, Representative ear whole-mount images from control and BMAL1ΔLEC (b) or BMAL1ΔcDC (c) animals. Scale bar, 50 µm. d, Ear BMDCs after crawl-in assays with synchronized control, Per1–/–Per2–/– or Bmal1–/– BMDCs; n = 6 mice for WT cells and n = 3 for knockout (KO) cells, representative of two independent experiments; two-way ANOVA with Sidak post test. e, Velocity of synchronized WT and Per1–/–Per2–/– BMDCs in collagen gel migration assays; n = 3 mice. Data are representative of two independent experiments; Kruskal–Wallis test with Dunn’s post test. f,g, Quantitative immunofluorescence screen of LYVE-1 (f), JAM-A, CD99 and CCL21 (g) in LYVE-1+ ear LVs; n = 5 mice from two independent experiments; two-way ANOVA with Sidak post test. h,i, Ear whole-mount imaging (h) and quantification (i) of CCL21 of WT and BMAL1ΔLEC ears; n = 5 mice from two independent experiments; Kruskal–Wallis test with Dunn’s post test. Dashed lines represent LYVE-1+ capillaries. Scale bar, 50 µm. j, Flow cytometric analysis of CCR7 on CD11c+MHCII+CD103EpCAM DCs in control and BMAL1ΔcDC animals; n = 7, 5, 6 and 4 mice from two independent experiments; two-way ANOVA with Sidak post test. k, Representative images and quantification of the distance of CD11c+ cells to LVs after ear crawl-in assays; n = 340, 431 and 575 cells from four mice from two independent experiments; unpaired Student’s t-test. Scale bar, 10 µm. Outline represents orthogonal LV view. l, Chromatin immunoprecipitation (ChIP) of BMAL1 binding to promoter regions of Ccl21, Ccr7 and Lyve1 compared to IgG controls; n = 6 mice from two independent experiments; two-way ANOVA with Sidak post test. All data are represented as mean ± s.e.m. Source data
Extended Data Fig. 1
Extended Data Fig. 1. Endogenous CD11c+ cell analysis.
ad, Endogenous crawl-in assay with increasing incubation times, intraluminal CD11c+ cells can be identified in LYVE-1+ lymphatic vessels (LVs) by fluorescence line plot analysis. Scale bar, 50 µm and 10 µm for orthogonal views, a, representative of 2 independent experiments. b, Representative numbers of CD11c+ cells within or outside of LVs after a 24 h endogenous crawl-in assay, normalized to LV volume and used to calculate the intravascular versus extravascular ratio, n = 3 mice, data are representative of 5 independent experiments, two-way ANOVA with Šidák correction. c, Ratio of intravascular versus extravascular CD11c+ cells, directly after harvest, n = 6, 9,6, 9 mice, data are representative of 3 independent experiments; one-way ANOVA with Tukey’s post-test. d, Total number of CD11c+ cells counted per field of view after a 24 h endogenous crawl-in assay, n = 3 mice, data are representative of 5 independent experiments. e, Analysed LV volume per field of view, n = 3 mice, data are representative of 5 independent experiments. f, 24 h endogenous assay staining for LANGERIN, CD11c and LYVE-1 to measure the intravascular versus extravascular ratio of Langerhans cells (LCs), unpaired student’s t-test, scale bar, 50 µm, n = 3 mice, data and images are representative of 2 independent experiments. g, Representative numbers of DCs and LCs within or outside of LVs after a 24 h endogenous crawl-in assay, n = 3 mice, data are representative of 2 independent experiments. h, Relative numbers of emigrated (medium) or resident (ear) MHCII+ CD11c+ EPCAM+ LCs after a 24 h crawl-out assay, measured by flow cytometry, n = 3 mice, data are representative of 3 independent experiments, two-way ANOVA with Šidák correction. i, Weight of ears used for crawl out assays, n = 9 mice from 3 independent experiments, two-way ANOVA. j, Gating strategy of EPCAM+/- CD11c+ MHCII+ dendritic cells (DCs) resident in ears or emigrated into medium. All data represented as mean ± s.e.m. Source data
Extended Data Fig. 2
Extended Data Fig. 2. Exogenous BMDC analysis.
a, b, BMDCs of a 3 h exogenous crawl visualized inside the PODOPLANIN+ LV lumen using orthogonal views. Scale bar, 70 µm and 10 µm for orthogonal views, a. b, Representative numbers of BMDCs within or outside of LYVE-1+ LVs normalized to vessel volume after a 3 h exogenous crawl in assay, n = 3 mice, data are representative of 5 independent experiments. c, Intravascular versus extravascular ratio of individual BMDC batches after a 3 h incubation time. d, Total count of BMDCs per field of view normalized to LV volume (left) and calculated LV volume (right), one-way ANOVA with Tukey’s multiple comparisons test, n = 3 mice from 4 independent experiments. e, BMDC crawl-in assays with increasing incubation times and analysed by distance dependent zone segmentation of the lymphatic interstitial area, scale bar, 50 µm. Relative accumulation of BMDCs after 0–60 min incubation shown for Zeitgeber Time (ZT) 7 and 19, n = 4 mice, data are representative of 2 independent experiments. f, Representative whole mount staining from 2 independent experiments of the skin for LAMININ used for live cell imaging, scale bar, 50 µm. g, Live cell imaging of BMDCs administered to split ears harvested at ZT7 or ZT19 for 50 min and quantification of accumulated and euclidean distance, unpaired student’s t-test, 220 BMDCs for ZT7, 300 BMDCs for ZT19 from 4 mice from 4 independent experiments, scale bar, 100 µm. h, Viability of control and circadian time (CT) 36 / CT24 BMDCs after serum shock synchronization measured by flow-cytometry, n = 3 donor mice, data are representative from 3 independent experiments. All data are represented as mean ± s.e.m. Source data
Extended Data Fig. 3
Extended Data Fig. 3. LEC protein analysis.
a, b, LYVE-1+ staining overviews of skin, small intestine (SI), inguinal lymph node (iLN) and lung tissues used for quantitative analysis. Scale bar, 150 µm, 100 µm for skin, representative images of 2 independent experiments, a. b, Respective sub-structures and higher magnifications for analysis. Schematic view of the iLN marks lymphatic sinusoids. CS = cortical sinus, MS = medullary sinus, SCS = subcortical sinus, SMLV = sub-mucosal LV, representative images of 2 independent experiments. Scale bar, 50 µm. cg, Quantitative immuno-fluorescence microscopy screen of proteins on LVs in mouse lung, c, iLN, d, e, SI, f, and skin, g, sections as well as sections from human skin biopsies, h. * = one-way ANOVA, # = cosinor analysis, n = 5 for murine (data are representative of 2 independent experiments) and 7,12,7,5 (CD99) and 5,8,4,7 (JAM-A) for human samples. Dotted line represents fit curves. All data are represented as mean ± s.e.m. Source data
Extended Data Fig. 4
Extended Data Fig. 4. LEC mRNA and DC protein analysis.
a, Gating strategy of sorted dermal CD31+ PODOPLANIN+ lymphatic endothelial cells (LECs) for qPCR and RNA-sequencing analyses. b, Relative mRNA expression of Cd99 in sorted dermal LECs after qPCR analysis, one-way ANOVA with Tukey’s post-test, n = 3 mice, data are representative of 2 independent experiments. c, Expression of LEC, blood endothelial cell (BEC), leukocyte (leu) and stromal cell (SRC)-specific genes in sorted dermal LECs presented as normalized counts and analysed by RNA sequencing, one-way ANOVA, n = 20. d, Clock gene expression of sorted dermal LECs across 4 time points measured and depicted as normalized counts. * = one-way ANOVA, # = cosinor analysis, n = 5 mice. e, f, Flow-cytometric analysis of CCR7 on emigrated DCs after a 24 h crawl-out assay. e, MFI of CCR7 on Langerhans cells (LCs), n = 9 mice from 2 independent experiments. f, Histograms of CCR7 MFI on emigrated cDCs (EPCAM-) and LCs (EPCAM+) in comparison to an isotype control, unpaired student’s t-test. All data are represented as mean ± s.e.m. Source data
Extended Data Fig. 5
Extended Data Fig. 5. Chemotaxis analyses.
a, Whole-mount staining of CCL21 in GOLPH4+ regions localized in LYVE-1+ capillaries with lower (left) and higher (right) magnification. Scale bar, 50 µm and 10 µm, respectively, representative images of 2 independent experiments. b, MFI of CCL21 in GOLPH4high (golgi; left) and GOLPH4low (vesicle; right) regions as stained and measured in whole-mounted split ears. Scale bar, 10 µm, unpaired student’s t-test, n = 3 mice, data and images are representative of 3 independent experiments. c, Generation of distance maps using LYVE-1+ capillaries for CCL21 gradient analysis. dg, Manipulation of CCL21 gradients, images are representative of 2 independent experiments. d, Whole mount staining of non-permeabilized ears for CCL21 after addition of exogenous CCL21. e, Visualization of CCL21 MFI in non-permeabilized ears after heparinase or PBS incubation. Dashed lines represent LYVE-1+ LV outlines. f, 24 h endogenous crawl-in assay after antibody-mediated blockade of CCL21 in comparison with isotype controls and staining for CD11c and LYVE-1 at ZT7. Scale bars, 50 µm. g, 3 h BMDC crawl-in assay after pharmacological blockade of CCL21, two-way ANOVA with Tukey’s post test, n = 4,5,5,5 mice from 3 independent experiments. All data are represented as mean ± s.e.m. Source data
Extended Data Fig. 6
Extended Data Fig. 6. Adhesion and transmigration analysis.
ac, 24 h endogenous crawl-in assays after antibody-mediated blockade of LYVE-1, a, JAM-A, b, or CD99, c, and respective isotype controls, stained for CD11c, CD31 or LYVE-1, representative of 2 independent experiments. Scale bars, 50 µm. d, 3 h BMDC crawl-in assays after antibody-mediated blockade of LYVE-1 (left), JAM-A (centre) and CD99 (right). n = 5 mice from 2 independent experiments. e, f, Neutralization of JAM-C (e) and Fc receptor (FcR, f) prior to a 24 h endogenous crawl-in assay with n = 3 mice. g, Combinations of anti-LYVE-1, anti-JAM-A and anti-CD99 for double blocks prior to a 24 h endogenous crawl-in assay, n = 3 mice, data are representative of 2 independent experiments, two-way ANOVA with Šidák post test. h, 24 h endogenous crawl-in assay with a combined antibody blockade of LYVE-1, CD99, JAM-A without CCL21 (left) or with CCL21 (right), stained for CD11c and CD31 representative of 2 independent experiments. Scale bar, 50 µm. i, Distance of CD11c+ cells to LV centre after 24 h crawl-in assays and antibody-mediated migration ablation or isotype controls at ZT7. Shown are individual blocks with respective controls, student’s t-test, n = 364–504 cells from 3 mice. All data are represented as mean ± s.e.m. Source data
Extended Data Fig. 7
Extended Data Fig. 7. Lineage-specific BMAL1-deficiency migration analysis.
a, b, Representative whole mount staining for PROX-1 and VE-CADHERIN in mouse EAR skin. Dotted lines represent a LYVE-1+ capillary. Scale bars, 50 µm and 10 µm for higher magnification. c, d, 6 h endogenous crawl-in assays in EC-specific (Bmal1ΔEC; c) and LEC-specific (Bmal1ΔLEC; d) Bmal1-/- animals and controls. Values presented as intravascular versus extravascular ratio of CD11c+ cells. Representative images show a 24 h endogenous crawl-in assay, stained for CD11c and LYVE-1, scale bar, 50 µm, two-way ANOVA with Šidák post test, n = (c, WT) 5,4,3,5; (c, KO) 4,3,4,4); (d, WT) 4,4,5,4; (d, KO) 7,7,5,5) mice from 2 independent experiments. All data are represented as mean ± s.e.m. Source data
Extended Data Fig. 8
Extended Data Fig. 8. Lineage-specific BMAL1-deficiency protein analysis and ChIP.
a, b, Quantitative immuno-fluorescence microscopy profiling of proteins on LV using 10 µm organ slices in LEC-specific (Bmal1ΔLEC; a) or EC-specific (Bmal1ΔEC ; b) Bmal1-/- and control animals, two-way ANOVA with Šidák post test, n= 5 mice from 2 independent experiments. c, Mean fluorescence intensity (MFI) of CCR7 on the surface of Langerhans cells after a 24 h crawl-out assay using cDC-specific (Bmal1ΔcDC) Bmal1-/- or control animals n = 4–6 mice from 2 independent experiments. d, Distance of CD11c+ DCs to LV centre after a 24 h crawl-in assay with tissue-specific Bmal1-/- animals. * = unpaired student’s t-test, n = (Bmal1ΔLEC) 371 and 305 cells from 4 mice; (Bmal1ΔcDC) 394 and 315 cells from 5 mice and 2 independent experiments. e, Schematic overview of promoter regions of target genes Lyve1, Ccl21a and Ccr7 in LN samples for chromatin immunoprecipitation (ChIP) analysis. The p-value marks the probability of the green-indicated BMAL1 binding sides, promoter regions are taken from the eukaryotic promoter database, EPFL, Switzerland. f, ChIP qPCR analysis of BMAL1 binding to promoter regions of Per2 as control at different time points throughout the day compared to IgG controls, n = 6 mice from 2 independent experiments. All data are represented as mean ± s.e.m. Source data

References

    1. Forster R, et al. CCR7 coordinates the primary immune response by establishing functional microenvironments in secondary lymphoid organs. Cell. 1999;99:23–33. doi: 10.1016/S0092-8674(00)80059-8. - DOI - PubMed
    1. Ulvmar MH, et al. The atypical chemokine receptor CCRL1 shapes functional CCL21 gradients in lymph nodes. Nat. Immunol. 2014;15:623–630. doi: 10.1038/ni.2889. - DOI - PubMed
    1. Palomino-Segura, M. & Hidalgo, A. Circadian immune circuits. J. Exp. Med.218, e20200798 (2021). - PMC - PubMed
    1. Scheiermann C, Gibbs J, Ince L, Loudon A. Clocking in to immunity. Nat. Rev. Immunol. 2018;18:423–437. doi: 10.1038/s41577-018-0008-4. - DOI - PubMed
    1. Ohl L, et al. CCR7 governs skin dendritic cell migration under inflammatory and steady-state conditions. Immunity. 2004;21:279–288. doi: 10.1016/j.immuni.2004.06.014. - DOI - PubMed

Publication types

MeSH terms

Substances