. 2021 Nov;27(11):1921-1927.
doi: 10.1038/s41591-021-01521-4. Epub 2021 Oct 18.

Distinction of lymphoid and myeloid clonal hematopoiesis

Affiliations

Distinction of lymphoid and myeloid clonal hematopoiesis

Abhishek Niroula et al. Nat Med. 2021 Nov.

Abstract

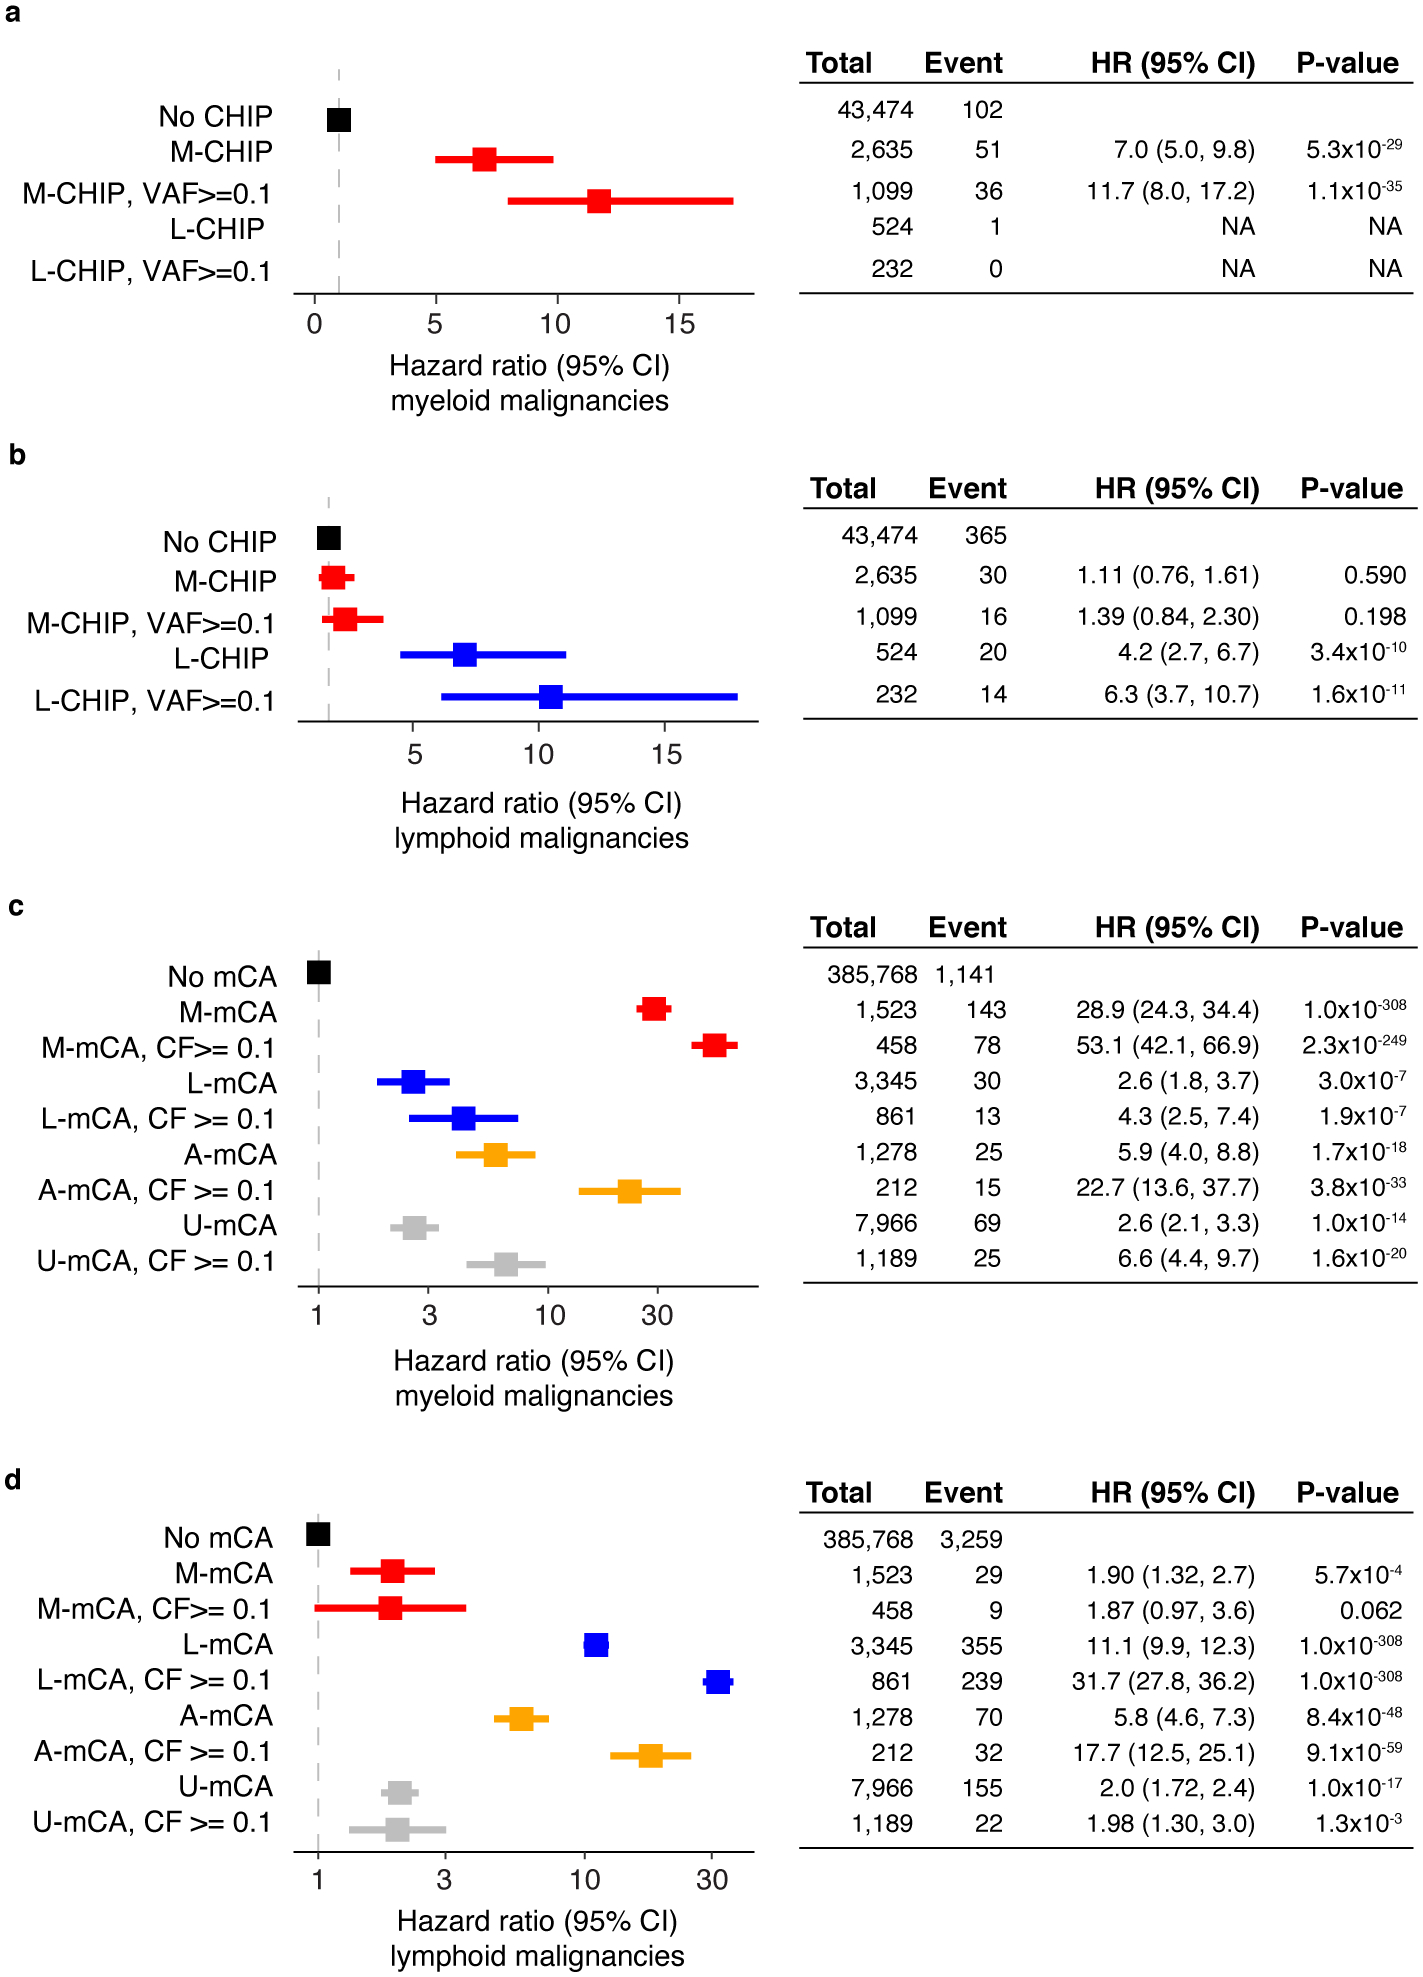
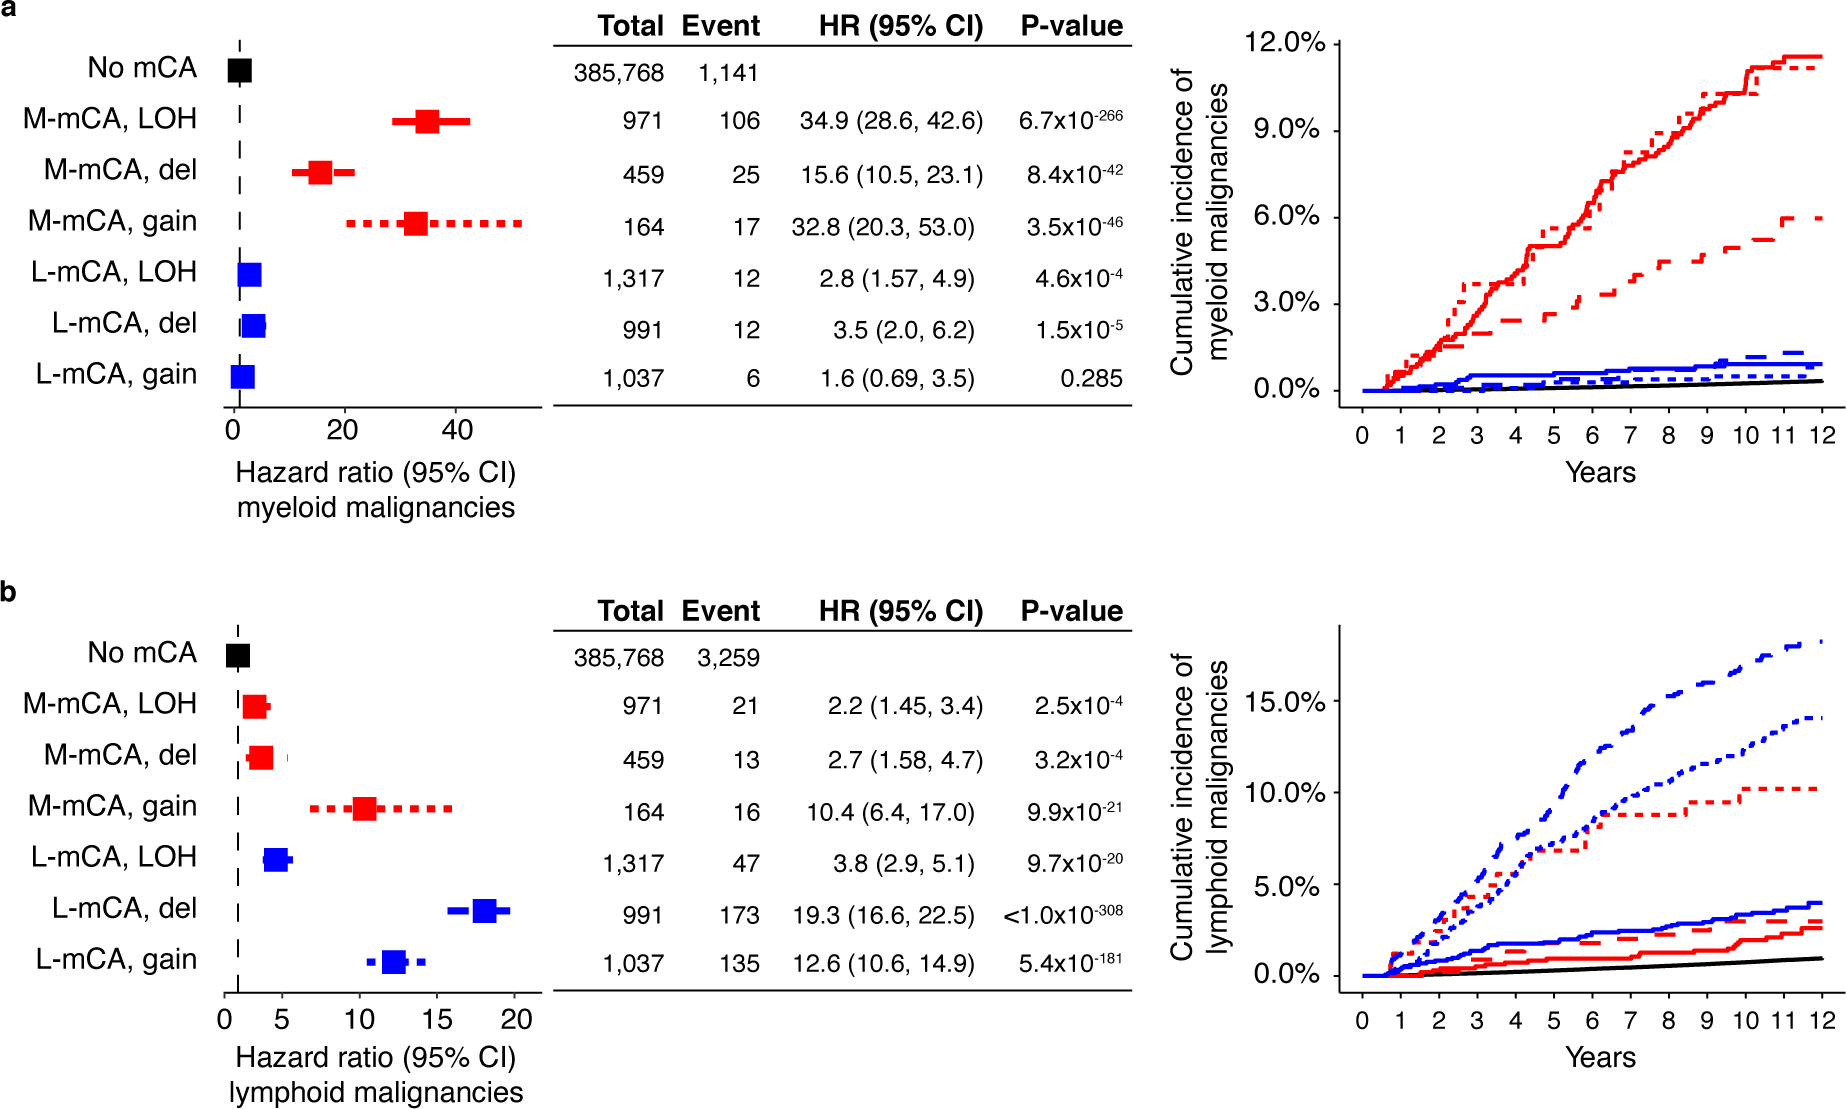
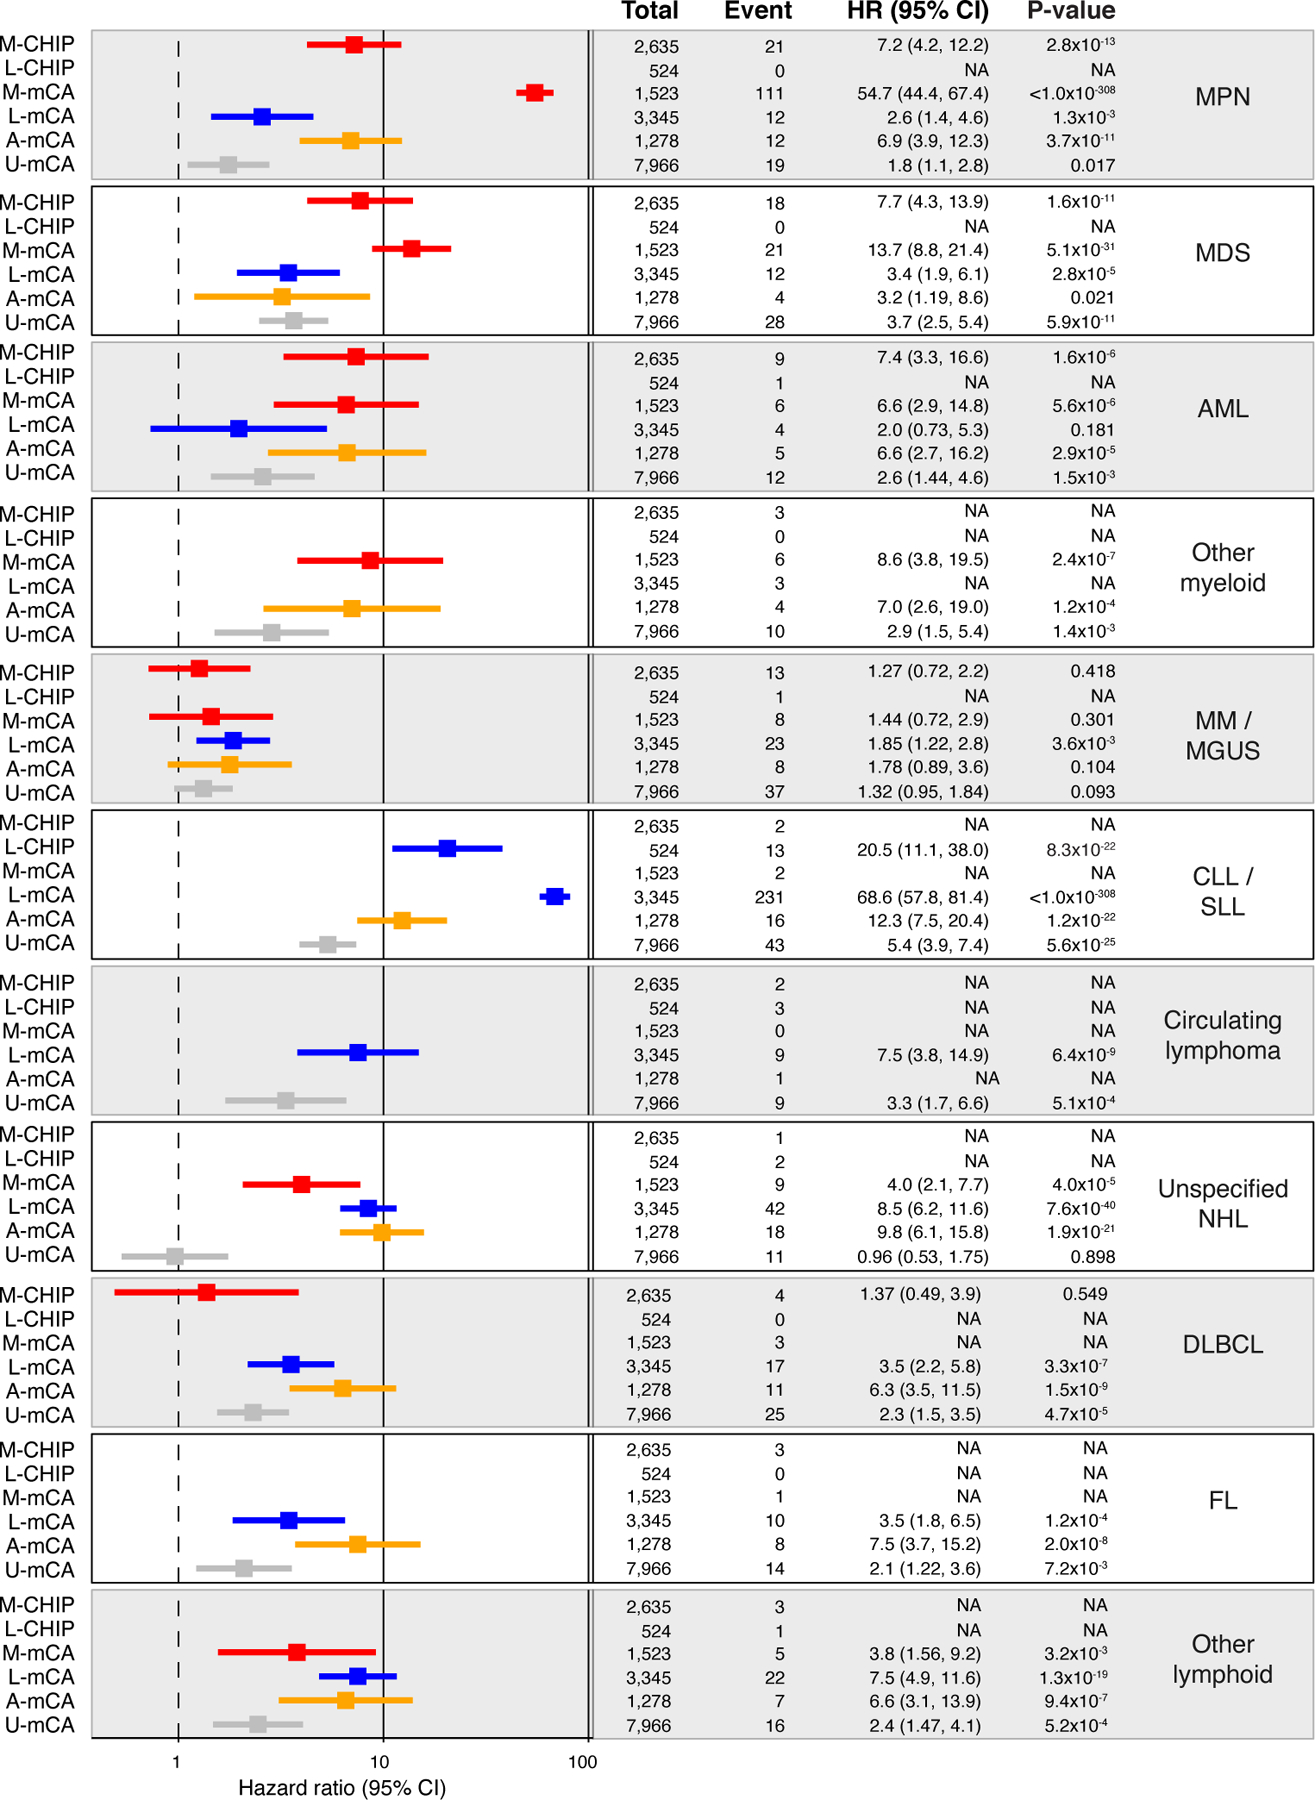
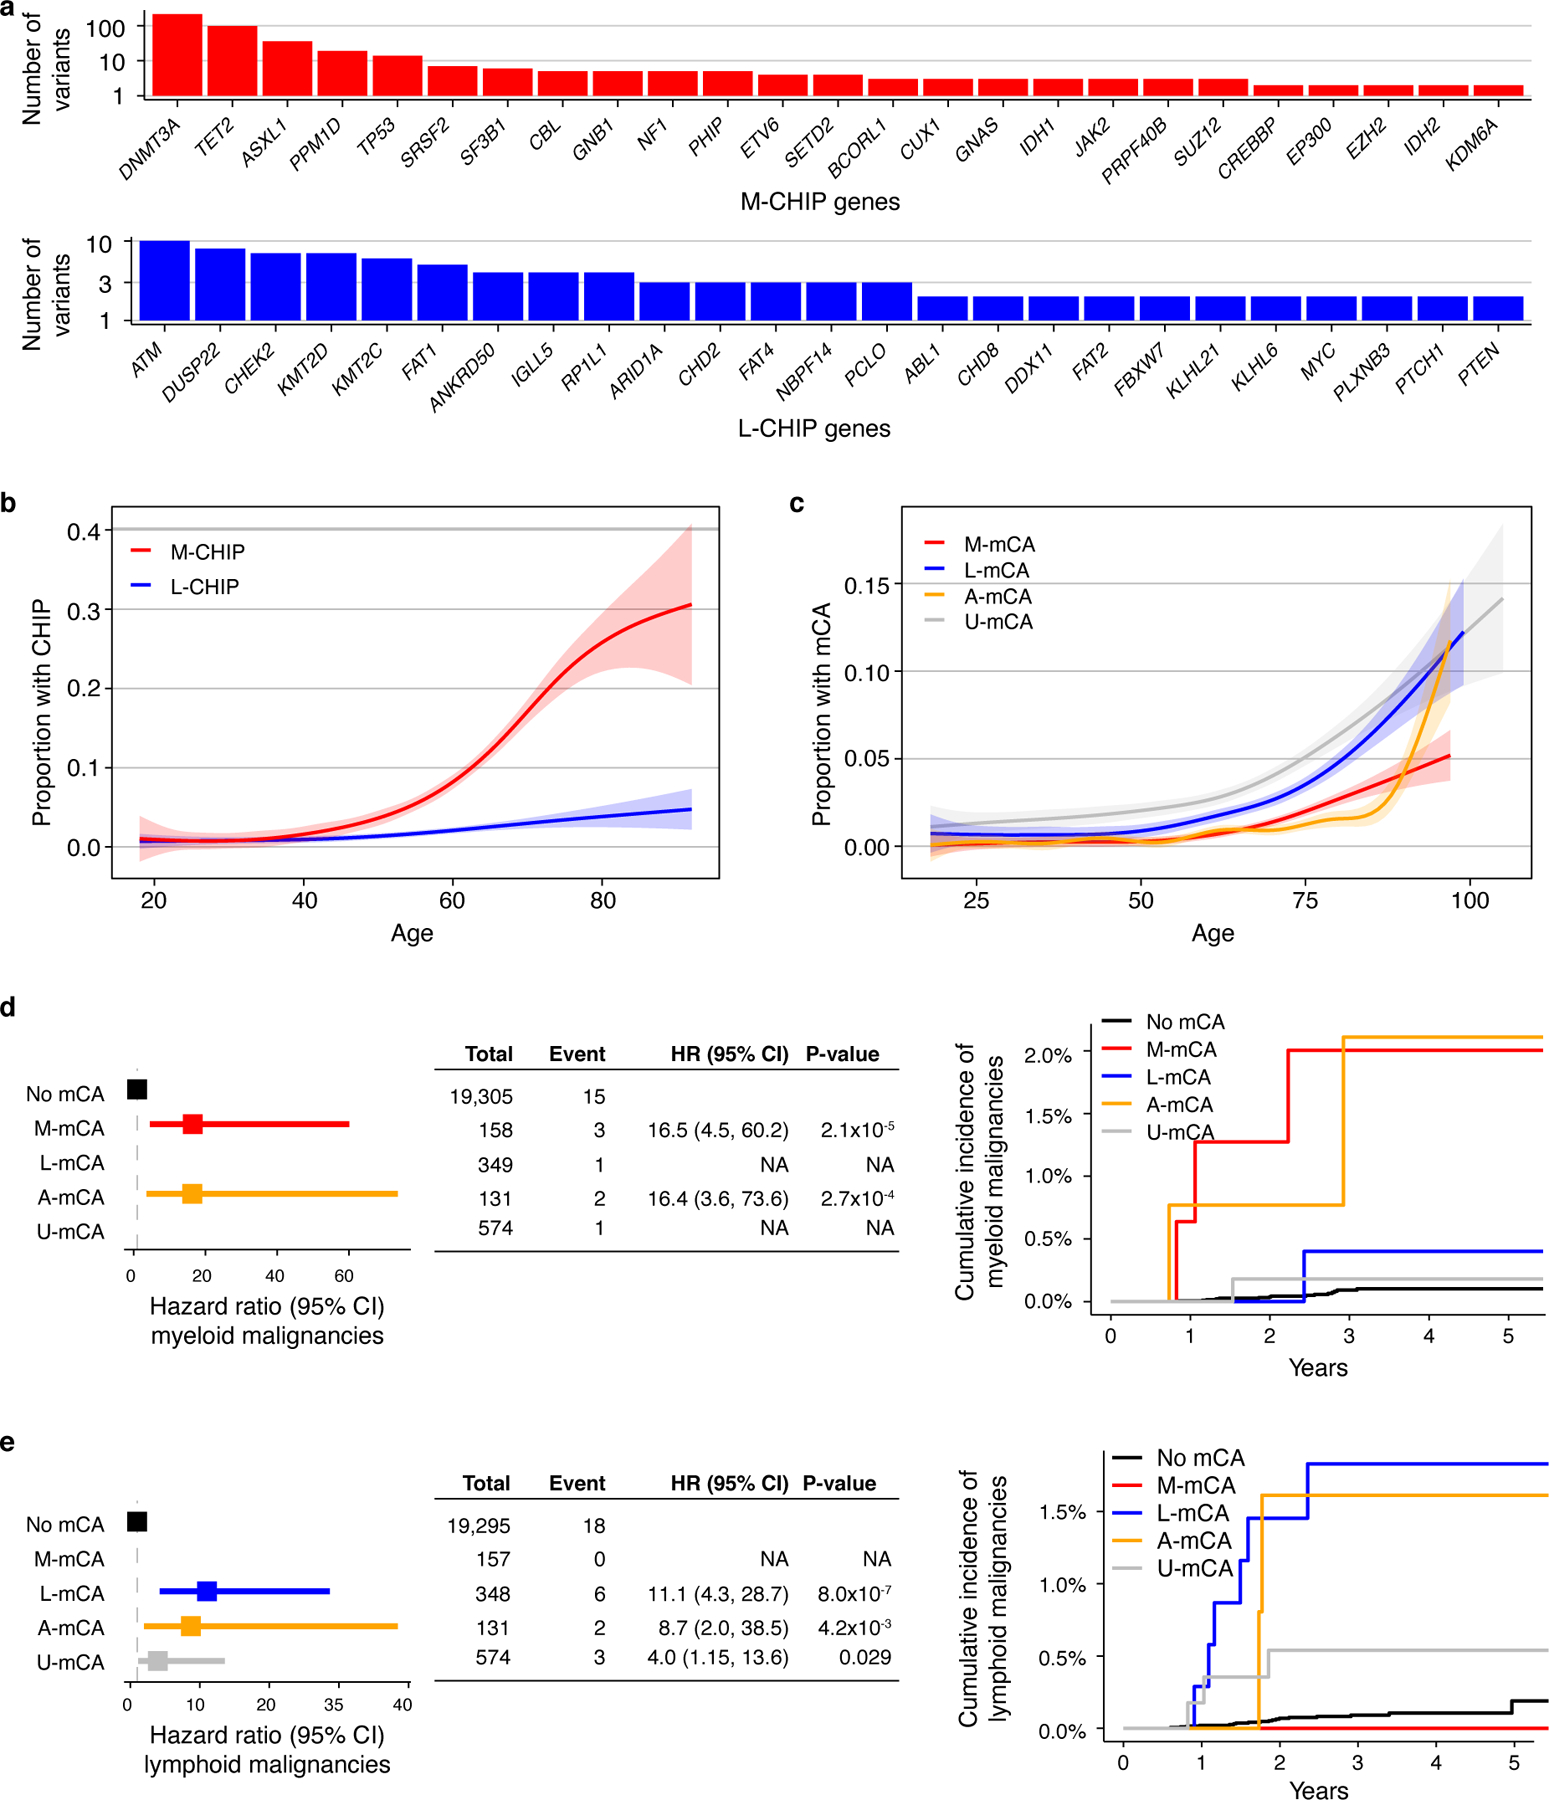
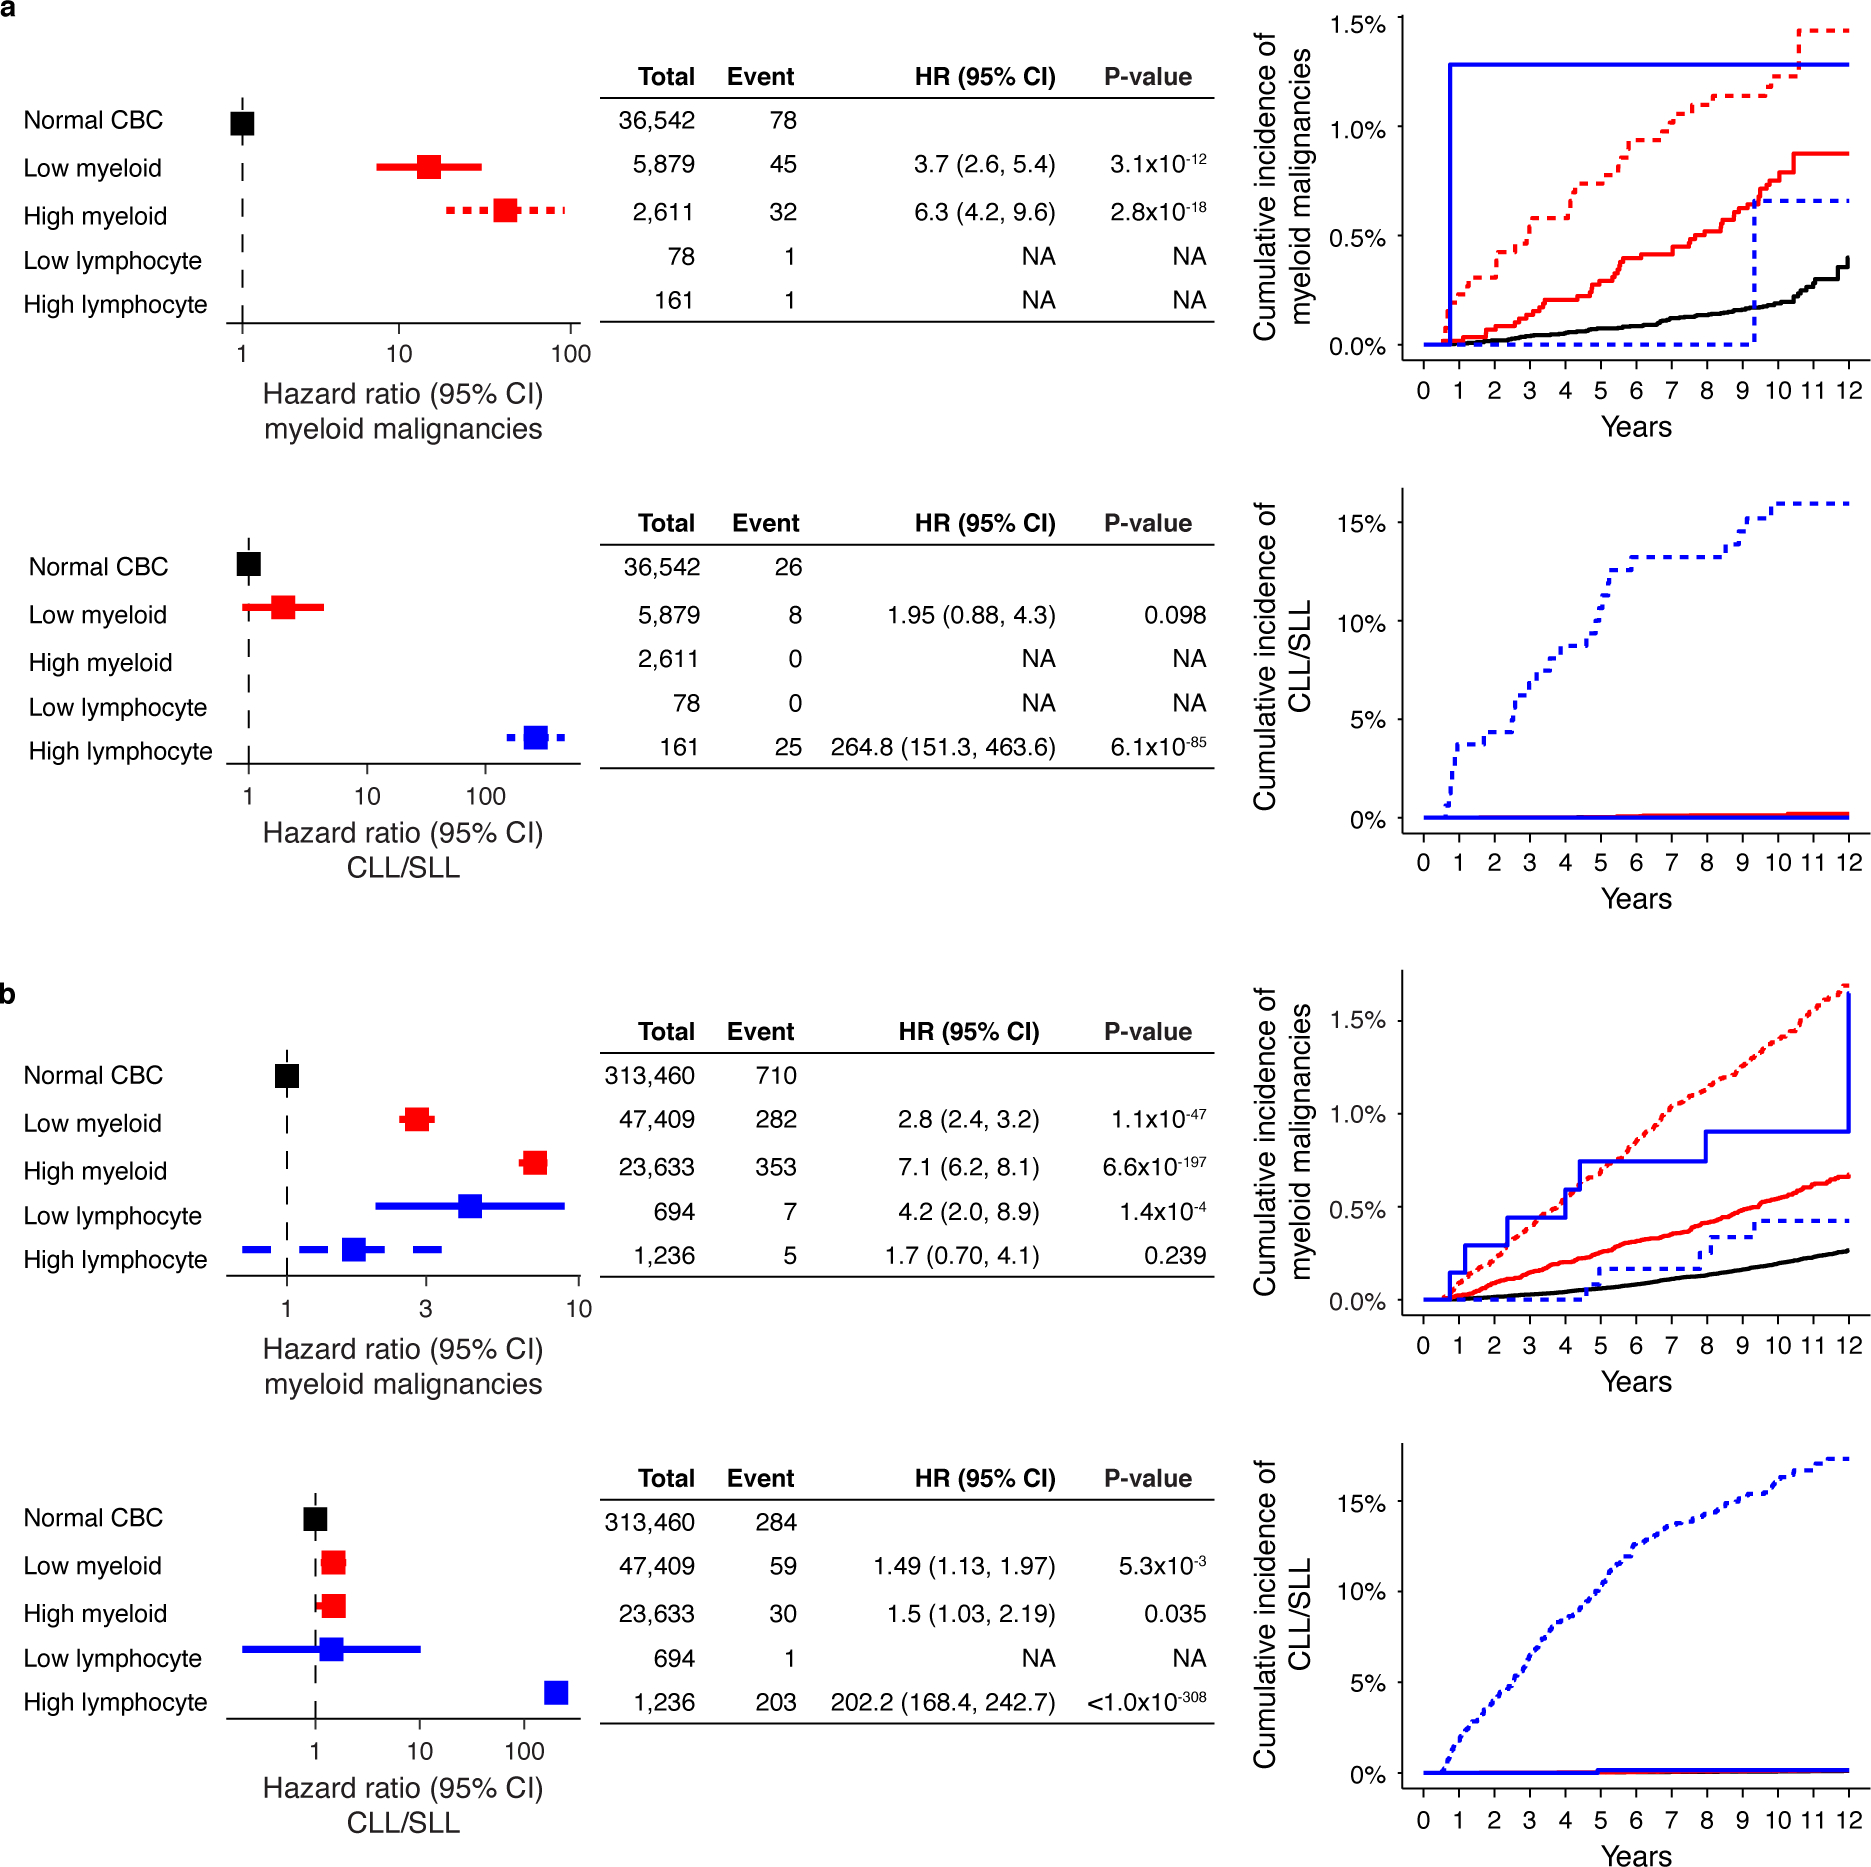
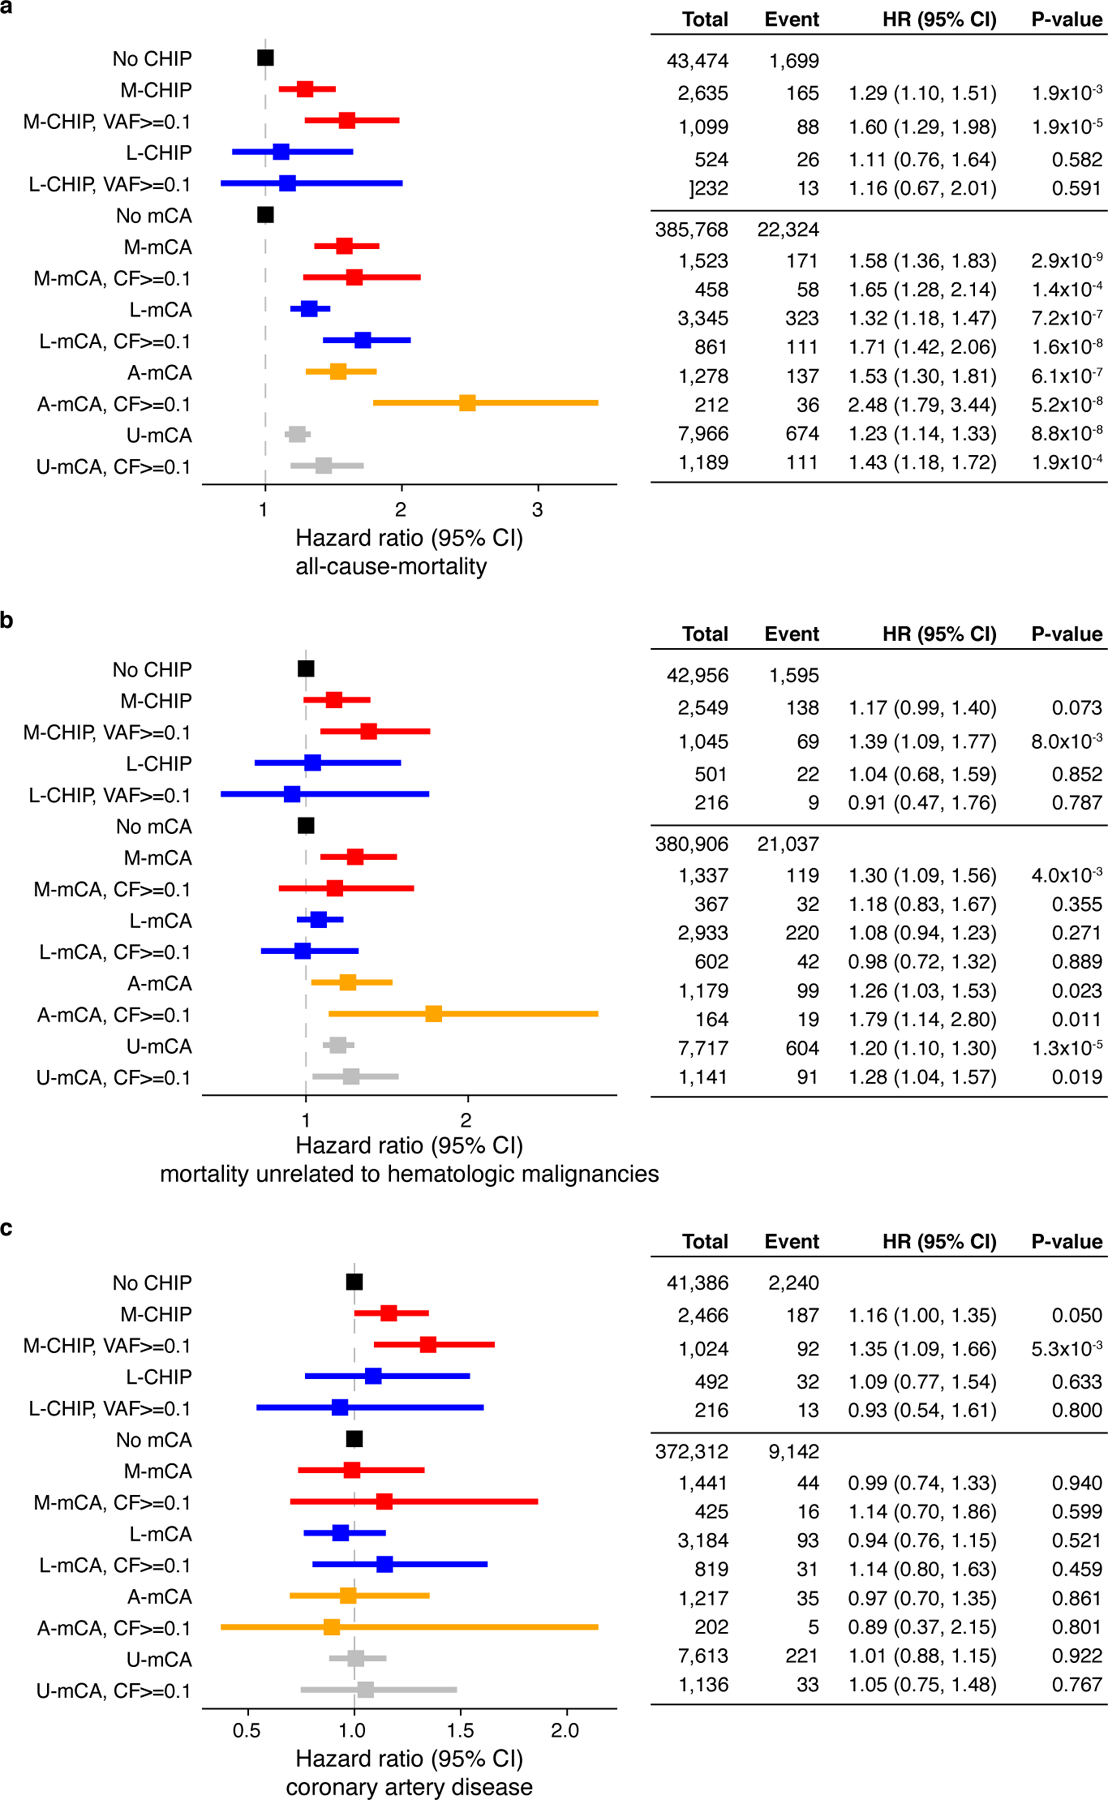
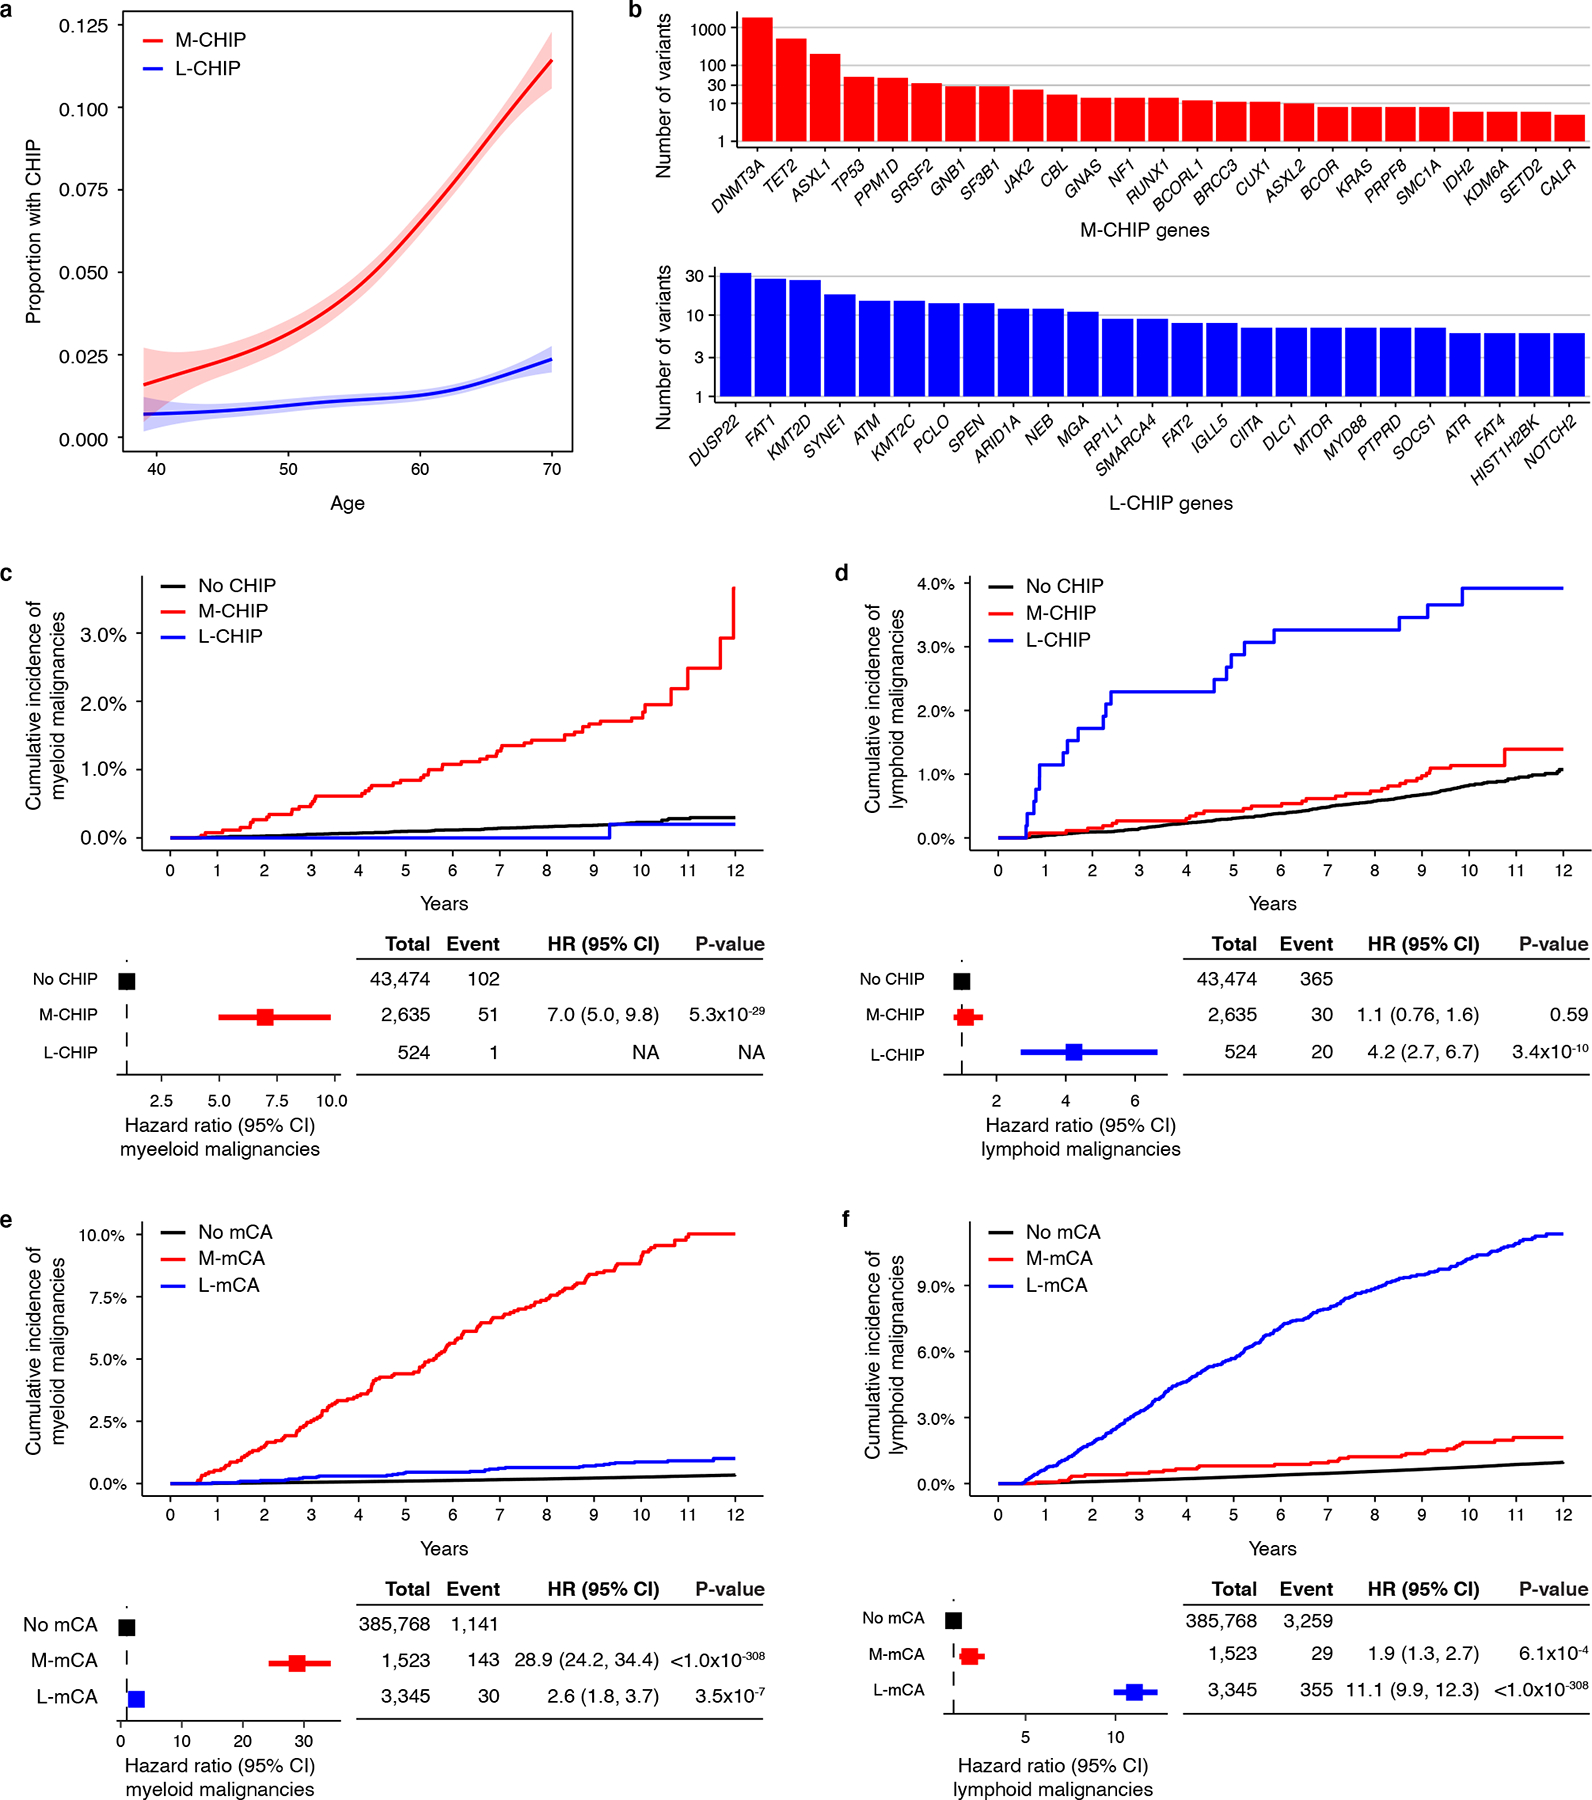
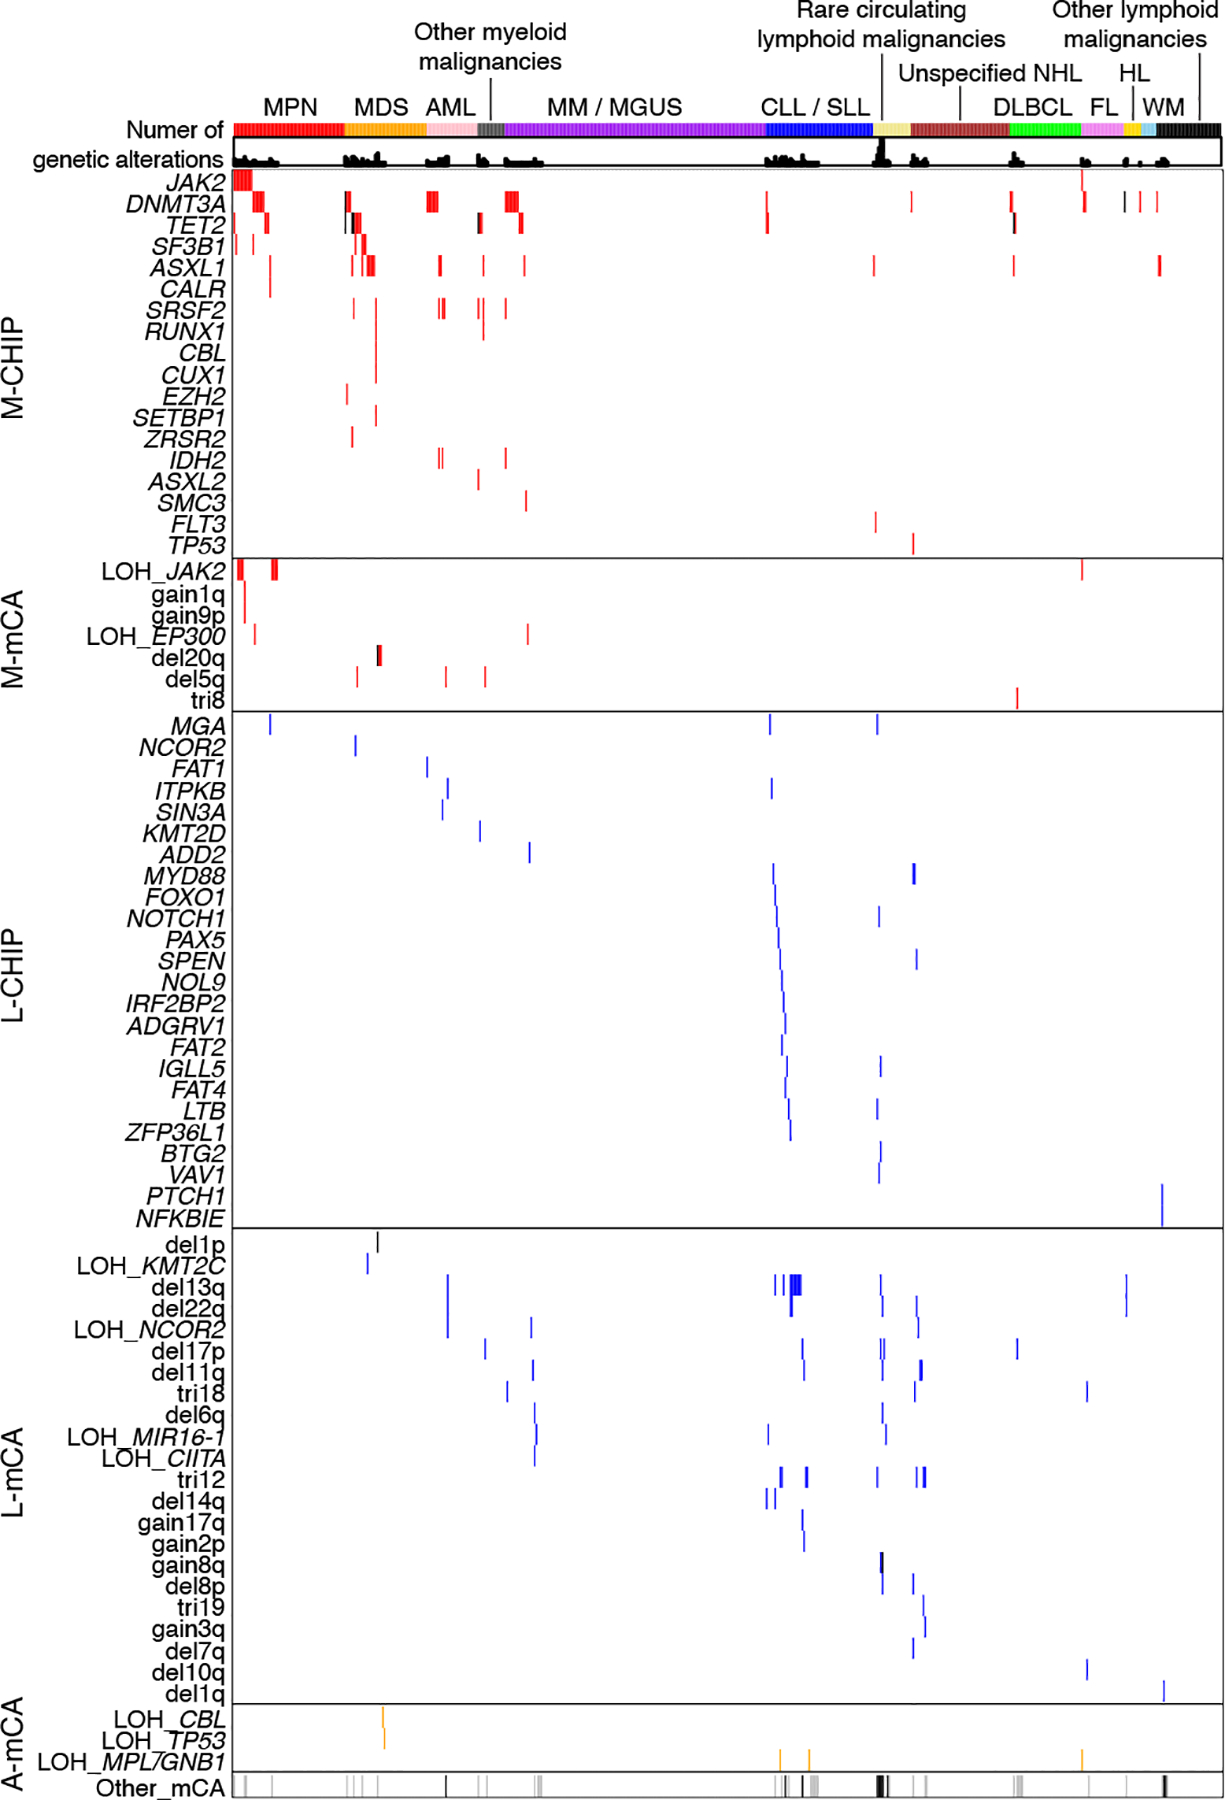
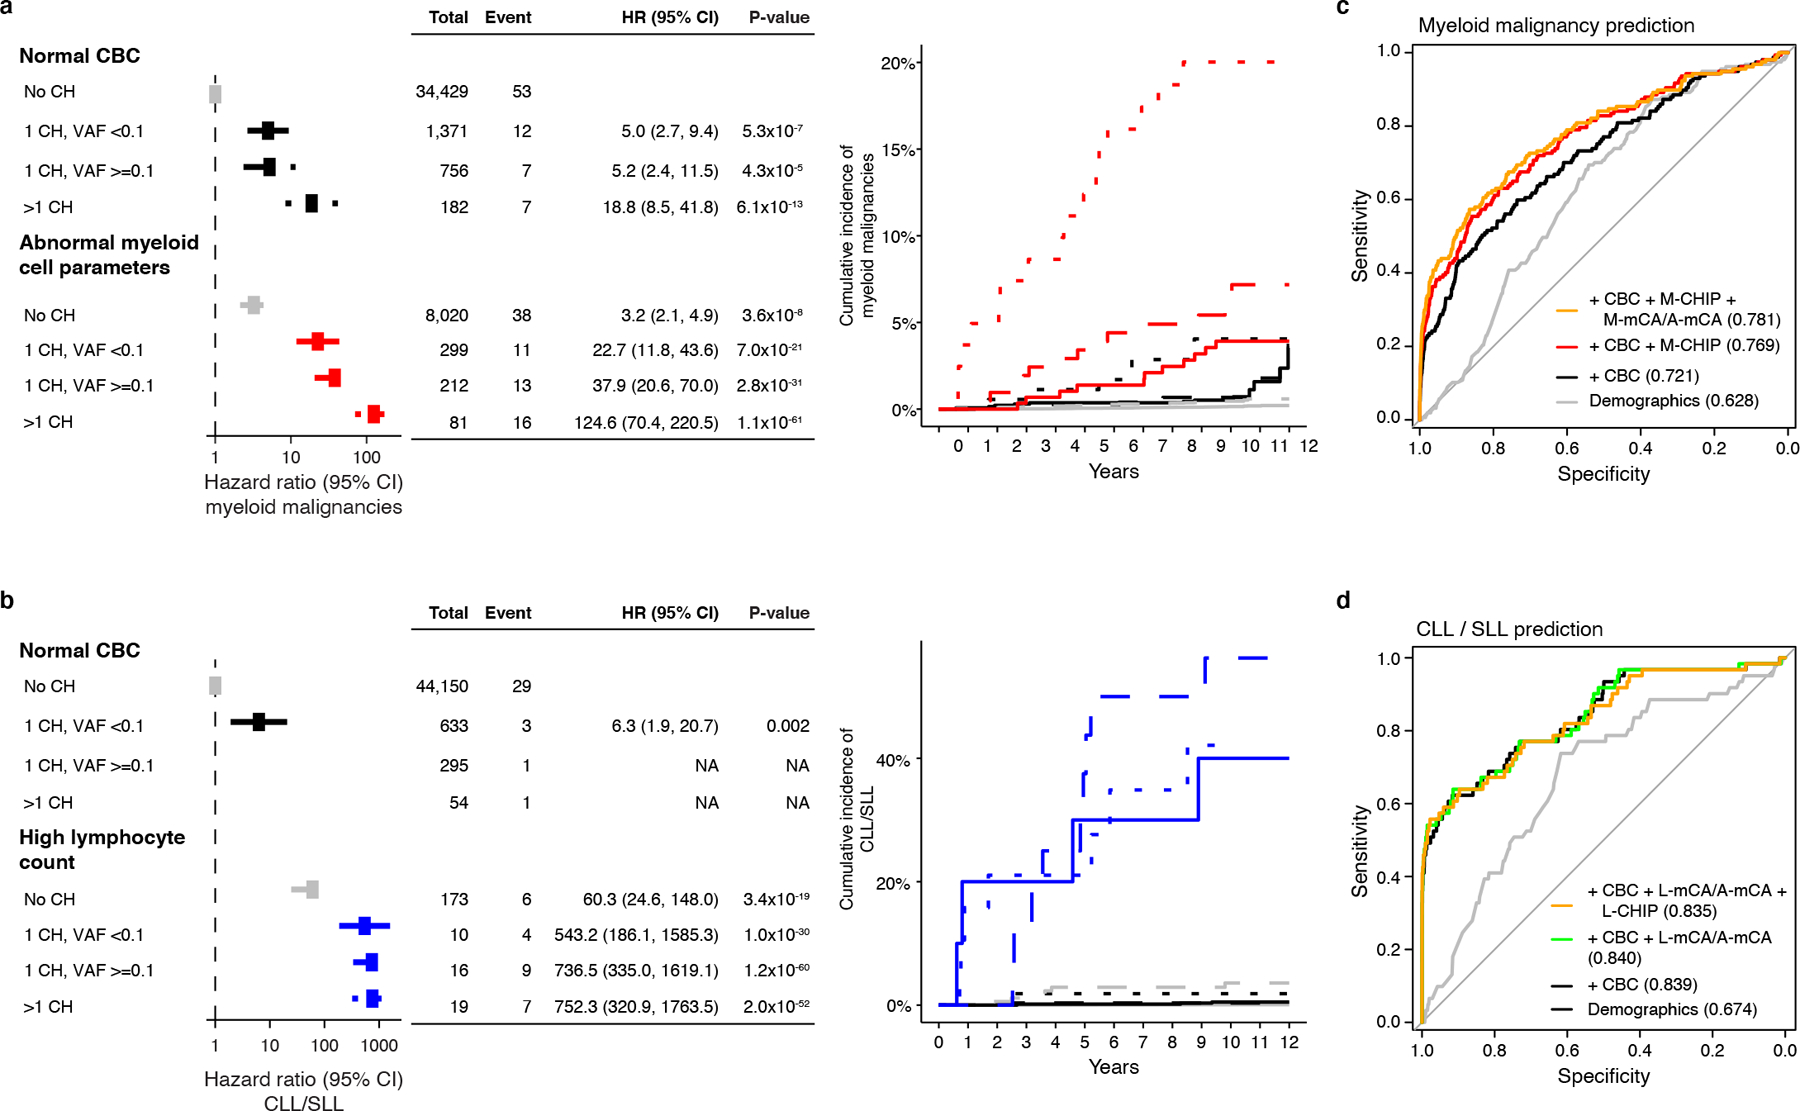
Clonal hematopoiesis (CH) results from somatic genomic alterations that drive clonal expansion of blood cells. Somatic gene mutations associated with hematologic malignancies detected in hematopoietic cells of healthy individuals, referred to as CH of indeterminate potential (CHIP), have been associated with myeloid malignancies, while mosaic chromosomal alterations (mCAs) have been associated with lymphoid malignancies. Here, we analyzed CHIP in 55,383 individuals and autosomal mCAs in 420,969 individuals with no history of hematologic malignancies in the UK Biobank and Mass General Brigham Biobank. We distinguished myeloid and lymphoid somatic gene mutations, as well as myeloid and lymphoid mCAs, and found both to be associated with risk of lineage-specific hematologic malignancies. Further, we performed an integrated analysis of somatic alterations with peripheral blood count parameters to stratify the risk of incident myeloid and lymphoid malignancies. These genetic alterations can be readily detected in clinical sequencing panels and used with blood count parameters to identify individuals at high risk of developing hematologic malignancies.


Conflict of interest statement

Competing Interests

BLE has received research funding from Celgene, Deerfield, and Novartis and consulting fees from GRAIL. He serves on the scientific advisory boards for Skyhawk Therapeutics, Exo Therapeutics, and Neomorph Therapeutics, none of which are directly related to the content of this paper. PN reports grant support from Amgen, Apple, AstraZeneca, Boston Scientific, and Novartis, personal fees from Apple, AstraZeneca, Blackstone Life Sciences, Genentech, and Novartis, and spousal employment at Vertex, all unrelated to the present work. GKG reports affiliation to Moderna Therapeutics which is unrelated to the present work. MA received consulting fees from German Accelerator Life Sciences and he is co-founder of iuvando Health and holds equity, all unrelated to the present work. All other authors declare no competing interests.

Figures

Extended Data Fig. 1
Extended Data Fig. 1. Expanded CH clones confer higher risk of malignancies.
a-b) M-CHIP and L-CHIP are associated with incident myeloid and lymphoid malignancies, respectively. Hazards associated with L-CHIP for developing myeloid malignancies could not be computed due to small number of events. c-d) The mCAs increase risk of myeloid and lymphoid malignancies, respectively. The M-mCA and L-mCA are associated with the highest risk of malignancies in the respective lineages. In all cases, expanded CH clones had higher risk of developing malignancies. (a-d) Data are presented as hazard ratio and 95% confidence intervals, computed by using Cox proportional hazards model adjusting for age, sex, smoking, genetic ethnic ancestry, and genetic principal components 1–5. HR, hazard ratio; CI, confidence interval; VAF, variant allele fraction; CF, cell fraction; U-mCA, unclassified mCA.
Extended Data Fig. 2
Extended Data Fig. 2. Association of between the types of mCA and hematologic malignancies.
All three categories of mCAs copy loss, copy gain, and copy neutral loss-of-heterozygosity are associated with the risk of a) myeloid malignancies, and b) lymphoid malignancies. (a-b) Data are presented as hazard ratio and 95% confidence intervals, computed by Cox proportional hazards model adjusting for age, sex, smoking, genetic ethnic ancestry, and genetic principal components 1–5. LOH, loss-of-heterozygosity; del, copy loss (deletion); gain, copy gain; HR, hazard ratio; CI, confidence interval.
Extended Data Fig. 3
Extended Data Fig. 3. Association between CH and sub-types of myeloid and lymphoid malignancies.
Data are presented as hazard ratio and 95% confidence intervals, computed by Cox proportional hazards model adjusting for age, sex, smoking, genetic ethnic ancestry, and genetic principal components 1–5. Groups with less than <4 events were excluded from the Cox model. MDS, myelodysplastic syndrome; AML, acute myeloid leukemia; MPN, myeloproliferative neoplasms; CLL, chronic lymphocytic leukemia; SLL, small lymphocytic lymphoma; MM, multiple myeloma; MGUS, monoclonal gammopathy of undetermined significance; NHL, non-Hodgkin’s lymphoma; DLBCL, diffuse large B-cell lymphoma; FL, follicular lymphoma; WM, Waldenstrom’s macroglobulinaemia; HL, Hodgkin’s lymphoma; U-mCA, unclassified mCAs.
Extended Data Fig. 4
Extended Data Fig. 4. Myeloid and lymphoid CHIP and mCAs identified in the MGBB cohort.
a) Top 25 myeloid and lymphoid driver genes mutated in MGBB cohort. b) Prevalence of M-CHIP and L-CHIP increase with age. c) Prevalence of M-mCA, L-mCA, and U-mCA increase with age. A-mCA were excluded because of small sample size. (b-c) Data is fit with the general additive model using cubic regression splines and the shaded bands indicate the estimated 95% confidence interval. d-e) M-mCA and L-mCA increase risk of myeloid and lymphoid malignancies, respectively. The incidence curves are un-adjusted for covariates. Data are presented as hazard ratio and 95% confidence intervals, computed by Cox proportional hazards model adjusting for age, sex, and genetic principal components 1–5. Incident multiple myeloma (MM) and monoclonal gammopathy of undetermined significance (MGUS) cases were excluded since those were only weakly associated with L-mCA in the UKB cohort. Groups with <2 events were excluded in the Cox model. M-CHIP, CHIP with myeloid driver, L-CHIP, CHIP with lymphoid driver; M-mCA, mCA with myeloid driver; L-mCA, mCA with lymphoid driver; A-mCA, mCA with ambiguous driver; U-mCA, unclassified mCAs; HR, hazard ratio; CI, confidence interval.
Extended Data Fig. 5
Extended Data Fig. 5. Co-occurrence of CHIP and mCAs.
a) Number of individuals with M-CHIP, L-CHIP, and mCAs. b) Genomic loci harboring CHIP variants and overlapping mCAs, leading to bi-allelic genetic alterations. Copy-neutral loss-of-heterozygosity at JAK2, TET2, and DNMT3A account for most of the overlapping CHIP and mCA alterations. c-d) Correlation between variant allele fraction of CHIP variants and cell fraction of mCAs. Overlapping CHIP and mCAs are marked by larger dots.
Extended Data Fig. 6
Extended Data Fig. 6. Co-occurrence of CHIP and mCA amplify risk of malignancies.
a) Risk of myeloid malignancies due to M-CHIP and M-mCA/A-mCA. b) Risk of lymphoid malignancies due to L-CHIP and L-mCA/A-mCA. (a-b) Since A-mCA were associated with risk of both myeloid and lymphoid malignancies, these are combined with M-mCA in the analysis of myeloid malignancies and with L-mCA in the analysis of lymphoid malignancies. Data are presented as hazard ratio and 95% confidence intervals, computed by using Cox proportional hazards model adjusting for age, sex, smoking, genetic ethnic ancestry, and genetic principal components 1–5. HR, hazard ratio; CI, confidence interval.
Extended Data Fig. 7
Extended Data Fig. 7. Multiple CH events bring higher risk of developing malignancies.
a-b) Multiple CH amplify risk of myeloid and lymphoid malignancies irrespective of the type of alterations. The analysis was performed among individuals with both WES and SNP-array data. Dashed curves indicate groups with multiple CH events. c-d) Multiple mCAs amplify risk of myeloid and lymphoid malignancies. (a-d) Since A-mCA were associated with risk of both myeloid and lymphoid malignancies, these are combined with M-mCA in the analysis of myeloid malignancies and with L-mCA in the analysis of lymphoid malignancies. Data are presented as hazard ratio and 95% confidence intervals, computed by using Cox proportional hazards model adjusting for age, sex, smoking, genetic ethnic ancestry, and genetic principal components 1–5. Individuals with >1 M-mCA/A-mCA and >1 L-CHIP were excluded in the multivariable Cox proportional hazard model due to small sample size and <3 events. HR, hazard ratio; CI, confidence interval.
Extended Data Fig. 8
Extended Data Fig. 8. Enrichment of blood cell indices among CH cases.
a) M-CHIP b) M-mCA c) L-CHIP d) L-mCA e) A-mCA f) unclassified mCAs (U-mCA). The associations between CH and normalized blood cell indices included in complete blood count and differentials were tested by using linear regression. The associations were tested separately in males and females and adjusted for age, ever smoking status, genetic ethnic ancestry, and genetic principal components. The dashed horizontal line indicates the significance threshold (adjusted p-value = 0.05). PCT, platelet crit; PLT, platelet count; ANC, absolute neutrophil count; Neuts%, neutrophil percentage; RDW, red blood cell distribution width; Monos, monocyte count; Monos%, monocyte percentage; Baso, basophil count; WBC, white blood cell count; Eos%, eosinophil percentage; ALC, absolute lymphocyte count; Lymphs%, lymphocyte percentage.
Extended Data Fig. 9
Extended Data Fig. 9. Abnormal CBC parameters increase risk of myeloid and lymphoid malignancies.
Both high and low myeloid cell parameters (neutrophil count, platelet count, or red blood cell count) are associated with increased risk of myeloid malignancies and high lymphocyte count is associated with increased risk of CLL/SLL in a) the WES cohort and b) the SNP-array cohort. (a-b) Data are presented as hazard ratio and 95% confidence intervals, computed by using Cox proportional hazards model adjusting for age, sex, smoking, genetic ethnic ancestry, and genetic principal components 1–5. Groups with small sample size and <3 events were excluded in the multivariable Cox proportional hazard model. CBC, complete blood count; High myeloid; high myeloid cell parameters, Low myeloid, low myeloid cell parameters; CLL, chronic lymphocytic leukemia, SLL, small lymphocytic lymphoma; HR, hazard ratio; CI, confidence interval.
Extended Data Fig. 10
Extended Data Fig. 10. Risk of mortality and coronary artery disease among CH cases.
a) M-CHIP and all classes of mCAs were associated with increased risk of all-cause-mortality but L-CHIP did not increase the risk of mortality. b) Only M-CHIP, A-mCA and U-mCA were associated with mortality unrelated to hematologic malignancies. c) M-CHIP is associated with increased risk of coronary artery disease. No other CH categories were associated with risk of coronary artery disease. (a-c) Data are presented as hazard ratio and 95% confidence intervals, computed by using Cox proportional hazards model adjusting for age, sex, smoking, genetic ethnic ancestry, and genetic principal components 1–5. HR, hazard ratio; CI, confidence interval; VAF, variant allele fraction; CF, cell fraction.
Figure 1:
Figure 1:. CH with myeloid and lymphoid drivers stratify risk of lineage-specific malignancies.
a) Prevalence of M-CHIP and L-CHIP increase with age. Data is fit with the general additive model using cubic regression splines and the shaded bands indicate the estimated 95% confidence interval. b) Frequencies of somatic variants detected in top 25 myeloid and lymphoid driver genes. c-d) M-CHIP and L-CHIP increase risk of myeloid and lymphoid malignancies, respectively. Individuals carrying both M-CHIP and L-CHIP (n=73) were excluded of whom five developed a myeloid malignancy and one developed a lymphoid malignancy. Hazard associated with L-CHIP for developing myeloid malignancies could not be computed due to small number of events. e-f) M-mCA and L-mCA increase risk of myeloid and lymphoid malignancies, respectively. Individuals carrying A-mCA and unclassified mCAs were excluded. The incidence curves are un-adjusted for covariates. (c-f) Data are presented as hazard ratio and 95% confidence intervals, computed by Cox proportional hazards model adjusting for age, sex, smoking, genetic ethnic ancestry, and genetic principal components 1–5. M-CHIP, CHIP with myeloid driver, L-CHIP, CHIP with lymphoid driver; M-mCA, mCA with myeloid driver; L-mCA, mCA with lymphoid driver; A-mCA, mCA with ambiguous driver; HR, hazard ratio; CI, confidence interval.
Figure 2:
Figure 2:. CH detected prior to the diagnosis of hematologic malignancies in WES cohort.
Rows indicate CHIP genes or mCAs, columns indicate individuals who developed hematologic malignancy between 6 months and 12 years after blood sample collection for sequencing (n=579), and the shells indicate number of CH alterations. The individuals are grouped by the type of first diagnosis of hematologic malignancies. Only CHIP genes and mCAs detected among individuals with an incident hematologic malignancy are shown. LOH, copy-neutral loss-of-heterozygosity; del, copy loss (deletion); gain, copy gain; tri, trisomy (gain of whole chromosome); MPN, myeloproliferative neoplasm; MDS, myelodysplastic syndrome; AML, acute myeloid leukemia; CLL, chronic lymphocytic leukemia; SLL, small lymphocytic lymphoma; MM, multiple myeloma; MGUS, monoclonal gammopathy of undetermined significance; NHL, non-Hodgkin’s lymphoma; DLBCL, diffuse large B-cell lymphoma; FL, follicular lymphoma; WM, Waldenstrom’s macroglobulinaemia; HL, Hodgkin’s lymphoma.
Figure 3:
Figure 3:. CH and CBC parameters predict the risk of developing myeloid malignancies and CLL/SLL.
a) CH with myeloid drivers (M-CHIP, M-mCA, or A-mCA) and abnormal myeloid cell parameters increase risk of myeloid malignancies. b) CH with lymphoid drivers (L-CHIP, L-mCA, or A-mCA) and high lymphocyte count increase risk of CLL/SLL. Hazards associated with groups with <3 events were not computed. (a-b) Data are presented as hazard ratio and 95% confidence intervals, computed by Cox proportional hazards model adjusting for age, sex, smoking, genetic ethnic ancestry, and genetic principal components 1–5. c) Sensitivity and specificity curves for predicting the incidence of myeloid malignancies computed by 10-fold cross-validation. Individuals with a diagnosis of myeloid malignancy (n=157) and those that did not have a diagnosis of myeloid or lymphoid malignancies (n=44781) were used for training and testing. d) Sensitivity and specificity curves for predicting the incidence of CLL/SLL computed by 10-fold cross-validation. Individuals with a diagnosis of CLL or SLL (n=61) and those that did not have a diagnosis of myeloid or lymphoid malignancies (n=44781) were used for training and testing. (c-d) Baseline predictor included demographic characteristics (age, sex, smoking status, and genetic ethnic ancestry). CHIP (number of CHIP variants and maximum VAF), mCA (number of alterations and maximum cell fraction), and CBC were added as predictors together with demographic characteristics. The values inside the parentheses indicate the AUC. Since A-mCA were associated with risk of both myeloid and lymphoid malignancies, these are combined with M-mCA in the analysis of myeloid malignancies and with L-mCA in the analysis of lymphoid malignancies. HR, hazard ratio; CI, confidence interval; CLL, chronic lymphocytic leukemia; SLL, small lymphocytic lymphoma; CBC, complete blood count; VAF, variant allele fraction; AUC, area under the curve.

References

    1. Jaiswal S, et al. Age-related clonal hematopoiesis associated with adverse outcomes. N Engl J Med 371, 2488–2498 (2014). - PMC - PubMed
    1. Genovese G, et al. Clonal hematopoiesis and blood-cancer risk inferred from blood DNA sequence. N Engl J Med 371, 2477–2487 (2014). - PMC - PubMed
    1. Xie M, et al. Age-related mutations associated with clonal hematopoietic expansion and malignancies. Nat Med 20, 1472–1478 (2014). - PMC - PubMed
    1. Loh PR, et al. Insights into clonal haematopoiesis from 8,342 mosaic chromosomal alterations. Nature 559, 350–355 (2018). - PMC - PubMed
    1. Loh PR, Genovese G & McCarroll SA Monogenic and polygenic inheritance become instruments for clonal selection. Nature 584, 136–141 (2020). - PMC - PubMed

Methods References

    1. Van Hout CV, et al. Exome sequencing and characterization of 49,960 individuals in the UK Biobank. Nature 586, 749–756 (2020). - PMC - PubMed
    1. Manichaikul A, et al. Robust relationship inference in genome-wide association studies. Bioinformatics 26, 2867–2873 (2010). - PMC - PubMed
    1. Smoller JW, et al. An eMERGE Clinical Center at Partners Personalized Medicine. J Pers Med 6(2016). - PMC - PubMed
    1. Benjamin D, et al. Calling somatic SNVs and indels with Mutect2. bioRxiv (2019).
    1. Karczewski KJ, et al. The mutational constraint spectrum quantified from variation in 141,456 humans. Nature 581, 434–443 (2020). - PMC - PubMed

Publication types

MeSH terms