. 2021 Oct:152:203-215.
doi: 10.1016/j.tra.2021.08.007. Epub 2021 Aug 30.

Delayed reaction towards emerging COVID-19 variants of concern: Does history repeat itself?

Affiliations

Delayed reaction towards emerging COVID-19 variants of concern: Does history repeat itself?

Xiaoqian Sun et al. Transp Res Part A Policy Pract. 2021 Oct.

Abstract

After more than a year with COVID-19, it becomes increasingly clear that certain variants of concern have the potential to be game changers, determining the future of our aviation. These variants pose significant health threats and possibly undermine ongoing vaccination efforts. Recent research showed that flight bans on the initial SARS-CoV-2 outbreak in January 2020 were implemented too late and therefore, turned out to be largely ineffective, enabling a swift turn into a fully-blown pandemic. In this study, we investigate the following question: How effective were existing flight bans against the newly emerged variants of concern? In other words: Do airlines and countries happen to repeat the same mistake again? We analyze the spread of the three most prevalent variants of concern right now: B.1.1.7 (known as the UK variant), B.1.351 (known as the South African variant), and P.1 (known as the Brazilian variant). We find that many countries, again, implemented flights bans once the mutated virus had enough time to be imported via air transportation. To support our empirical analysis further, we designed and implemented a compartmental network spreading model on top of worldwide flight data for the years 2020 and 2021. We observe that the model predictions are rather accurate and confirm our findings. Overall, we hope that our study encourages air transportation stakeholders and policy makers to avoid repeating earlier mistakes in the future, with the ultimate goal to overcome COVID-19 entirely.

Keywords: Air transportation; COVID-19; Variants of concern.


Conflict of interest statement

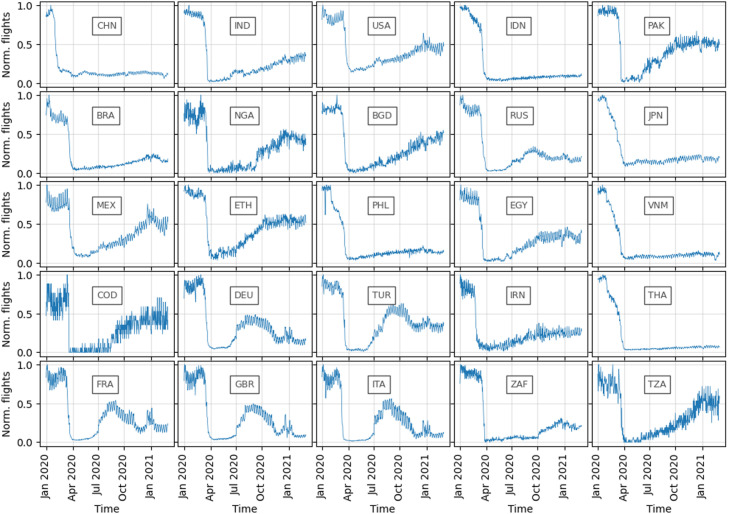
The authors declare that they have no known competing financial interests or personal relationships that could have appeared to influence the work reported in this paper.Table 4Notes for Fig. 1, containing full names of top 20 airports.IATA-CodeAirportATLHartsfield–Jackson Atlanta International AirportCANGuangzhou Baiyun International AirportCKGChongqing Jiangbei International AirportCLTCharlotte Douglas International AirportDELIndira Gandhi International AirportDENDenver International AirportDFWDallas Fort Worth International AirportHNDTokyo International AirportIAHGeorge Bush Intercontinental AirportKMGKunming Wujiaba International AirportLAXLos Angeles International AirportMEXMexico City AirportMIAMiami International AirportORDChicago O’Hare International AirportPEKBeijing Capital AirportPHXPhoenix Sky Harbor AirportSEASeattle SEATAC AirportSHAShanghai Hongqiao AirportSZXShenzhen Bao’an International AirportXIYXian AirportTable 5Travel entry restrictions for selected countries shown in Fig. 5. Abbreviations: BHR = Ban from high-risk regions, CLOS = Closed, QHR = Quarantine from high-risk regions, and SCREEN = Screening.CodeJanuary 2020April 2020July 2020October 2020January 2021BGDNoneBHRBHRBHRBHRBRANoneCLOSCLOSSCREENSCREENCHNNoneBHRBHRBHRBHRCODNoneCLOSCLOSSCREENSCREENEGYNoneCLOSNoneSCREENSCREENETHNoneBHRBHRQHRQHRFRANoneBHRBHRBHRBHRDEUNoneCLOSBHRBHRBHRINDNoneCLOSCLOSCLOSBHRIDNNoneCLOSCLOSBHRBHRIRNNoneNoneNoneBHRBHRITANoneBHRBHRBHRBHRJPNNoneQHRBHRSCREENCLOSMEXNoneBHRBHRSCREENSCREENNGANoneCLOSCLOSQHRQHRPAKNoneCLOSQHRQHRQHRPHLNoneCLOSCLOSQHRQHRRUSNoneCLOSCLOSBHRBHRZAFNoneCLOSCLOSBHRSCREENTZANoneBHRNoneSCREENSCREENTHANoneCLOSBHRBHRQHRTURNoneCLOSBHRSCREENQHRGBRNoneNoneQHRQHRBHRUSANoneBHRBHRBHRBHRVNMNoneCLOSBHRCLOSCLOSData source: https://ourworldindata.org.

Figures

Fig. 1
Fig. 1
Overview on the 3,227 subpopulations. The top 20 largest subpopulations are highlighted by the IATA code of their largest airport. For airport names of the subpopulations, please refer to the notes in Appendix.
Fig. 2
Fig. 2
Evolution of the normalized number of flights from GBR to the ten countries that reported the first cases of Lineage B.1.1.7. The shaded area highlights the time period between the first reported case in GBR (start of the interval) and the first reported case in the destination country (end of the interval). Flight restrictions come very late; often after the first reported case in the destination.
Fig. 3
Fig. 3
Evolution of the normalized number of flights from ZAF to the ten countries that reported the first cases of Lineage B.1.351. The shaded area highlights the time period between the first reported case in ZAF (start of the interval) and the first reported case in the destination country (end of the interval). Surprisingly, flight bans were often being relaxed in the critical period of spreading.
Fig. 4
Fig. 4
Evolution of the normalized number of flights from BRA to the ten countries that reported the first cases of Lineage P.1. The shaded area highlights the time period between the first reported case in BRA (start of the interval) and the first reported case in the destination country (end of the interval). Stable number of flights or absence of direct connections (for KOR, JPN, and FRO) is observed.
Fig. 5
Fig. 5
Comparison of spreading times from one of the top 25 countries with the largest populations towards any other country. Five points of time are compared from top to bottom: January 2020, April 2020, July 2020, October 2020, and January 2021. For each origin country along the x-axis, the bar shows the frequency distribution of days until the first international infection is recorded.
Fig. 6
Fig. 6
Evolution of the number of daily international flights for the top 25 countries since January 2020. The flights are normalized for better comparison between countries. The text label in the center of each subplot represents the ISO3 country code of the origin country.
Fig. 7
Fig. 7
Simulation results for the effect of different flight reductions on the number of days until the first international case. The country of origin is set as one of the top 25 largest countries, as reported in each subplot. The x-axis represents the flight reduction from 0.0 (baseline before COVID-19) and 1.0 (no international flights).
Fig. 8
Fig. 8
Comparisons of early spreading destinations with the top 25 largest countries as source, comparing January 2021 with January 2020. Countries are highlighted by color: countries being ranked among the first 10 in both scenarios (black), countries among the first 10 in January 2020 only (green), and countries among the first 10 in January 2021 only (red). The number counts the black-highlighted countries. (For interpretation of the references to color in this figure legend, the reader is referred to the web version of this article.)
Fig. 9
Fig. 9
Frequency of countries which are emergent early destinations comparing January 2021 with January 2020.
Fig. 10
Fig. 10
Normalized number of international flights per day for Qatar (left) and the United Arab Emirates (right).
Fig. 11
Fig. 11
Number of reachable destination countries per day for Qatar (left) and the United Arab Emirates (right).
Fig. 12
Fig. 12
Number of daily confirmed COVID-19 cases for India.

References

    1. Balcan D., Colizza V., Gonçalves B., Hu H., Ramasco J.J., Vespignani A. Multiscale mobility networks and the spatial spreading of infectious diseases. Proc. Natl. Acad. Sci. 2009;106(51):21484–21489. - PMC - PubMed
    1. Balcan D., Gonçalves B., Hu H., Ramasco J.J., Colizza V., Vespignani A. Modeling the spatial spread of infectious diseases: The global epidemic and mobility computational model. J. Comput. Sci. 2010;1(3):132–145. - PMC - PubMed
    1. Bogoch I., Creatore M.I., Cetron M.S., et al. Assessment of the potential for international dissemination of ebola virus via commercial air travel during the 2014 west african outbreak. Lancet. 2015;385(9962):29–35. - PMC - PubMed
    1. Bowen J., Laroe C. Airline networks and the international diffusion of severe acute respiratory syndrome (SARS) The Geogr. J. 2006;172:130–144. doi: 10.1111/j.1475-4959.2006.00196.x. - DOI - PMC - PubMed
    1. Brockmann D., Helbing D. The hidden geometry of complex, network-driven contagion phenomena. Science. 2013;342(6164):1337–1342. - PubMed

LinkOut - more resources