Meta-Analysis
. 2022 Jan;23(1):e13370.
doi: 10.1111/obr.13370. Epub 2021 Oct 19.

The magnitude and progress of lean body mass, fat-free mass, and skeletal muscle mass loss following bariatric surgery: A systematic review and meta-analysis

Affiliations
Meta-Analysis

The magnitude and progress of lean body mass, fat-free mass, and skeletal muscle mass loss following bariatric surgery: A systematic review and meta-analysis

Malou A H Nuijten et al. Obes Rev. 2022 Jan.

Abstract

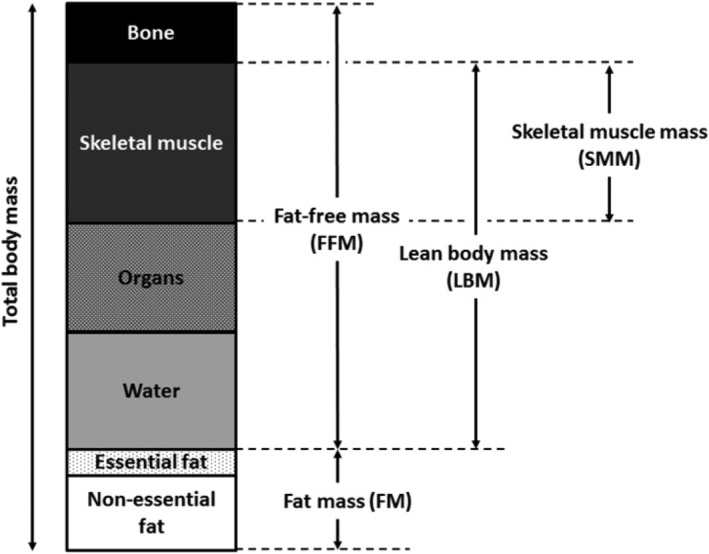
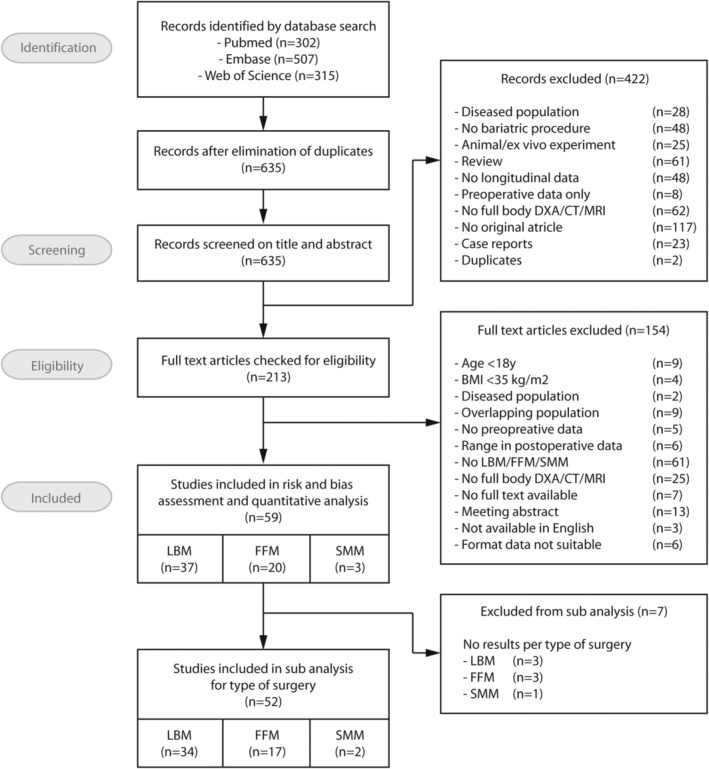
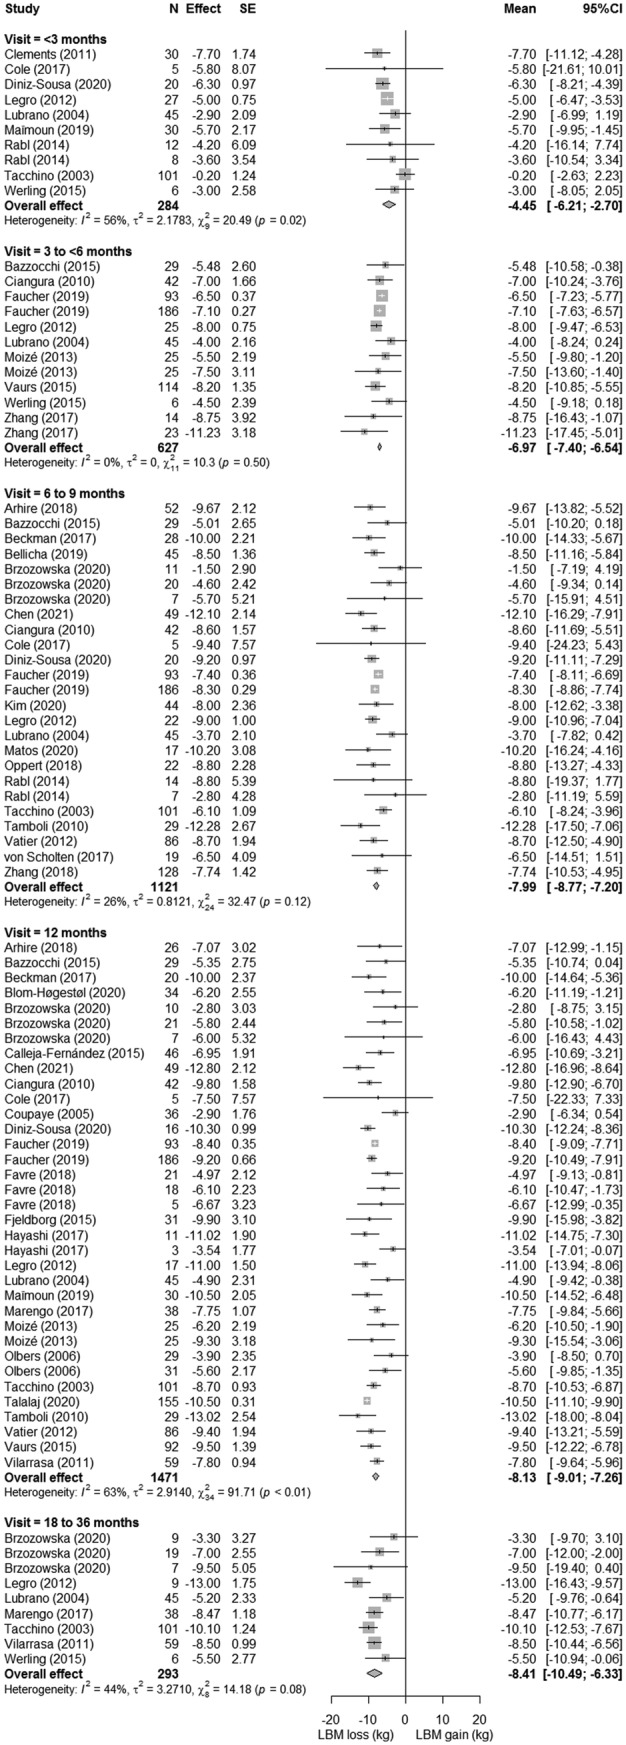
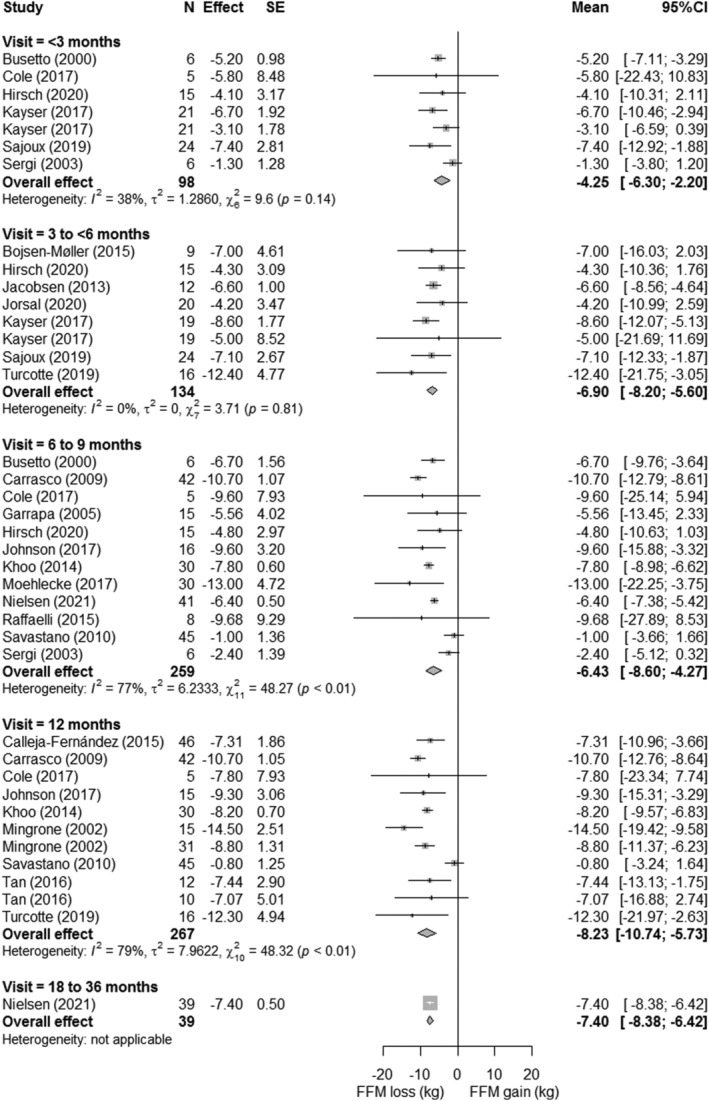
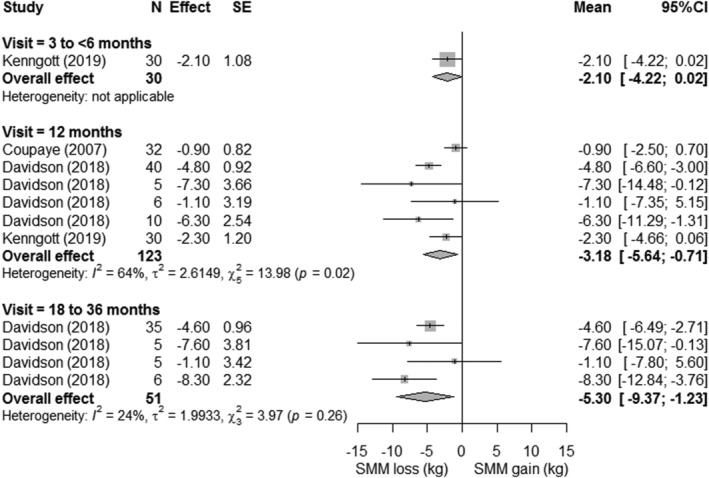
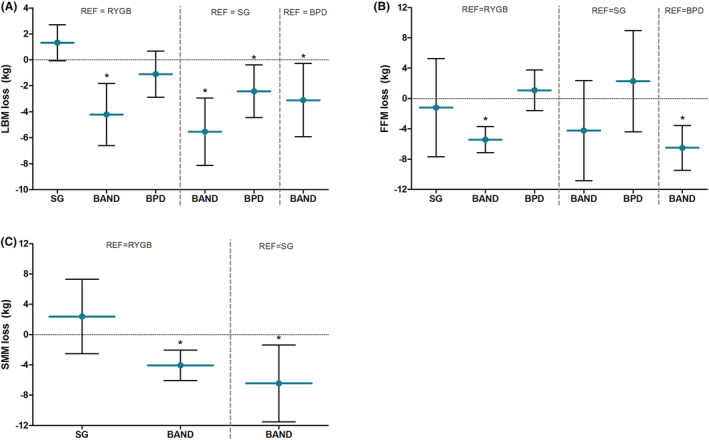
Postbariatric loss of muscle tissue could negatively affect long-term health due to its role in various bodily processes, such as metabolism and functional capacity. This meta-analysis aimed to unravel time-dependent changes in the magnitude and progress of lean body mass (LBM), fat-free mass (FFM), and skeletal muscle mass (SMM) loss following bariatric surgery. A systematic literature search was conducted in Pubmed, Embase, and Web of Science. Fifty-nine studies assessed LBM (n = 37), FFM (n = 20), or SMM (n = 3) preoperatively and ≥1 time points postsurgery. Random-effects meta-analyses were performed to determine pooled loss per outcome parameter and follow-up time point. At 12-month postsurgery, pooled LBM loss was -8.13 kg [95%CI -9.01; -7.26]. FFM loss and SMM loss were -8.23 kg [95%CI -10.74; -5.73] and -3.18 kg [95%CI -5.64; -0.71], respectively. About 55% of 12-month LBM loss occurred within 3-month postsurgery, followed by a more gradual decrease up to 12 months. Similar patterns were seen for FFM and SMM. In conclusion, >8 kg of LBM and FFM loss was observed within 1-year postsurgery. LBM, FFM, and SMM were predominantly lost within 3-month postsurgery, highlighting that interventions to mitigate such losses should be implemented perioperatively.

Keywords: bariatric surgery; fat-free mass; lean body mass; skeletal muscle mass.


Conflict of interest statement

No conflict of interest was declared.

Figures

FIGURE 1
FIGURE 1
The components of fat‐free mass, lean body mass, and skeletal muscle mass according to the definitions used by magnetic resonance imaging (MRI), dual energy X‐ray absorptiometry (DXA), or computed tomography (CT) scans. Please note that proportions of the components are an approximation; exact proportions may vary across individuals
FIGURE 2
FIGURE 2
Preferred Reporting Items for Systematic reviews and Meta‐Analysis (PRISMA) flowchart of search strategy outcomes and screening process. CT, computed Tomography; DXA, dual energy X‐ray absorptiometry; FFM, fat‐free mass; LBM, lean body mass; MRI, magnetic resonance imaging; SMM, skeletal muscle mass
FIGURE 3
FIGURE 3
Forest plots of lean body mass loss with respect to preoperative measures. The effect size (mean difference between preoperative and postoperative measure) and 95% confidence interval for individual studies and the pooled estimate per time point are depicted. Mean follow‐up time was 1.1 ± 0.6 months for <3 months, 3.2 ± 0.4 months for 3 to 6 months, 6.1 ± 0.3 months for 6 to 9 months, 12 ± 0 months for 12 months, and 26.2 ± 5.7 months for 18 to 36 months
FIGURE 4
FIGURE 4
Forest plots of fat‐free mass loss with respect to preoperative measures. The effect size (mean difference between preoperative and postoperative measure) and 95% confidence interval for individual studies and the pooled estimate per time point are depicted. Mean follow‐up time was 1.5 ± 0.8 months for <3 months, 3.3 ± 0.7 months for 3 to 6 months, 6 ± 0 months for 6 to 9 months, 12 ± 0 months for 12 months, and 18 ± 0 months for 18 to 36 months
FIGURE 5
FIGURE 5
Forest plots of skeletal muscle mass loss with respect to preoperative measures. The effect size (mean difference between preoperative and postoperative measure) and 95% confidence interval for individual studies and the pooled estimate per time point are depicted. Mean follow‐up time was 3 ± 0 months for 3 to 6 months, 12 ± 0 months for 12 months, and 24 ± 0 months for 18 to 36 months
FIGURE 6
FIGURE 6
Differences in lean body mass loss (A), fat‐free mass loss (B), and skeletal muscle mass loss (C) in kilograms between bariatric procedures adjusted for time‐effects. Blue horizontal lines reflect the mean difference with respect to the reference group, and the error bars reflect the corresponding lower and upper limit of the 95%CI. A positive value on the y‐axis reflects a greater loss compared with the reference group, whereas a negative value reflects a smaller loss than the reference group. BAND, adjustable gastric band operation; BPD, biliopancreatic diversion; RYGB, Roux‐en‐Y Gastric bypass; SG, sleeve gastrectomy; * P < 0.05 with respect to reference group

References

    1. Sjostrom L. Review of the key results from the Swedish Obese Subjects (SOS) trial—A prospective controlled intervention study of bariatric surgery. J Intern Med. 2013;273(3):219‐234. - PubMed
    1. Nuijten MAH, Monpellier VM, Eijsvogels TMH, Janssen IMC, Hazebroek EJ, Hopman MTE. Rate and determinants of excessive fat‐free mass loss after bariatric surgery. Obes Surg. 2020;30(8):3119‐3126. - PMC - PubMed
    1. Davidson LE, Yu W, Goodpaster BH, et al. Fat‐free mass and skeletal muscle mass five years after bariatric surgery. Obesity (Silver Spring). 2018;26(7):1130‐1136. - PMC - PubMed
    1. Wolfe RR. The underappreciated role of muscle in health and disease. Am J Clin Nutr. 2006;84(3):475‐482. - PubMed
    1. Cunningham JJ. Body composition as a determinant of energy expenditure: A synthetic review and a proposed general prediction equation. Am J Clin Nutr. 1991;54(6):963‐969. - PubMed