

YAP/TAZ and ATF4 drive resistance to Sorafenib in hepatocellular carcinoma by preventing ferroptosis
- PMID: 34664408
- PMCID: PMC8649869
- DOI: 10.15252/emmm.202114351
YAP/TAZ and ATF4 drive resistance to Sorafenib in hepatocellular carcinoma by preventing ferroptosis
Abstract
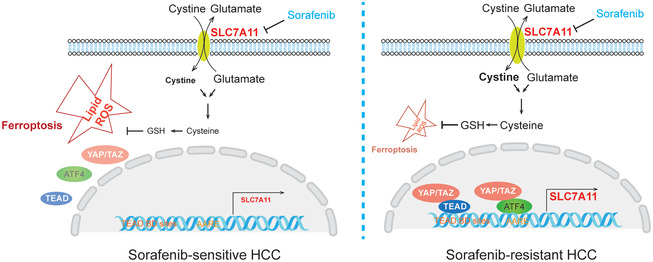
Understanding the mechanisms underlying evasive resistance in cancer is an unmet medical need to improve the efficacy of current therapies. In this study, a combination of shRNA-mediated synthetic lethality screening and transcriptomic analysis revealed the transcription factors YAP/TAZ as key drivers of Sorafenib resistance in hepatocellular carcinoma (HCC) by repressing Sorafenib-induced ferroptosis. Mechanistically, in a TEAD-dependent manner, YAP/TAZ induce the expression of SLC7A11, a key transporter maintaining intracellular glutathione homeostasis, thus enabling HCC cells to overcome Sorafenib-induced ferroptosis. At the same time, YAP/TAZ sustain the protein stability, nuclear localization, and transcriptional activity of ATF4 which in turn cooperates to induce SLC7A11 expression. Our study uncovers a critical role of YAP/TAZ in the repression of ferroptosis and thus in the establishment of Sorafenib resistance in HCC, highlighting YAP/TAZ-based rewiring strategies as potential approaches to overcome HCC therapy resistance.
Keywords: ATF4; Hippo signaling; YAP/TAZ; ferroptosis; liver cancer.
© 2021 The Authors. Published under the terms of the CC BY 4.0 license.
Conflict of interest statement
The authors declare that they have no conflict of interest.
Figures
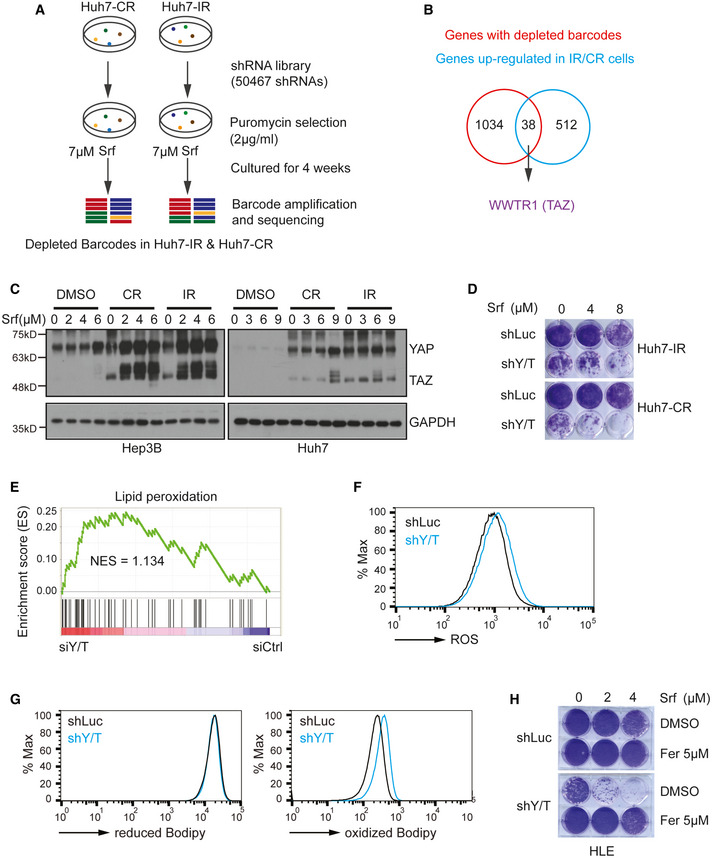
Scheme of the shRNA‐mediated synthetic lethal screen. Huh7‐IR and CR cells were infected with lentiviral vectors (MOI = 0.5) expressing the shRNA library (human genome‐wide pooled lentiviral shRNA library module 1, vector: pRSI16cb, Cellecta) and cultured with 2 μg/ml puromycin for the selection of shRNA‐expressing cells plus 7 μM Sorafenib (Srf). After 4 weeks of culture, genomic DNA was extracted, and shRNA barcodes were amplified for next‐generation sequencing to uncover the critical genes for Sorafenib resistance.
Combinatorial analysis of genes differentially expressed between Sorafenib‐sensitive and resistant cells and genes with depleted barcodes in the synthetic lethal screen in Huh7‐IR and CR cells. Thirty‐eight common genes were identified, among which was WWTR1 coding for TAZ.
Huh7‐parental, IR and CR, and Hep3B‐parental, and IR and CR cells were treated with different concentrations of Sorafenib (0, 3, 6, 9 μM) for Huh7‐P/IR/CR and Sorafenib (0, 2, 4, 6 μM) for Hep3B‐P/IR/CR for 18 h before harvest. Protein levels of YAP and TAZ were determined by immunoblotting illustrating higher protein levels of YAP/TAZ in Sorafenib‐resistant cells. GAPDH served as loading control. Results represent three independent experiments.
Colony formation assay showing that shRNA‐mediated depletion of YAP/TAZ leads to cell numbers in response to Sorafenib treatment. Huh7 IR and CR cells either expressing a control shRNA (shLuc, non‐targeting shRNA) or shRNA against both YAP and TAZ (shY/T) were treated with different concentrations of Sorafenib (0, 4, 8 μM) for 2 weeks and colonies were visualized by crystal violet staining. Results represent three independent experiments.
Gene Set Enrichment Analysis (GSEA) of the genes differentially expressed between YAP/TAZ‐deficient (siY/T) and control siRNA (siCtrl) transfected HLE cells showed an enrichment for genes involved in the regulation of lipid peroxidation.
Basal reactive oxygen (ROS) levels increased upon loss of YAP/TAZ. HLE‐shLuc and HLE‐shY/T cell lines were stained with CellROX™ Green Flow Cytometry Assay Kit, and ROS levels were measured by flow cytometry using a 488 nm laser. Results represent three independent experiments.
Basal lipid peroxidation levels increased with the loss of function of YAP/TAZ. HLE‐shLuc and HLE‐shY/T cells were stained with C11‐BODIPY 581/591. Reduced‐Bodipy was measured by flow cytometry using a 488 nm laser, and oxidized‐Bodipy was measured with a 561 nm laser. A significant shift of oxidized‐Bodipy occurred upon depletion of YAP/TAZ. Results represent three independent experiments.
Colony formation assay demonstrating that the ferroptosis inhibitor Ferrostatin‐1 (Fer) reversed Sorafenib‐induced cell death in YAP/TAZ‐deficient HCC cells. HLE‐shLuc and shY/T cells were treated with different concentrations of Sorafenib (0, 2, 4 μM) and either DMSO or Ferrostatin‐1 (Fer; 5 μM) for 2 weeks. Results represent three independent experiments.
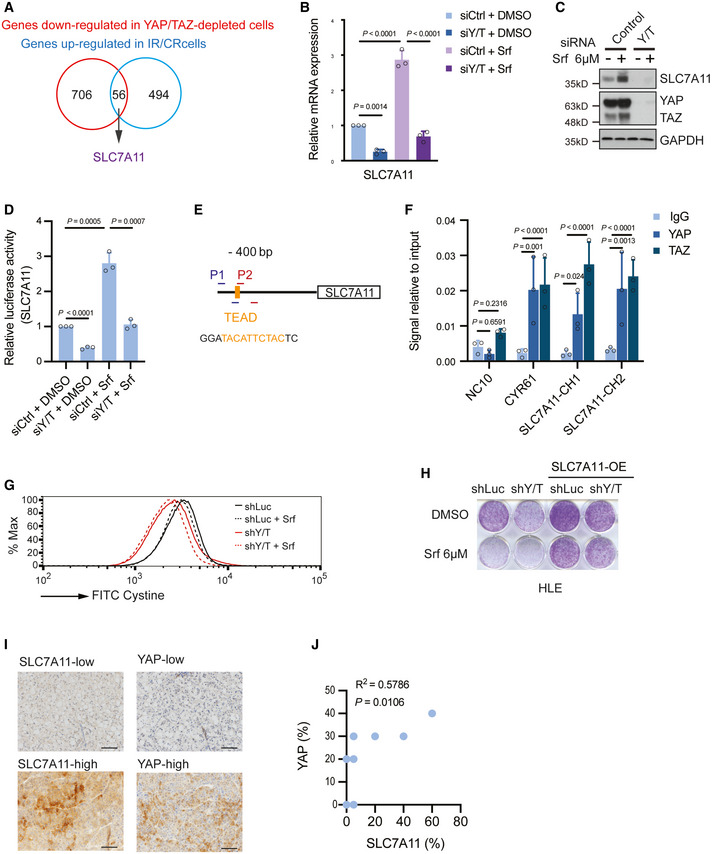
Combinatorial analysis of the genes upregulated in Sorafenib‐resistant cells and the genes downregulated upon YAP/TAZ depletion uncovered 56 common genes, among which was SLC7A11.
Quantitative RT‐PCR analysis confirmed the dependency of SLC7A11 gene expression on YAP/TAZ. HLE cells were transfected with control siRNA (siCtrl) or siRNA against YAP/TAZ (siY/T) and cultured with DMSO or 6 μM Sorafenib for 18 h. RNA was extracted and analyzed by quantitative RT‐PCR. Data are shown as mean ± standard deviation (SD). Statistical significance was calculated using one‐way ANOVA. Results represent three independent experiments.
SLC7A11 protein levels were upregulated by the exposure to Sorafenib, yet downregulated by siRNA‐mediated depletion of YAP/TAZ. HLE cells were transfected with siCtrl or siY/T and cultured with DMSO or 6 μM Sorafenib for 18 h before harvest, followed by immunoblotting for YAP/TAZ and SLC7A1. GAPDH served as loading control. Results represent three independent experiments.
siRNA‐mediated ablation of YAP/TAZ significantly reduced SLC7A11 promoter activity, as determined by SLC7A11‐promoter‐luciferase reporter assay. HLE cells were transfected with SLC7A11‐promoter firefly luciferase reporter construct and a constitutive‐active Renilla luciferase reporter construct (pRL‐CMV) and with siCtrl or siY/T. Relative luciferase activity was measured using the Dual‐Luciferase Reporter Assay Kit (Promega E1980). Data are shown as mean ± standard deviation (SD). Statistical significance was calculated using one‐way ANOVA. Results represent three independent experiments.
A potential TEAD binding motif was predicted at – 400 bp within the promoter region of SLC7A11. PCR primers SLC7A11‐CH1 (P1) and SLC7A11‐CH2 (P2) were designed to examine the potential binding of transcription factors to the TEAD binding motif by chromatin immunoprecipitation (ChIP).
Binding of YAP and TAZ to a DNA fragment containing the TEAD binding motif in the SLC7A11 promoter. ChIP was performed on HLE cell lysate with antibodies against YAP and TAZ and rabbit IgG as control. DNA fragments were amplified using the primers specific for TEAD binding motif in the SLC7A11 promoter region shown in (E). The non‐coding region NC10 served as negative control, and the bona fide TEAD target gene CYR61 served as positive control. Data are shown as mean ± standard deviation (SD). Statistical significance was calculated using one‐way ANOVA. Results represent three independent experiments.
Knockdown of YAP/TAZ impairs cystine uptake either with or without Sorafenib treatment, and cystine uptake decreased with the exposure to Sorafenib. HLE‐shLuc and HLE‐shY/T cells were cultured with DMSO or 6 μM Sorafenib for 18 h, cystine‐FITC was added to cells, and after incubation at 37°C for 30 min, intracellular Cystine‐FITC levels were measured by flow cytometry using a 488 nm laser. Results represent three independent experiments.
Colony formation assay showing that stable overexpression of SLC7A11 reversed Sorafenib‐induced cell death in YAP/TAZ‐deficient HCC cells. HLE‐shLuc and HLE‐shY/T were or were not transfected to overexpress SLC7A11 (SLC7A11 OE) and treated with DMSO or 6 μM Sorafenib for 2 weeks as indicated. Results represent three independent experiments.
Representative images of immunohistochemical staining of SLC7A11 and YAP proteins in HCC samples from patients. Scale bars, 50 μm.
Quantification of the immunohistochemical stainings shown in (I) revealed a positive correlation of YAP and SLC7A11 expression (N = 10). Statistical significance was calculated using Pearson correlation analysis.
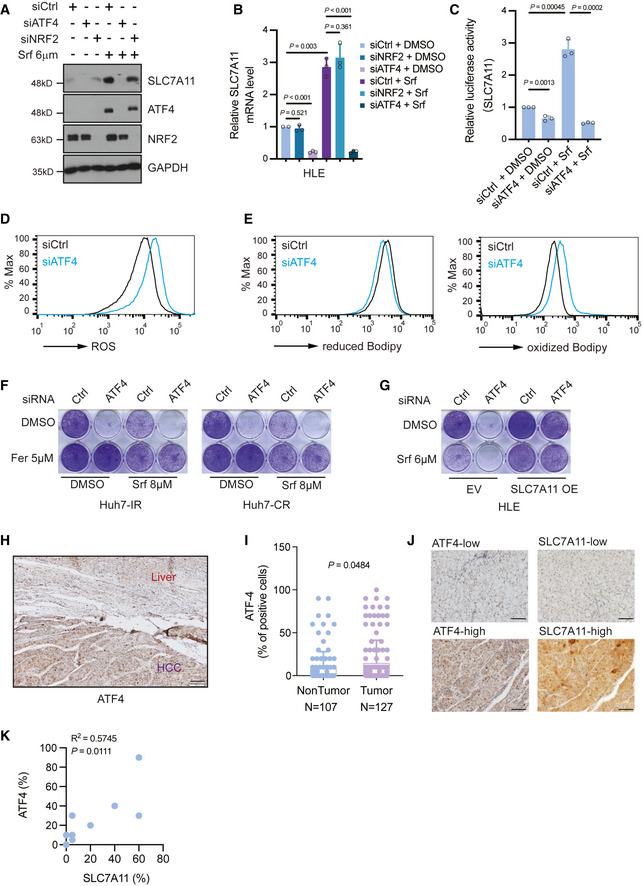
SLC7A11 protein levels decreased upon siRNA‐mediated depletion of ATF4 but not of NRF2 either with or without Sorafenib treatment, and Sorafenib promoted the expression of ATF4. HLE cells were transfected with siCtrl, siATF4 or siNRF2 and treated with or without 6 μM Sorafenib for 18 h. The expression of SLC7A11, ATF4, and NRF2 was determined by immunoblotting. GAPDH served as loading control. Results represent three independent experiments.
SLC7A11 mRNA levels were decreased upon ATF4 depletion but not NRF2 depletion. HLE cells were transfected with siCtrl, siATF4, or siNRF2 and cultured with DMSO or 6 μM Sorafenib for 18 h. Quantitative RT‐PCR was used to determine SLC7A11 mRNA levels. Data are shown as mean ± standard deviation (SD). Statistical significance was calculated using one‐way ANOVA. Results represent three independent experiments.
siRNA‐mediated ablation of ATF4 significantly reduced SLC7A11 promoter activity, as determined by SLC7A11‐promoter‐luciferase reporter assay. HLE cells were transfected with SLC7A11‐promoter firefly luciferase reporter construct and a constitutive‐active Renilla luciferase reporter construct (pRL‐CMV) and with siCtrl or siATF4 and treated or not with 6 µM Sorafenib. Relative luciferase activity was measured using the Dual‐Luciferase Reporter Assay Kit (Promega E1980). Data are shown as mean ± standard deviation (SD). Statistical significance was calculated using one‐way ANOVA. Results represent three independent experiments.
Basal reactive oxygen (ROS) levels increased upon loss of ATF4. HLE cells were transfected with siCtrl or siATF4 and cultured for 36 h were stained with CellROX™ Green Flow Cytometry Assay Kit, ROS levels were measured by flow cytometry using a 488 nm laser. Results represent three independent experiments.
Basal lipid peroxidation levels increased with the loss of ATF4. HLE cells were transfected with siCtrl or siATF4 and cultured for 36 h were stained with C11‐BODIPY 581/591. Reduced‐Bodipy was measured by flow cytometry using a 488 nm laser, and oxidized‐Bodipy was measured with a 561 nm laser. A significant shift of oxidized‐Bodipy occurred upon depletion of ATF4. Results represent three independent experiments.
Colony formation assay demonstrating that the ferroptosis inhibitor Ferrostatin‐1 (Fer) reversed Sorafenib‐induced cell death in ATF4‐deficient HCC cells. HLE cells transfected with siCtrl or siATF4 were treated with Sorafenib (8 μM) or DMSO plus either DMSO or Ferrostatin‐1 (Fer; 5 μM) for 2 weeks. Results represent three independent experiments.
The forced expression of SLC7A11 rescued from cell death induced by ATF4 ablation. HLE cells were transfected with a construct coding for SLC7A11 (SLC7A11 OE) or empty vector (EV) and with siCtrl or siATF4 every other day. Cells were then treated with either DMSO or 6 μM Sorafenib for 2 weeks. Colony formation was visualized by crystal violet staining. Results represent three independent experiments.
Immunohistochemical staining of ATF4 in HCC and adjacent non‐neoplastic areas from patients. Tumor tissues showed a higher expression of ATF4. Scale bar, 100 μm.
Quantification of ATF4‐positive cells in tumor and non‐tumor samples showed that HCC tumors present higher ATF4 levels. Data are shown as mean ± standard deviation (SD). Statistical significance was calculated using unpaired t‐test.
Representative images of immunohistochemical staining of ATF4 and SLC7A11 proteins in HCC samples from patients. Scale bars, 50 μm.
Quantification of the immunohistochemical stainings in (J) showed a positive correlation of ATF4 and SLC7A11 expression (N = 10). Statistical significance was calculated using Pearson correlation analysis.
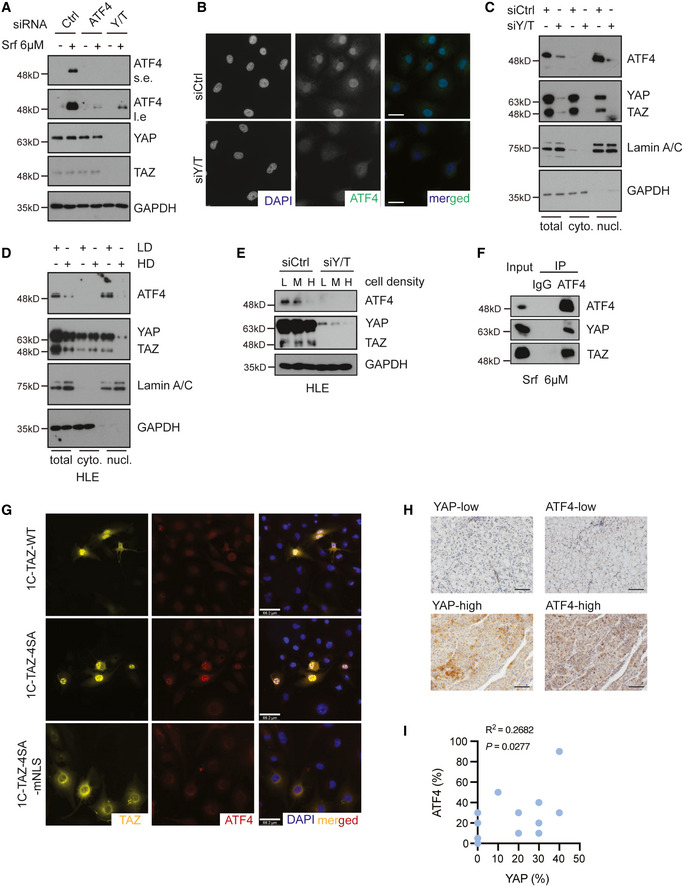
YAP/TAZ deficiency repressed Sorafenib‐induced expression of ATF4, whereas ATF4 depletion had no effect on YAP/TAZ protein levels. HLE cells were transfected with siCtrl or siATF4 or siY/T and treated with 6 μM Sorafenib or not for 18 h. ATF4 and YAP/TAZ protein levels were analyzed by immunoblotting. GAPDH served as loading control. Results represent three independent experiments.
YAP/TAZ deficiency induced a reduction of ATF4 protein level and nuclear localization. HLE cells were transfected with siCtrl or siY/T, and ATF4 and YAP/TAZ were visualized by immunofluorescence microscopy. DAPI visualized nuclei. Scale bars, 50 μm. Results represent three independent experiments.
Cellular fractionation revealed that YAP/TAZ deficiency reduced ATF4 nuclear localization. HLE cells were transfected with siCtrl or siY/T, and cell lysates were separated into cytoplasmic and nuclear fractions and analyzed by immunoblotting for ATF4 and YAP/TAZ. GAPDH served as loading control of total lysate and cytoplasmic fractions, Lamin A/C served as loading control for nuclear proteins. Results represent three independent experiments.
Cellular fractionation revealed that high cell density and, with it, lower YAP/TAZ activity reduced the levels of nuclear ATF4. HLE cells were seeded at different cell numbers, and cell lysates of high cell density cells (HD) and low cell density (LD) were fractionated into cytoplasmic and nuclear fractions and analyzed for ATF4 and YAP/TAZ by immunoblotting. GAPDH served as loading control for total lysate and cytoplasmic proteins, Lamin A/C served as loading control for nuclear proteins. Results represent three independent experiments.
Increasing cell density declined YAP/TAZ stability and led to a reduction of ATF4. HLE cells were seeded to reach low (L), medium (M), and high (H) cell densities and transfected with siCtrl or siY/T. Protein levels of ATF4 and YAP/TAZ were determined by immunoblotting blotting. GAPDH served as loading control. Results represent three independent experiments.
YAP/TAZ physically interacted with ATF4. HLE cells were cultured with 6 μM Sorafenib for 18 h and ATF4 was immunoprecipitated and precipitated YAP, TAZ, and ATF4 were visualized by immunoblotting. Unrelated IgG was used as control for immunoprecipitation. Input represents cell lysates directly analyzed by immunoblotting. Results represent three independent experiments.
YAP/TAZ directed the nuclear localization of ATF4. HLE cells were transfected with plasmid constructs coding for wild‐type TAZ (1C‐TAZ‐WT), constitutive‐active TAZ (1C‐TAZ‐ 4SA), or constitutive‐active TAZ lacking a nuclear localization signal (NLS) (1C‐TAZ‐mNLS) and analyzed for TAZ and ATF4 expression and localization by immunofluorescence microscopy. DAPI visualized nuclei. Scale bars, 66.2 μm. Results represent three independent experiments.
Representative images of immunohistochemical staining of ATF4 and YAP proteins in HCC samples from patients. Scale bars, 50 μm.
Quantification of the immunohistochemical staining in (J) showed a positive correlation of ATF4 and YAP expression (N = 18). Statistical significance was calculated using Pearson correlation analysis.
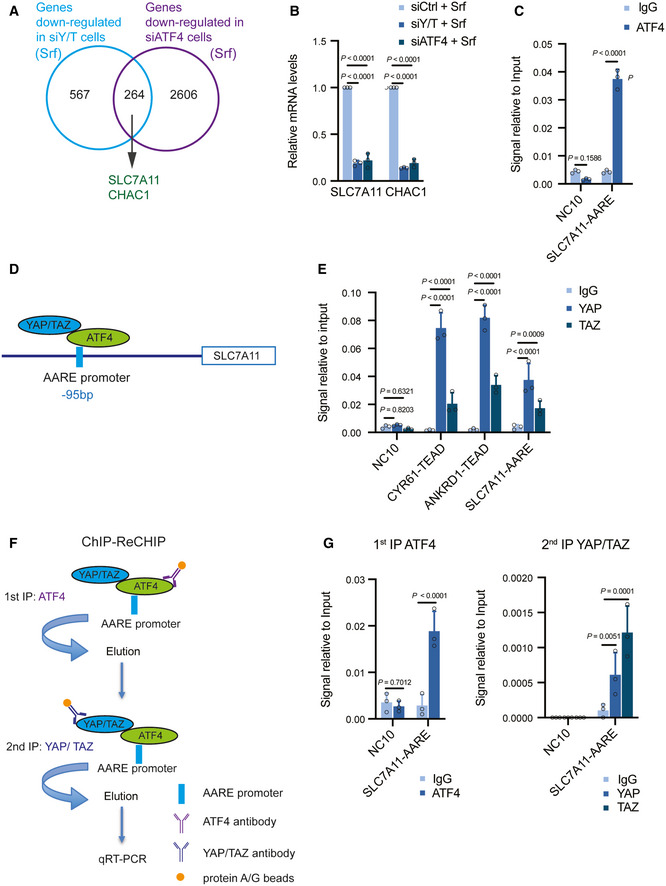
A total of 264 common genes were identified downregulated by both deficiency for YAP/TAZ and deficiency for ATF4, among which were known ATF4 targets, such as SLC7A11 and CHAC1. HLE cells were transfected with siCtrl, siYAP/TAZ, or siATF4 and cultured with 6 μM Sorafenib for 18 h and RNA was subjected to next‐generation RNA sequencing. Venn diagram analysis was conducted using VENNY 2.1.0.
Quantitative RT‐PCR analysis verified that depletion of YAP/TAZ or ATF4 declined the expression levels of SLC7A11 and CHAC1. HLE cells were transfected with siCtrl, siY/T, or siATF4 and cultured with 6 μM Sorafenib for 18 h. Quantitative RT‐PCR was conducted to determine SLC7A11 and CHAC1 mRNA levels. Data are shown as mean ± standard deviation (SD). Statistical significance was calculated using two‐way ANOVA. Results represent 3 independent experiments.
Binding of ATF4 to DNA fragments containing the AARE binding motif in the promoters of SLC7A11 and ATF3. ChIP was performed on HLE cell lysate with antibodies against ATF4 and rabbit IgG as control. DNA fragments were amplified using the primers specific for AARE binding motif in the SLC7A11 promoter region. The non‐coding region NC10 served as negative control. Data are shown as mean ± standard deviation (SD). Statistical significance was calculated using one‐way ANOVA. Results represent three independent experiments.
Schematic representation of the ATF4 binding motif AARE located at – 95 bp of the SLC7A11 promoter region. YAP/TAZ were predicted to interact with ATF4 binding to the AARE binding motif in the promoter of SLC7A11.
Binding of YAP and TAZ to DNA fragments containing the AARE binding motif in the SLC7A11 promoter. ChIP was performed on HLE cell lysate with antibodies against YAP and TAZ and rabbit IgG as control. DNA fragments were amplified using the primers specific for AARE binding motif in the SLC7A11 promoter region. The non‐coding region NC10 served as negative control, and the bona fide TEAD target genes CYR61 and ANKRD1 served as positive controls. Data are shown as mean ± standard deviation (SD). Statistical significance was calculated using one‐way ANOVA. Results represent three independent experiments.
Schematic representation of the ChIP‐ReChIP strategy to test whether YAP/TAZ bind to the AARE binding motif within the SLC7A11 promoter via binding to ATF4.
YAP/TAZ bind to DNA fragments containing the AARE binding motif within the SLC7A11 promoter via ATF4. HLE cells were cultured with 6 μM Sorafenib for 18 h before harvest. In a 1st round ChIP ATF4 was immunoprecipitated with antibody against ATF4, rabbit IgG was used as control. DNA‐protein immunocomplexes were eluted and in a 2nd round ChIP antibody against YAP/TAZ was used to precipitate DNA fragments which were then amplified and analyzed by quantitative PCR for the AARE motif in the SLC7A11 promoter. NC10 served as negative PCR control. Data are shown as mean ± standard deviation (SD). Statistical significance was calculated using one‐way ANOVA. Results represent three independent experiments.
- A
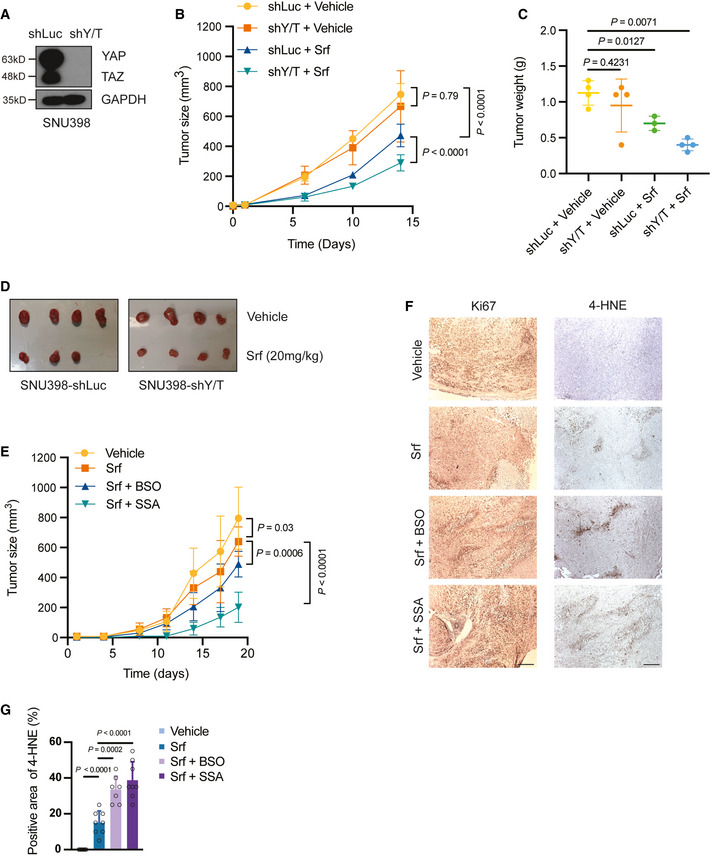
Establishment of a YAP/TAZ‐deficient SNU398 cell line. SNU398 cells were infected with lentivirus to stably express either shLuc as control or shYAP/TAZ. Immunoblotting illustrated the loss of YAP/TAZ expression. GAPDH served as loading control.
- B–D
Combination of YAP/TAZ deficiency and Sorafenib treatment suppressed tumor growth in a HCC xenograft model. SNU398‐shLuc or SNU398‐shYAP/TAZ (shY/T) cells were transplanted into the flanks of immunodeficient NSG mice. Once the tumors were palpable, mice were treated with 20 mg/kg Sorafenib or vehicle control, and tumor sizes were measured twice a week (B). Tumor weights and sizes were also recorded after sacrifice of the mice (C,D). Data are shown as mean ± standard deviation (SD). Statistical significance was calculated using two‐way ANOVA. Mouse numbers of shLuc + Vehicle, shY/T + Vehicle, and shY/T + Srf were 4 per cohort, mouse numbers of shLuc + Srf were 3 per cohort.
- E
Pharmacological inhibition of glutathione synthesis and function sensitizes HCC tumors to Sorafenib therapy. SNU398 cells were transplanted into the flanks of immunodeficient NSG mice. Once the tumors were palpable, mice were treated with vehicle control or with 20 mg/kg Sorafenib alone, or with 20 mg/kg Sorafenib and 20 mM BSO in the drinking water or 120 mg/kg SSA per os. Tumor sizes were measured twice a week. Data are shown as mean ± standard deviation (SD). Statistical significance was calculated using two‐way ANOVA. Mouse numbers were 8 for the experimental cohorts Vehicle, Srf, and Srf + SSA and 7 for Srf + BSO.
- F
Representative pictures of immunohistochemical staining of Ki67 and 4‐HNE in tissue sections taken from HCC tumors of the mice treated as described in (E). Ki67 is a marker for cell proliferation, while 4‐HNE is a marker of lipid peroxidation and ferroptosis. Scale bars, 50 μm.
- G
Quantification of 4‐HNE‐positive cells of the immunohistochemical stainings described in (F). Data are shown as mean ± standard deviation (SD). Statistical significance was calculated using one‐way ANOVA. Each data point represents the average of three technical replicates of one histological section, the numbers of tumor samples are given in (E).
References
-
- Andreozzi M, Quintavalle C, Benz D, Quagliata L, Matter M, Calabrese D, Tosti N, Ruiz C, Trapani F, Tornillo L et al (2016) HMGA1 expression in human hepatocellular carcinoma correlates with poor prognosis and promotes tumor growth and migration in in vitro models. Neoplasia 18: 724–731 - PMC - PubMed
Publication types
MeSH terms
Substances
LinkOut - more resources
Full Text Sources
Medical
Molecular Biology Databases
Research Materials
