. 2021 Oct;10(12):e12159.
doi: 10.1002/jev2.12159.

Visualizing transfer of microbial biomolecules by outer membrane vesicles in microbe-host-communication in vivo

Affiliations

Visualizing transfer of microbial biomolecules by outer membrane vesicles in microbe-host-communication in vivo

Miriam Bittel et al. J Extracell Vesicles. 2021 Oct.

Abstract

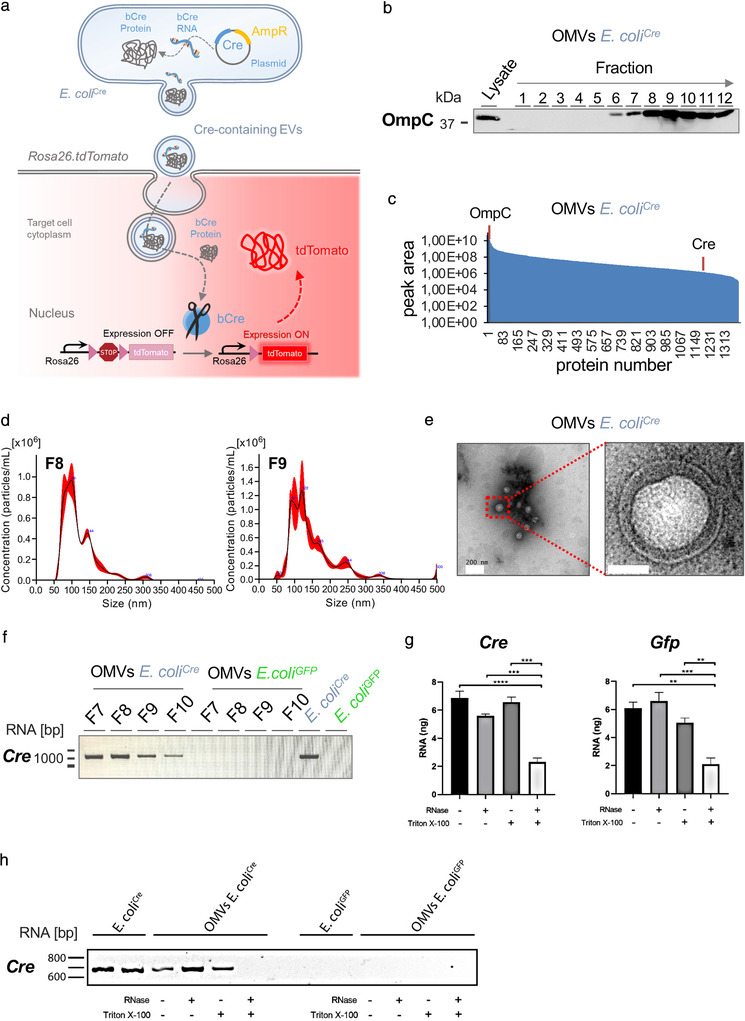
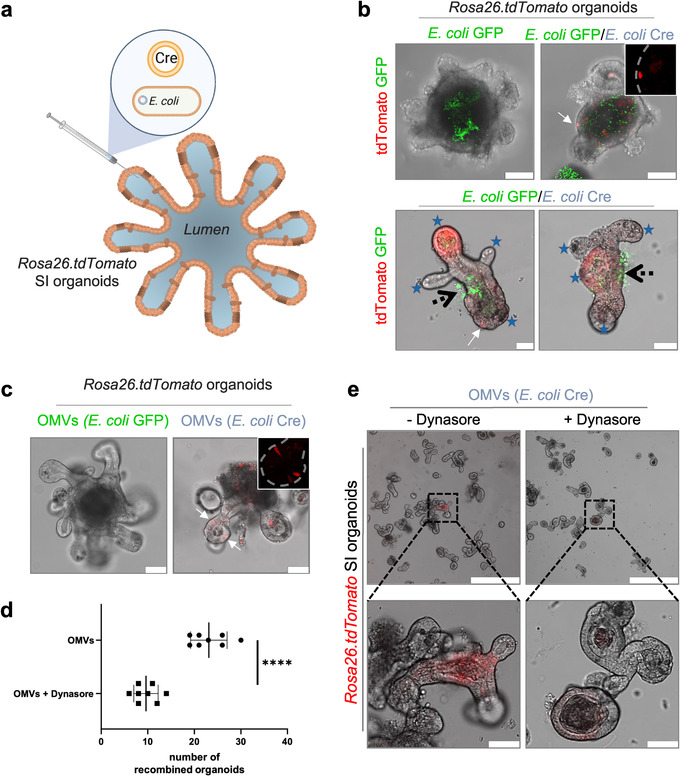
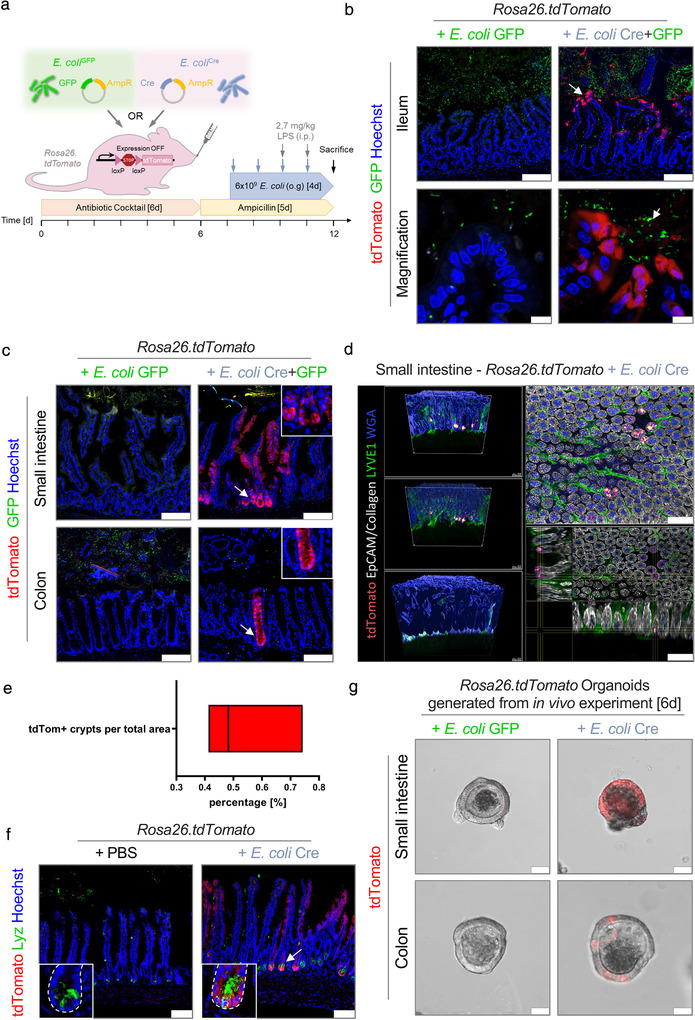
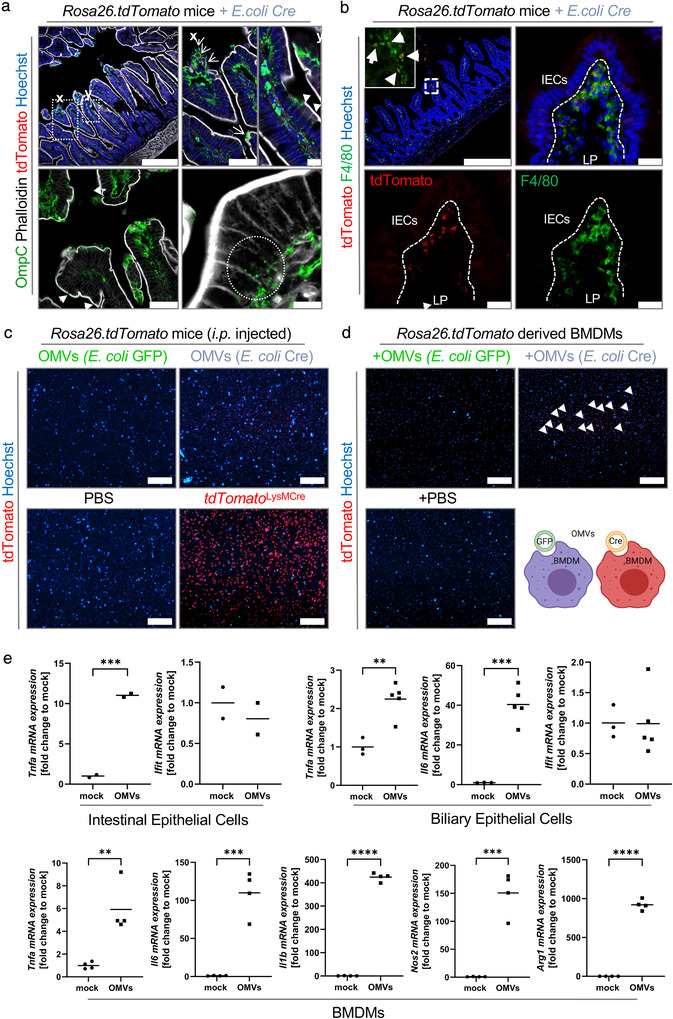
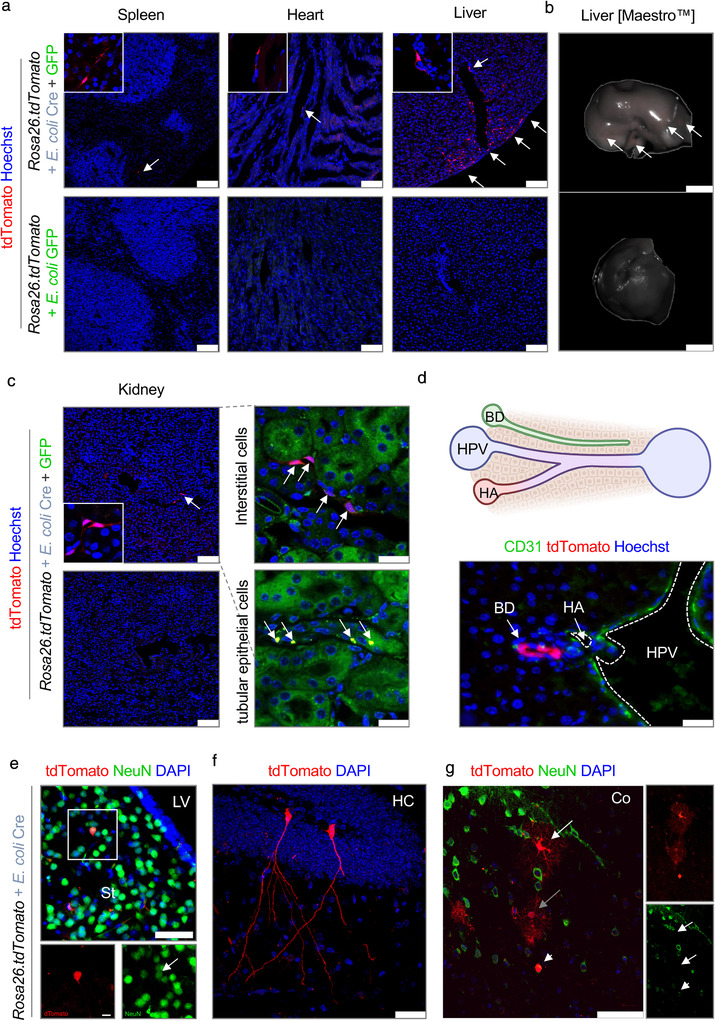
The intestinal microbiota influences mammalian host physiology in health and disease locally in the gut but also in organs devoid of direct contact with bacteria such as the liver and brain. Extracellular vesicles (EVs) or outer membrane vesicles (OMVs) released by microbes are increasingly recognized for their potential role as biological shuttle systems for inter-kingdom communication. However, physiologically relevant evidence for the transfer of functional biomolecules from the intestinal microbiota to individual host cells by OMVs in vivo is scarce. By introducing Escherichia coli engineered to express Cre-recombinase (E. coliCre ) into mice with a Rosa26.tdTomato-reporter background, we leveraged the Cre-LoxP system to report the transfer of bacterial OMVs to recipient cells in vivo. Colonizing the intestine of these mice with E. coliCre , resulted in Cre-recombinase induced fluorescent reporter gene-expression in cells along the intestinal epithelium, including intestinal stem cells as well as mucosal immune cells such as macrophages. Furthermore, even far beyond the gut, bacterial-derived Cre induced extended marker gene expression in a wide range of host tissues, including the heart, liver, kidney, spleen, and brain. Together, our findings provide a method and proof of principle that OMVs can serve as a biological shuttle system for the horizontal transfer of functional biomolecules between bacteria and mammalian host cells.

Keywords: Cre-Loxp; extracellular vesicles; inflammation; intestinal stem cells; microbiome; outer membrane vesicles.


Conflict of interest statement

Authors declare no conflict of interest.

Figures

FIGURE 1
FIGURE 1
Characterization of OMVs. (a) Graphical illustration of bacterial OMVs transferring their molecular cargo to mammalian host cells. E. coli Cre‐derived OMVs containing Cre RNA or protein are taken up by host cells of Rosa26.tdTomato reporter mice, leading to Cre‐mediated excision of the loxP‐flanked STOP cassette, thereby inducing expression of robust tdTomato fluorescence (red). (b) Western blot analysis using 37,5 μl of each fraction derived from iodixanol density gradient purification as well as bacterial lysates (5 μg) of E. coli Cre. The membrane was probed with an antibody against OmpC (37 kDa). (c) Dynamic range of OMV contained proteins analyzed by mass spectrometry, relative quantity of OmpC and Cre are indicated by orange lines. (d) Representative NTA analysis of fraction 8 and 9 of iodixanol density gradient purified E. coli Cre OMVs. (e) Transmission electron microscopic image of OMV preparation isolated from E. coli Cre culture supernatant showing membranous particles confirming the presence of small OMVs. Scale Bar: 200 nm and 50 nm. (f) RT‐PCR analysis of full length Cre RNA from fractions F7 to F10 of iodixanol density gradient purified OMVs and whole bacterial lysates from E. coli Cre and E. coli GFP. (g) Isolated OMVs (OMVs E. coli Cre and OMVs E. coli GFP) were left unchallenged or treated with RNAse or Triton X‐100 or a combination of the two. RNA concentration was measured by Quant‐iT RiboGreen RNA Assay. (h) RT‐PCR analysis of Cre RNA from whole bacterial lysates and iodixanol density gradient purified OMVs (from E. coli Cre and E. coli GFP) left unchallenged or treated with RNAse, Triton X‐100 or a combination of both.
FIGURE 2
FIGURE 2
OMV uptake by intestinal epithelial cells. (a) Experimental set up of in vitro experiments. Organoids received either 4*104 bacteria or 4*105 OMVs via microinjection. (b) Small intestinal organoids derived from Rosa26.tdTomato mice were microinjected with E. coli GFP (left, Green) or E. coli Cre plus E. coli GFP (right, Green 1:1 dilution). Pictures were taken 8 (upper panel) or 20 (lower panel) hours post injection. Successful transfer of bacterial Cre to host cells is traceable by tdTomato‐positivity (red). Scale Bar: 50 μm. Inset: Higher magnification of tdTomato‐positive signal only (red). Experiments were repeated three times with similar results. Stars mark crypt region, black arrows label side of microinjection, white arrow marks individual tdTomato positive epithelial cell. (c) Representative confocal pictures of small intestinal organoids (Rosa26.tdTomato) microinjected with OMVs derived from E. coli GFP (left) or E. coli Cre (right). Confocal images were taken 8 hours after microinjection. Experiments were repeated three times with similar results. (d) Quantification and (e) representative confocal images of small intestinal organoids derived from Rosa26.tdTomato mice after microinjection with purified OMVs (E. coli Cre) cultured in the absence (‐Dynasore) or presence (+Dynasore) of the dynamin GTPase inhibitor Dynasore. The data are depicted as the mean of the number of organoids that displayed tdTomato positive cells (independent of intensity). The dot plots depict the mean of one analysed culture [with 100 microinjections] and the whiskers min–max values. ****P < 0.0001. Data are derived from two independent experiments.
FIGURE 3
FIGURE 3
In vivo transfer of bacterial Cre to mucosal host cells. (a) Experimental set up of in vivo experiments. (b+c) Representative data derived from the intestinal tissue of Rosa26.tdTomato mice treated with either E. coli Cre plus E. coli GFP (n = 9) or with E. coli GFP only (n = 5). Experiments were performed in three independent experiments with similar results. (b) Representative confocal images of small intestinal (Ileum) cryo‐cross sections showing tdTomato‐positive epithelial cells (red) and E. coli GFP (green). Nuclei counterstaining with Hoechst (blue). Scale bar: 100 μm; Magnification, Scale bar: 10 μm. (c) Representative images of small intestinal and colonic cross‐sections demonstrating tdTomato‐positive cells (red) and E. coli GFP (green). Inset: Higher magnification of the stem cell region. Nuclei counterstaining with Hoechst (blue). Scale bar: 100 μm. (d) Volumetric reconstruction images of Rosa26.tdTomato intestinal mucosa treated with E. coli Cre showing red‐to‐white gradient with tdTomato signal in crypts (red), as well as collagen (SHG; grey), epithelial cells (EpCAM; grey), LYVE1 (green), and WGA (blue). Total analysis of 10,000 ileal crypts derived from Rosa26.tdTomato mice treated with E. coli Cre (n = 3). Scale bar: 100 μm. (e) Quantification of tdTomato‐positive crypts per sample area. (f) Representative immunohistochemical images of small intestinal (Ileum) cryo‐cross sections of Rosa26.tdTomato mice treated with E. coli Cre or PBS as control. Confocal pictures visualized tdTomato‐positive cells (red) and staining against Paneth cells (Lyz, Green). Nuclei counterstaining with Hoechst (blue). Scale bar: 100 μm. (g) Representative confocal images of organoids derived from the small and large intestine of Rosa26.tdTomato mice colonized with E. coli Cre (right) or as a control E. coli GFP (left) 6 days after isolation. Scale Bar: 50 μm. Experiments were repeated three times with similar results
FIGURE 4
FIGURE 4
OMV uptake within the gut mucosa. (a) Representative confocal images of small intestinal (Ileum) cryo‐cross sections derived from Rosa26.tdTomato mice that received E. coli Cre and LPS stained with an antibody against OmpC to visualize OMVs and Phalloidin to stain actin filaments. Nuclei counterstaining with Hoechst (blue). Scale bar: 250 μm; Magnification, Scale bar: 75 μm and 10 μm. Arrows point towards damaged surface epithelium, arrow heads point towards OMVs within epithelial cells and at the apical surface of goblet cells. (b) Representative confocal images of small intestinal (Ileum) cryo‐cross sections derived from Rosa26.tdTomato mice that received E. coli Cre (+LPS) showing tdTomato positive macrophages. Nuclei counterstaining with Hoechst (blue). Scale bar: 250 μm; Magnification, Scale bar: 50 μm. Arrows point towards tdTomato positive macrophages. (c) Representative microscopic pictures of peritoneal macrophages isolated from Rosa26.tdTomato mice i.p. injected with 2*109 particles of OMVs purified from E. coli Cre or E. coli GFP or mice treated with PBS (negative control) or isolated from Rosa26.tdTomatoxLysMCre (positive control). Nuclei counterstaining with Hoechst (blue). Scale bar: 100 μm. (d+e) Cell cultures were treated with 2*109OMVs/ml. (d) Representative pictures of peritoneal macrophages isolated from Rosa26.tdTomato mice cultured in the presence of isolated OMVs (E. coli Cre or E. coli GFP) or treated with PBS as control. Nuclei counterstaining with Hoechst (blue). Scale bar: 100 μm. (e) mRNA expression of indicated genes in intestinal epithelial cells (2D monolayer derived from murine small intestinal organoids), biliary epithelial cells (2D monolayer derived from murine liver ductal organoids) and BMDMs cultured for 8 h in the absence (mock) or presence of OMVs. Gene expression levels are shown relative to Gapdh. ****P < 0.0001, ***P < 0.001, **P < .01
FIGURE 5
FIGURE 5
Bacterial OMVs transfer functional Cre mRNA to multiple organs. (a–g) Representative data derived from different organ tissue of Rosa26.tdTomato mice treated with either E. coli Cre plus E. coli GFP (n = 9) or with E. coli GFP only (n = 5). Experiments were repeated 3 times with similar results. (a) Representative confocal images of different organ cross sections of spleen, heart and liver showing tdTomato‐positive cells (red). Nuclei counterstaining with Hoechst (blue). Scale bar: 100 μm. (b) Representative Maestro ex vivo images of the liver of Rosa26.tdTomato mice treated with E. coli Cre (plus E. coli GFP) or E. coli GFP as control analyzed via multi‐spectral separation. Scale bar: 50 mm. (c) Representative confocal images of kidney cross‐sections showing tdTomato‐positive cells (red). Tubular epithelium shown in green. Nuclei counterstaining with Hoechst (blue). Scale bar: 100 μm. (d) Representative pictures of tdTomato positive biliary epithelial cells in liver cross sections. Scale bar: 50 μM. Arrows point towards tdTomato‐positive cells. HPV: hepatic portal vein; HA: hepatic artery; BD: bile duct. Scale bar: 25 μm. (e‐g) Representative confocal images of immunohistochemical staining of brain cross‐section showing tdTomato‐positive cells (red) and staining against NeuN (e,g) (Green, Neuron). Nuclei counterstaining with DAPI (blue). Scale bar: 50 μm (Upper image), 10 μm (Lower image). LV: lateral ventricles; St: striatum; HC: hippocampus; Co: cortex

References

    1. Albillos, A. , de Gottardi, A. , & Rescigno, M. (2020). The gut‐liver axis in liver disease: Pathophysiological basis for therapy. Journal of Hepatology 72, 558–577. - PubMed
    1. Barbier, M. , & Mittar, D. (2014). Novel fluorescent reporters for studying host‐pathogen interactions. ATCC Application Note.1–6.
    1. Barker, N. , van Es, J. H. , Kuipers, J. , Kujala, P. , van den Born, M. , Cozijnsen, M. , Haegebarth, A. , Korving, J. , Begthel, H. , Peters, P. J. , & Clevers, H. (2007). Identification of stem cells in small intestine and colon by marker gene Lgr5. Nature 449, 1003–1007. - PubMed
    1. Becker, C. , Wirtz, S. , Blessing, M. , Pirhonen, J. , Strand, D. , Bechthold, O. , Frick, J. , Galle, P. R. , Autenrieth, I. , & Neurath, M. F. (2003). Constitutive p40 promoter activation and IL‐23 production in the terminal ileum mediated by dendritic cells. Journal of Clinical Investigation 112, 693–706. - PMC - PubMed
    1. Belkaid, Y. , & Hand, T. W. (2014). Role of the microbiota in immunity and inflammation. Cell 157, 121–141. - PMC - PubMed

Publication types

MeSH terms

Substances

LinkOut - more resources