Meta-Analysis
. 2022 Jan;302(1):88-104.
doi: 10.1148/radiol.2021210391. Epub 2021 Oct 19.

Machine Learning for Workflow Applications in Screening Mammography: Systematic Review and Meta-Analysis

Affiliations
Meta-Analysis

Machine Learning for Workflow Applications in Screening Mammography: Systematic Review and Meta-Analysis

Sarah E Hickman et al. Radiology. 2022 Jan.

Abstract

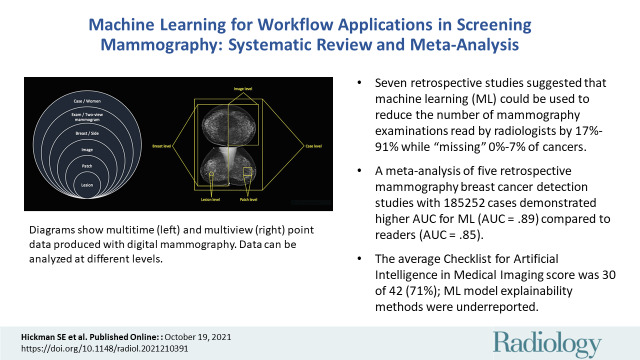
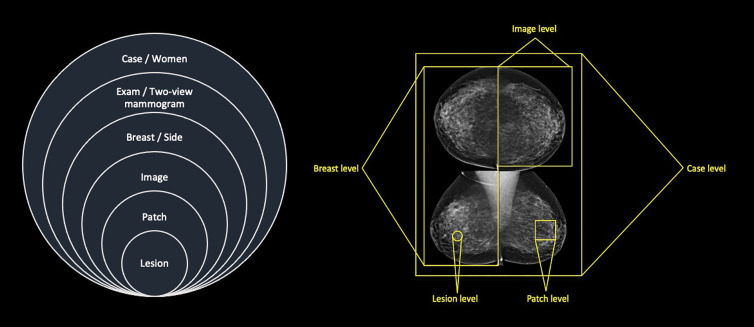
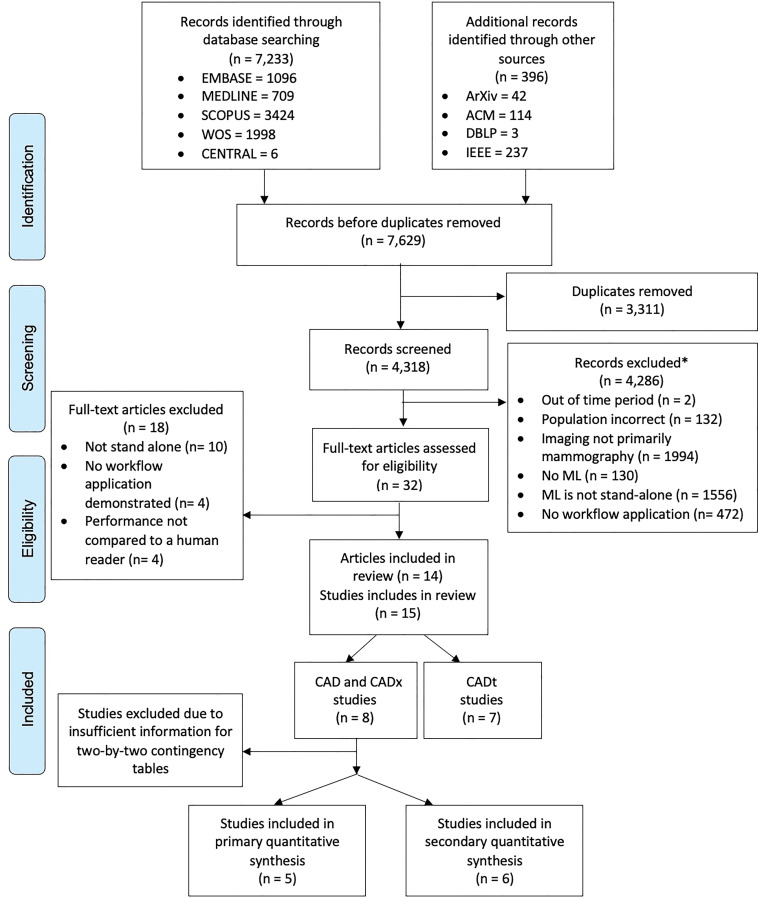
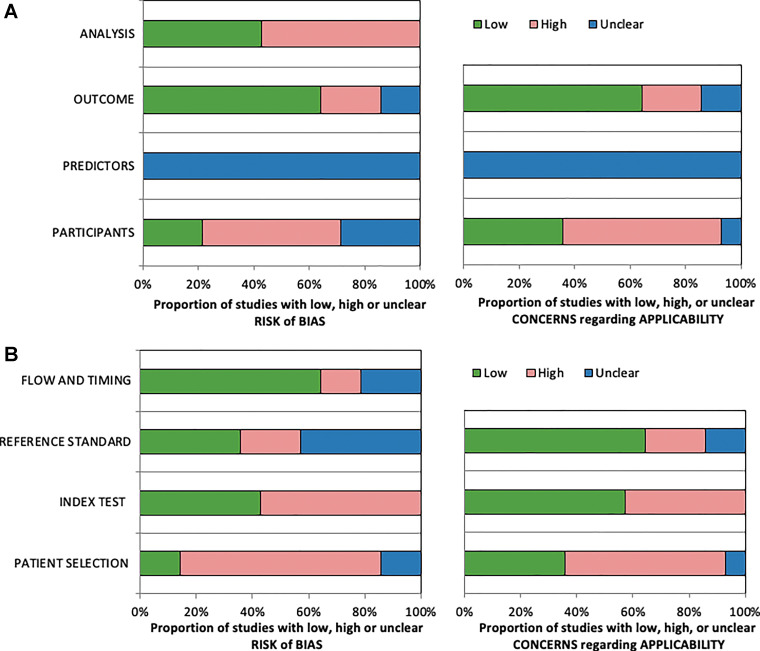
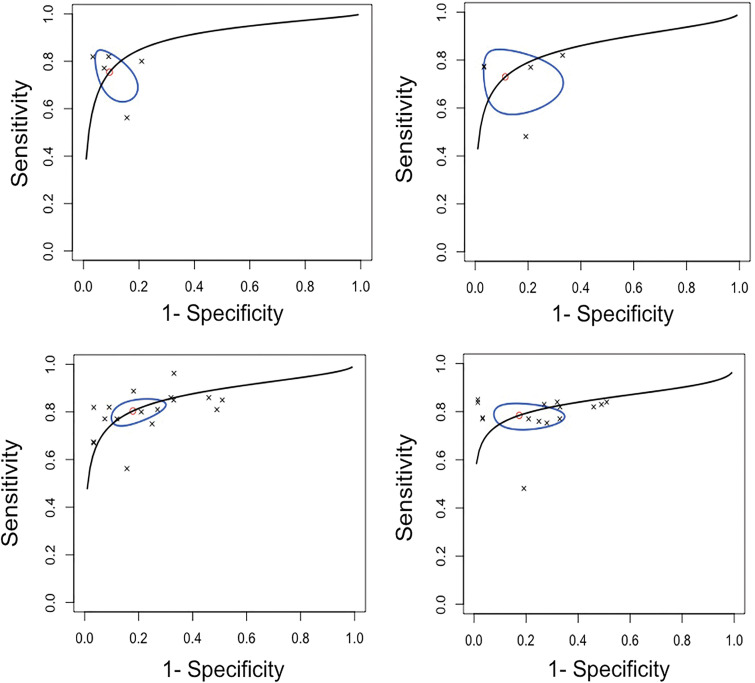
Background Advances in computer processing and improvements in data availability have led to the development of machine learning (ML) techniques for mammographic imaging. Purpose To evaluate the reported performance of stand-alone ML applications for screening mammography workflow. Materials and Methods Ovid Embase, Ovid Medline, Cochrane Central Register of Controlled Trials, Scopus, and Web of Science literature databases were searched for relevant studies published from January 2012 to September 2020. The study was registered with the PROSPERO International Prospective Register of Systematic Reviews (protocol no. CRD42019156016). Stand-alone technology was defined as a ML algorithm that can be used independently of a human reader. Studies were quality assessed using the Quality Assessment of Diagnostic Accuracy Studies 2 and the Prediction Model Risk of Bias Assessment Tool, and reporting was evaluated using the Checklist for Artificial Intelligence in Medical Imaging. A primary meta-analysis included the top-performing algorithm and corresponding reader performance from which pooled summary estimates for the area under the receiver operating characteristic curve (AUC) were calculated using a bivariate model. Results Fourteen articles were included, which detailed 15 studies for stand-alone detection (n = 8) and triage (n = 7). Triage studies reported that 17%-91% of normal mammograms identified could be read by adapted screening, while "missing" an estimated 0%-7% of cancers. In total, an estimated 185 252 cases from three countries with more than 39 readers were included in the primary meta-analysis. The pooled sensitivity, specificity, and AUC was 75.4% (95% CI: 65.6, 83.2; P = .11), 90.6% (95% CI: 82.9, 95.0; P = .40), and 0.89 (95% CI: 0.84, 0.98), respectively, for algorithms, and 73.0% (95% CI: 60.7, 82.6), 88.6% (95% CI: 72.4, 95.8), and 0.85 (95% CI: 0.78, 0.97), respectively, for readers. Conclusion Machine learning (ML) algorithms that demonstrate a stand-alone application in mammographic screening workflows achieve or even exceed human reader detection performance and improve efficiency. However, this evidence is from a small number of retrospective studies. Therefore, further rigorous independent external prospective testing of ML algorithms to assess performance at preassigned thresholds is required to support these claims. ©RSNA, 2021 Online supplemental material is available for this article. See also the editorial by Whitman and Moseley in this issue.


Conflict of interest statement

Disclosures of conflicts of interest: S.E.H. research collaborations with Merantix, ScreenPoint, Volpara, and Lunit. R.W. employee of University of Cambridge. E.P.V.L. no relevant relationships. Y.R.I. no relevant relationships. C.M.L. no relevant relationships. A.I.A.R. no relevant relationships. G.C.B. no relevant relationships. J.W.M. employee of Astra Zeneca. F.J.G. funding from Lunit; consultant for Alphabet and Kheiron; payment or honoraria for lectures, presentations, speakers bureaus, manuscript writing, or educational events from GE Healthcare; president of European Society of Breast Imaging; equipment, materials, drugs, medical writing, gifts, or other services from GE Healthcare, Bayer, Lunit, and ScreenPoint.

Figures

None
Graphical abstract
Diagrams show multitime (left) and multiview (right) point data produced
with two-dimensional standard view mammography. Data can be analyzed at
different levels.
Figure 1:
Diagrams show multitime (left) and multiview (right) point data produced with two-dimensional standard view mammography. Data can be analyzed at different levels.
Flowchart of Preferred Reporting Items for Systematic Review and
Meta-Analysis for Diagnostic Test Accuracy for studies included in
identification, de-duplication, screening, and data-extraction stages of
review. ACM = Association for Computing Machinery, CAD = computer-aided
detection, CADt = computer-aided triage, CADx = computer-aided diagnosis,
IEEE = Institute of Electrical and Electronics Engineers, ML = machine
learning, WOS = Web of Science. * = Studies could have been excluded
for multiple reasons.
Figure 2:
Flowchart of Preferred Reporting Items for Systematic Review and Meta-Analysis for Diagnostic Test Accuracy for studies included in identification, de-duplication, screening, and data-extraction stages of review. ACM = Association for Computing Machinery, CAD = computer-aided detection, CADt = computer-aided triage, CADx = computer-aided diagnosis, IEEE = Institute of Electrical and Electronics Engineers, ML = machine learning, WOS = Web of Science. * = Studies could have been excluded for multiple reasons.
Stacked bar charts show summary results of included articles assessed
with (A) Prediction Model Risk of Bias Assessment Tool and (B) Quality
Assessment of Diagnostic Accuracy Studies 2 assessment. For 14 included
articles, each category is represented as percentage of number of articles
that have high, low, or unclear levels of bias and applicability.
Figure 3:
Stacked bar charts show summary results of included articles assessed with (A) Prediction Model Risk of Bias Assessment Tool and (B) Quality Assessment of Diagnostic Accuracy Studies 2 assessment. For 14 included articles, each category is represented as percentage of number of articles that have high, low, or unclear levels of bias and applicability.
Stacked bar chart of Checklist for Artificial Intelligence in Medical
Imaging (CLAIM) assessment. Results for 14 articles included in this review
across eight key categories identified from checklist are shown. Score of 1
was given if complete information was provided, and score of 0 was given
where no information was provided. X-axis indicates percentage of articles
in review that included information about eight key categories detailed in
y-axis.
Figure 4:
Stacked bar chart of Checklist for Artificial Intelligence in Medical Imaging (CLAIM) assessment. Results for 14 articles included in this review across eight key categories identified from checklist are shown. Score of 1 was given if complete information was provided, and score of 0 was given where no information was provided. X-axis indicates percentage of articles in review that included information about eight key categories detailed in y-axis.
(A, B) Summary receiver operating characteristic (sROC) curves in (A)
five studies for included algorithm and (B) reader results reported for
top-performing machine learning algorithm tested on external data set,
compared with reader performance for computer-aided detection and
computer-aided diagnosis applications, with a ground truth of more than 1
year follow-up and histopathologic findings (primary meta-analysis). (C, D)
Summary receiver operating characteristic (sROC) curves for (C) 17
algorithm-reported results and (D) 15 reader-reported results from included
studies for computer-aided detection and computer-aided diagnosis
applications tested externally (secondary meta-analysis). Line represents
summary receiver operating characteristic curve, oval represents 95% CIs,
circle represents summary estimate, and crosses represent individual
results.
Figure 5:
(A, B) Summary receiver operating characteristic (sROC) curves in (A) five studies for included algorithm and (B) reader results reported for top-performing machine learning algorithm tested on external data set, compared with reader performance for computer-aided detection and computer-aided diagnosis applications, with a ground truth of more than 1 year follow-up and histopathologic findings (primary meta-analysis). (C, D) Summary receiver operating characteristic (sROC) curves for (C) 17 algorithm-reported results and (D) 15 reader-reported results from included studies for computer-aided detection and computer-aided diagnosis applications tested externally (secondary meta-analysis). Line represents summary receiver operating characteristic curve, oval represents 95% CIs, circle represents summary estimate, and crosses represent individual results.

Comment in

References

    1. American College of Radiology Data Science Institute. AI Central. https://web.archive.org/web/20211018160712/https:/aicentral.acrdsi.org/. Accessed September 10, 2020.
    1. Sechopoulos I, Mann RM. Stand-alone artificial intelligence - The future of breast cancer screening? Breast 2020;49:254–260. - PMC - PubMed
    1. Le EPV, Wang Y, Huang Y, Hickman S, Gilbert FJ. Artificial intelligence in breast imaging. Clin Radiol 2019;74(5):357–366. - PubMed
    1. Watanabe L. The power of triage (CADt) in breast imaging. Applied Radiology. https://web.archive.org/web/20211018160942/https:/www.appliedradiology.c.... Accessed November 24, 2020.
    1. Schünemann HJ, Lerda D, Quinn C, et al. . Breast cancer screening and diagnosis: A synopsis of the European breast guidelines. Ann Intern Med 2020;172(1):46–56. - PubMed

Publication types