. 2021 Nov 22;6(22):e151463.
doi: 10.1172/jci.insight.151463.

Airway antibodies emerge according to COVID-19 severity and wane rapidly but reappear after SARS-CoV-2 vaccination

Affiliations

Airway antibodies emerge according to COVID-19 severity and wane rapidly but reappear after SARS-CoV-2 vaccination

Alberto Cagigi et al. JCI Insight. .

Abstract

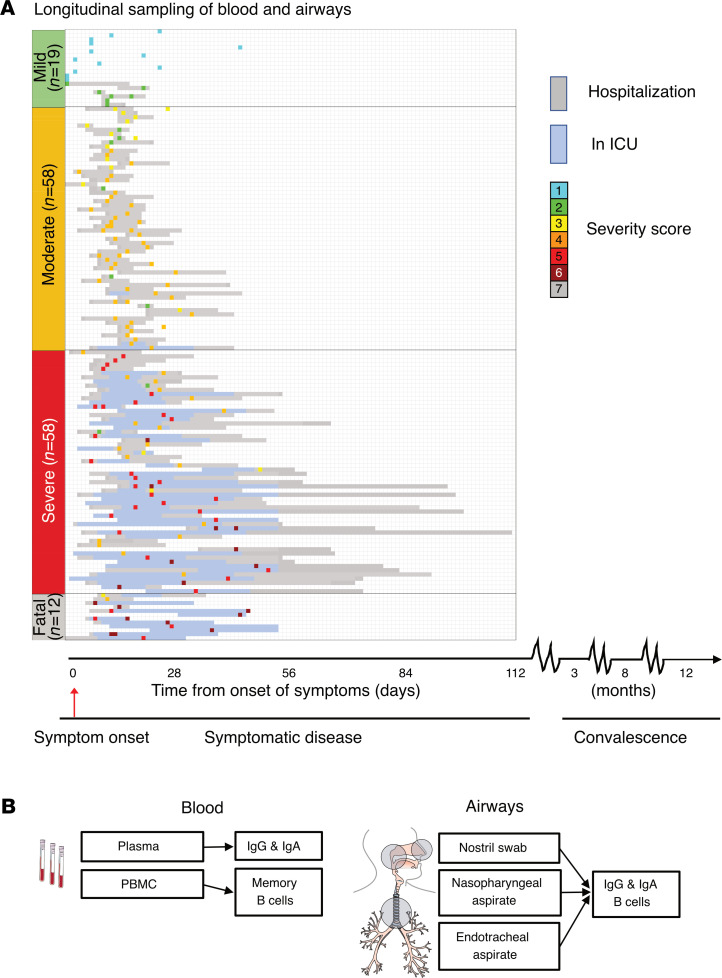
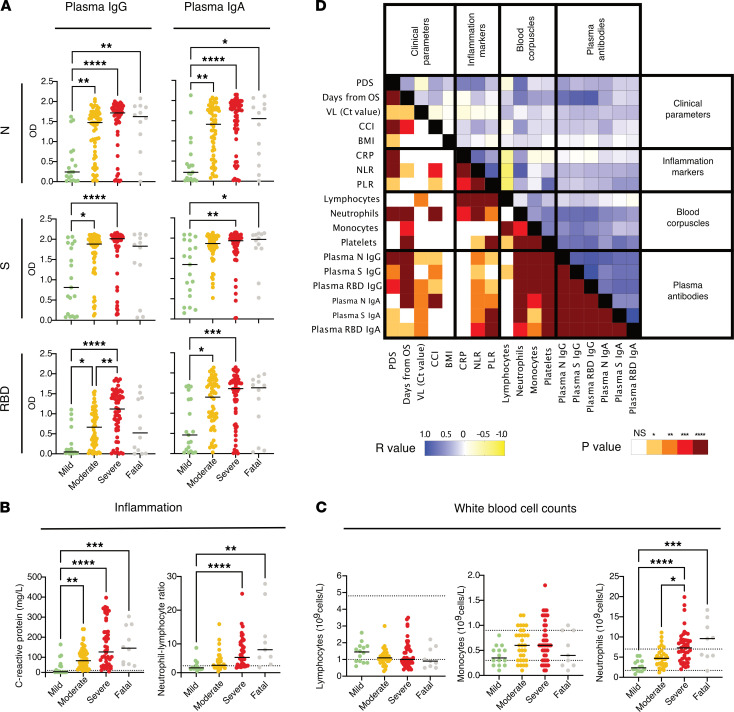
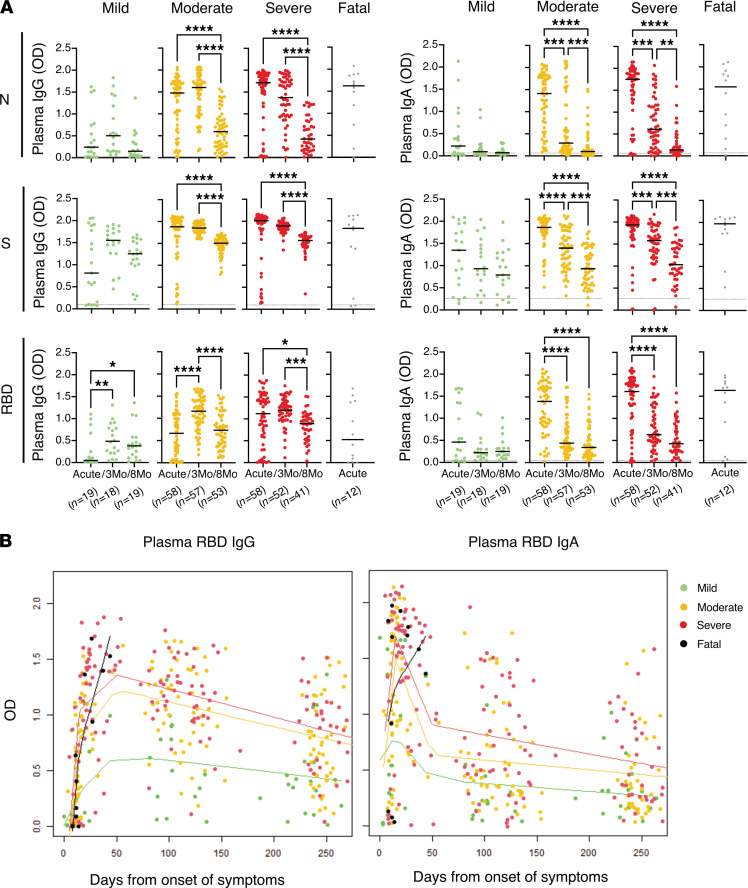
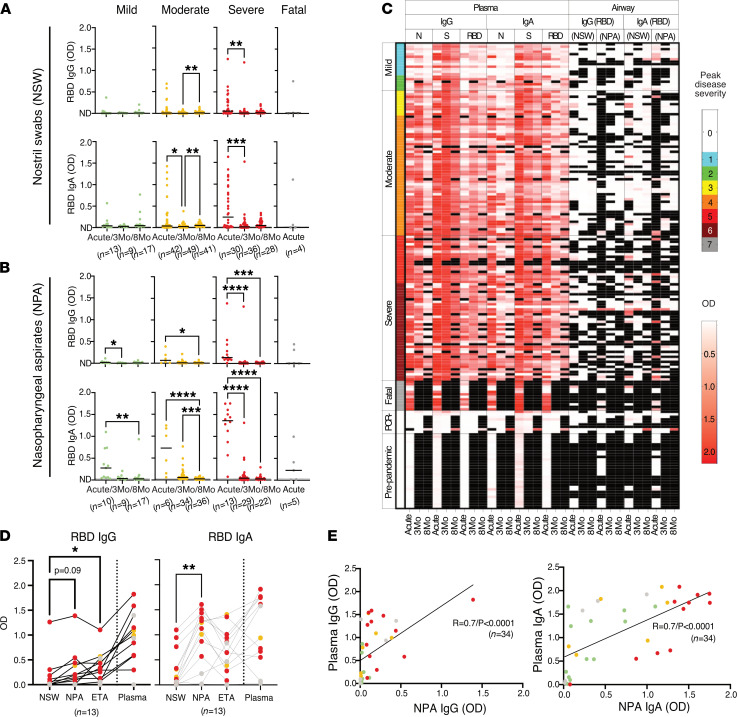
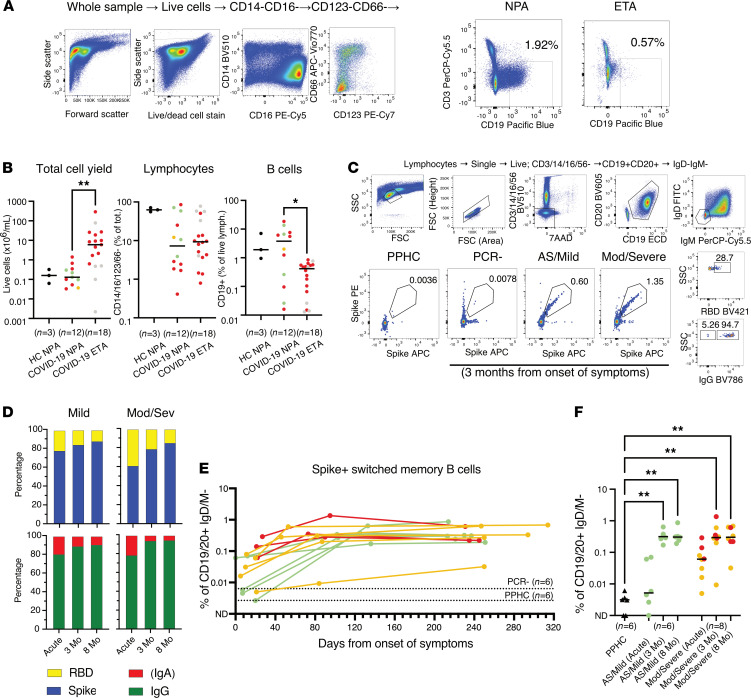
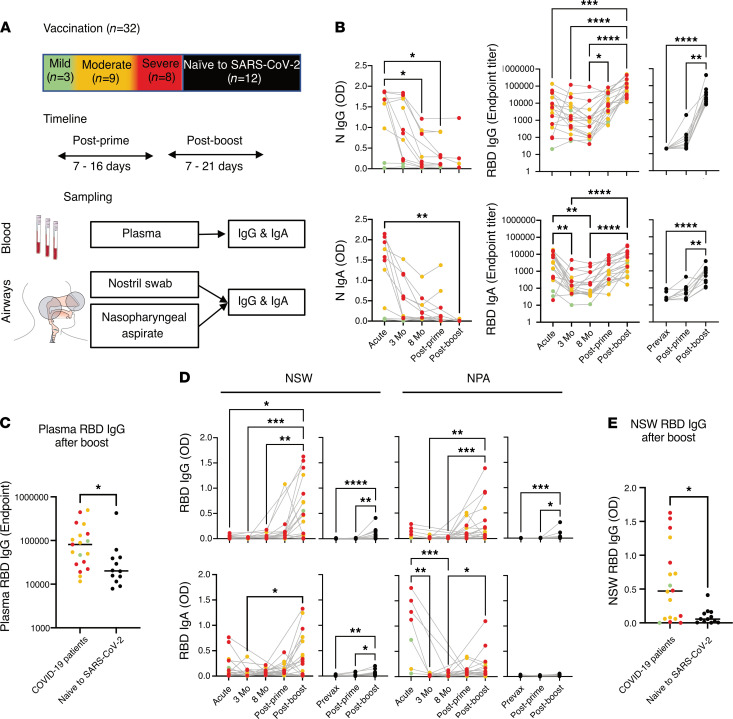
Understanding the presence and durability of antibodies against SARS-CoV-2 in the airways is required to provide insights into the ability of individuals to neutralize the virus locally and prevent viral spread. Here, we longitudinally assessed both systemic and airway immune responses upon SARS-CoV-2 infection in a clinically well-characterized cohort of 147 infected individuals representing the full spectrum of COVID-19 severity, from asymptomatic infection to fatal disease. In addition, we evaluated how SARS-CoV-2 vaccination influenced the antibody responses in a subset of these individuals during convalescence as compared with naive individuals. Not only systemic but also airway antibody responses correlated with the degree of COVID-19 disease severity. However, although systemic IgG levels were durable for up to 8 months, airway IgG and IgA declined significantly within 3 months. After vaccination, there was an increase in both systemic and airway antibodies, in particular IgG, often exceeding the levels found during acute disease. In contrast, naive individuals showed low airway antibodies after vaccination. In the former COVID-19 patients, airway antibody levels were significantly elevated after the boost vaccination, highlighting the importance of prime and boost vaccinations for previously infected individuals to obtain optimal mucosal protection.

Keywords: Adaptive immunity; COVID-19; Immunoglobulins; Immunology; Innate immunity.


Figures

Figure 1
Figure 1. Study and sampling overview.
(A) Overview of study cohort (n = 147), timeline of longitudinal sampling, hospital admission/discharge, level of care, and outcome for each patient. Patients are grouped based on peak disease severity (PDS): mild (PDS 1 and 2), moderate (PDS 3 and 4), severe (PDS 5 and 6), and fatal (PDS 7). Individual inclusion sample for each patient is color-coded based on disease severity at the time of sampling. (B) Overview of the anatomical compartments analyzed and the measurements performed.
Figure 2
Figure 2. Systemic antibody responses, inflammation markers, and other clinical parameters in relation to COVID-19 severity during acute disease.
(A) Plasma IgG and IgA responses (n = 19 for mild, n = 58 for moderate, n = 58 for severe, and n = 12 for fatal) against N, S, and RBD are shown together with the levels of (B) CRP and the NLR as a measure of systemic inflammation and with (C) the levels of lymphocytes, monocytes, and neutrophils. Black lines indicate medians. Differences were assessed using Kruskal-Wallis with Dunn’s multiple comparisons test and considered statistically significant at P < 0.05. *P < 0.05, **P < 0.01, ***P < 0.001, ****P < 0.0001. The dashed lines indicate the normal thresholds or range values. (D) Correlation matrix summarizing the interrelationship observed between the clinical parameters, inflammation markers, blood corpuscles, and data from systemic antibody levels measured during acute disease as indicated. The P and R values (Spearman) are shown separately in the mirrored halves of the matrix and have been color-coded as indicated.
Figure 3
Figure 3. Longitudinal systemic antibody responses across COVID-19 severity from acute disease up to 8 months from symptom onset.
(A) Individual levels of plasma IgG and IgA (from left to right) in SARS-CoV-2–infected individuals (n = 147) with different PDS. Black lines indicate medians and dotted lines indicate the average background level from prepandemic healthy controls. Kruskal-Wallis with Dunn’s multiple comparisons was used to compare the groups and considered statistically significant at P < 0.05. *P < 0.05, **P < 0.01, ***P < 0.001, ****P < 0.0001. (B) Splines graphs of the plasma RBD IgG and IgA level changes over time (n = 19 for mild, n = 58 for moderate, n = 58 for severe, and n = 12 for fatal). All observations are graphed together with kernel-smoothed curves, and data points for each group color-coded as previously with the exception of the “fatal” group, which in this figure is highlighted in black. The bandwidth for the smoothing was set to 40, except for the “fatal” group, for which, due to few and concentrated observations, the bandwidth was set to 10.
Figure 4
Figure 4. Longitudinal airway antibody responses to RBD across COVID-19 severity from acute disease up to 8 months from symptom onset.
Levels of IgG and IgA against RBD in (A) NSWs and (B) NPAs. The black lines indicate median values. Kruskal-Wallis with Dunn’s multiple comparisons was used to compare the groups and considered statistically significant at P < 0.05. *P < 0.05, **P < 0.01, ***P < 0.001, ****P < 0.0001. In A the line overlaps with not detected (ND) for IgG levels. (C) Heatmap generated grouping patients according to PDS showing acute and convalescent IgG and IgA titers against N, S, and RBD (plasma) and RBCs (NSWs, NPAs, and ETAs) for each patient. The heatmap includes data from patients (n = 147) and also data from PPHCs (n = 30) and PCR individuals (n = 9) (indicated with PDS 0). Missing data and unavailable samples are shown in black. (D) Comparison of the levels of RBD IgG/A in patient-matched NSWs, NPAs, ETAs, and plasma collected at the same time point. The black lines connect data points from the same individuals. Friedman’s test with Dunn’s multiple comparisons test was used to compare the groups and considered statistically significant at P < 0.05. *P < 0.05, **P < 0.01. (E) Spearman correlation for NPAs (n = 34) versus plasma immunoglobulins against the RBD during acute disease.
Figure 5
Figure 5. Assessment of frequencies of B cells in the respiratory tract and of circulating S-specific memory B cells.
(A) Representative example with gating strategy for the identification of lymphocytes (identified as negative for CD14/16/123/66) and of total B cells (CD3CD19+) in respiratory NPA and ETA samples. (B) Lymphocytes and total B cells in NPAs and ETAs in a subset of patients alongside NPAs from healthy controls. Kruskal-Wallis with Dunn’s multiple comparisons test was used and considered statistically significant at P < 0.05. *P < 0.05, **P < 0.01. (C) Representative examples with gating strategy of SARS-CoV-2 S-specific memory B cells from 1 PPHC and 3-month follow-up samples from 1 SARS-CoV-2 PCR individual and 1 mild and 1 moderate/severe COVID-19 patient. Further characterization of S-positive memory B cells on RBD binding and B cell isotype (IgG+ or IgA+ assumed to correspond to IgDIgMIgG B cells). (D) Bar charts show the cumulative proportion (frequency) of S- (blue) and RBD- (yellow) specific memory B cells as well as the proportion of IgG (green) versus IgA (red) isotypes among the S-specific memory B cells in longitudinal samples from mild (n = 6) and moderate/severe (n = 8) COVID-19 patients. (E) Frequencies of S-specific memory B cells in matched acute and 3-month follow-up PBMCs in relation to days in the subset of individuals analyzed (n = 14) color-coded according to PDS. Dotted lines indicate the average background staining from PCR and PPHC. (F) Levels of circulating S+ switched memory B cells during acute disease and convalescence in the subset of patients analyzed, as well as PPHCs, color-coded according to PDS. Black triangles symbolize the PPHCs. Differences were assessed using Kruskal-Wallis with Dunn’s multiple comparisons test and considered statistically significant at P < 0.05. **P < 0.01.
Figure 6
Figure 6. Vaccination and systemic and airway antibody level rebound.
(A) Overview of vaccinated patients (n = 20) with respect to PDS during COVID-19 and sampling timeline after prime and boost as compared with vaccination in individuals naive to SARS-CoV-2 (n = 12). The anatomical compartments analyzed and the measurements performed are also shown. (B) Compiled patient-matched longitudinal data from acute, 3-month, and 8-month follow-ups are shown together with data from after prime and after boost for the levels of plasma IgG and IgA against N and RBD. (C) Direct comparison between plasma RBD IgG after boost in patients with COVID-19 and individuals naive to SARS-CoV-2. (D) Compiled data as above for RBD IgG and IgA in NSWs and NPAs. (E) Direct comparison between NSW RBD IgG after boost in patients with COVID-19 and individuals naive to SARS-CoV-2. The gray lines connect data points from the same individuals. Data are color-coded according to PDS during COVID-19, with data from individuals naive to SARS-CoV-2 shown in black as a comparison. Differences were assessed using Kruskal-Wallis with Dunn’s multiple comparisons test and considered statistically significant at P < 0.05. *P < 0.05, **P < 0.01, ***P < 0.001, ****P < 0.0001.

Comment in

References

    1. Gandhi RT, et al. Mild or moderate Covid-19. N Engl J Med. 2020;383(18):1757–1766. doi: 10.1056/NEJMcp2009249. - DOI - PubMed
    1. Berlin DA, et al. Severe Covid-19. N Engl J Med. 2020;383(25):2451–2460. doi: 10.1056/NEJMcp2009575. - DOI - PubMed
    1. Brodin P. Immune determinants of COVID-19 disease presentation and severity. Nat Med. 2021;27(1):28–33. doi: 10.1038/s41591-020-01202-8. - DOI - PubMed
    1. Moghadas SM, et al. The implications of silent transmission for the control of COVID-19 outbreaks. Proc Natl Acad Sci U S A. 2020;117(30):17513–17515. doi: 10.1073/pnas.2008373117. - DOI - PMC - PubMed
    1. Walls AC, et al. Structure, function, and antigenicity of the SARS-CoV-2 spike glycoprotein. Cell. 2020;181(2):281–292. doi: 10.1016/j.cell.2020.02.058. - DOI - PMC - PubMed

MeSH terms