. 2021 Nov;297(5):101311.
doi: 10.1016/j.jbc.2021.101311. Epub 2021 Oct 16.

Human CEACAM1-LF regulates lipid storage in HepG2 cells via fatty acid transporter CD36

Affiliations

Human CEACAM1-LF regulates lipid storage in HepG2 cells via fatty acid transporter CD36

Jennifer Chean et al. J Biol Chem. 2021 Nov.

Abstract

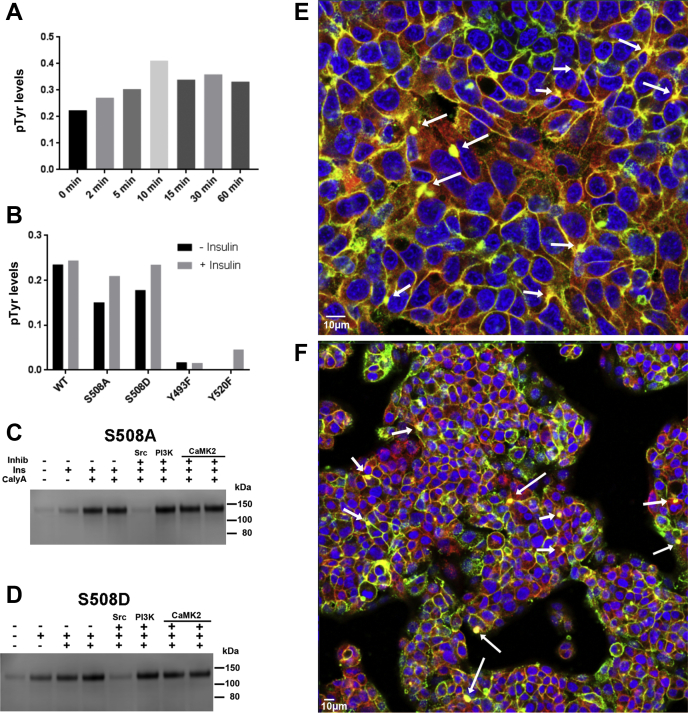
Carcinoembryonic antigen-related cell adhesion molecule 1 (CEACAM1) is expressed in the liver and secreted as biliary glycoprotein 1 (BGP1) via bile canaliculi (BCs). CEACAM1-LF is a 72 amino acid cytoplasmic domain mRNA splice isoform with two immunoreceptor tyrosine-based inhibitory motifs (ITIMs). Ceacam1-/- or Ser503Ala transgenic mice have been shown to develop insulin resistance and nonalcoholic fatty liver disease; however, the role of the human equivalent residue, Ser508, in lipid dysregulation is unknown. Human HepG2 hepatocytes that express CEACAM1 and form BC in vitro were compared with CEACAM1-/- cells and CEACAM1-/- cells expressing Ser508Ala null or Ser508Asp phosphorylation mimic mutations or to phosphorylation null mutations in the tyrosine ITIMs known to be phosphorylated by the tyrosine kinase Src. CEACAM1-/- cells and the Ser508Asp and Tyr520Phe mutants strongly retained lipids, while Ser508Ala and Tyr493Phe mutants had low lipid levels compared with wild-type cells, indicating that the ITIM mutants phenocopied the Ser508 mutants. We found that the fatty acid transporter CD36 was upregulated in the S508A mutant, coexpressed in BCs with CEACAM1, co-IPed with CEACAM1 and Src, and when downregulated via RNAi, an increase in lipid droplet content was observed. Nuclear translocation of CD36 associated kinase LKB1 was increased sevenfold in the S508A mutant versus CEACAM1-/- cells and correlated with increased activation of CD36-associated kinase AMPK in CEACAM1-/- cells. Thus, while CEACAM1-/- HepG2 cells upregulate lipid storage similar to Ceacam1-/- in murine liver, the null mutation Ser508Ala led to decreased lipid storage, emphasizing evolutionary changes between the CEACAM1 genes in mouse and humans.

Keywords: CD36; CEACAM1; NAFLD; NASH; bile canaliculi; lipid storage.


Conflict of interest statement

Conflict of interest The authors declare that they have no conflicts of interest with the contents of this article.

Figures

Figure 1
Figure 1
CEACAM1 cytoplasmic domain sequence homology and conserved functional domains. Partial sequences of rat (Rno), mouse (Mmu), and human (Has) CEACAM1 sequences taken from Kammerer and Zimmermann (28). Conserved regions for β-catenin binding (85) in blue, for ITIMs in green, and for GSK3β in red. Key residues indicated in color. Double basic residues in rat preceding Ser503 underlined.
Figure 2
Figure 2
Generation of CEACAM1−/−cells and expression of CEACAM1 mutants in CEACAM1−/−HepG2 cells.A, exon structure of human CEACAM1, location of guide RNA sgRNA 4.1 and its target sequence in exon 4. B, surveyor nuclease restriction digest of DNA from untransfected 293T cells, vector control transfected 293T cells, and 293T cells transfected with sgRNA 4.1 to 4.3. C, enrichment of KO HepG2 cells for deletion of CEACAM1 by negative selection. Red trace = WT HepG2 cells. Blue trace = sgRNA transfected cells prior to negative selection. Green trace = sgRNA transfected cells after negative selection of anti-CEACAM1 beads. D, sequence of human CEACAM-LF cytoplasmic domain with key residues marked. E, immunoblot staining (20 μg of lysates per lane) for CEACAM1 in WT HepG2 and Huh7 (Huh) human hepatocyte cell lines, along with a CEACAM1-LF transfected cell line control (MCF). F, immunoblot staining (20 μg of lysates per lane) for CEACAM1 in HepG2 WT, and mutant Ser508A, Ser508D, Tyr493F, and Tyr520 transfected into the CEACAM1−/− cells before and after treatment with insulin.
Figure 3
Figure 3
Effect of CEACAM1−/−and mutant cell lines on lipid droplet staining and bile canaliculi formation for HepG2 cells.AF, lipid droplet staining with Vala (green), nuclei (blue), and F-actin (red): A, WT. B, CEACAM1−/−. CF, CEACAM1−/− transfected with S508A mutant (C), S508D mutant (D), Y520F mutant (E), and Y493F mutant (F). G, quantitation of lipid staining of the six cell lines (see Experimental procedures). HM, staining with anti-CEACAM1 (green), F-actin (red), and nuclei (blue). H, WT. I, KO. JM, KO transfected with S508A mutant (J), S508D mutant (K), Y520F mutant (L), and Y493F mutant (M). Magnification 40×, arrows indicated three representative BCs located at junctions of three cells.
Figure 4
Figure 4
Expression of CEACAM1-SF in CEACAM1−/−HepG2 cells and lipid droplets.A and B, flow analysis of CEACAM1 KO cells before (A) and after (B) transfection with CEACAM1-SF. C, SDS gel analysis of CEACAM1 KO cells and CEACAM1 KO cells transfected with CEACAM1-SF (4S). D, comparative lipid droplet staining for WT, CEACAM1 KO, and CEACAM1 KO cells transfected with CEACAM1-SF or CEACAM1-LF (S508A mutant). E, quantitation of lipid droplet (LD) for two sizes per cell (see Experimental procedures) is shown below each panel.
Figure 5
Figure 5
High CD36 expression in S508A mutant and effect of CD36 RNAi.AF, staining of CD36 (green) in HepG2 cell lines. G, quantitation of CD36 staining for the six cell lines (see Experimental procedures). HJ, S508A mutants stained with CD36 (green), F-actin (red), and DAPI (blue). CD36 and BC expression of untreated (H) and RNAi control-treated (I) S508A mutant cells versus RNAi to CD36-treated S508A mutant cells (J). BCs are shown with arrows. KN, lipid droplet staining (green) of S508A mutant cells. Control RNAi treatment at 20× (K) and 40× (L). RNAi to CD36 treatment at 20× (M) and 40× (N). O, mRNA expression levels in cell lines by qRT-PCR (in triplicate, relative to GAPDH). P, treatment of cell lines with no RNAi, control RNAi, RNAi-1, RNAi-2, and RNAi-1 plus RNAi-2 to CD36 (in triplicate, relative to GAPDH). Q, cell surface levels of CD36 on four cell lines. R, SDS gel analysis of CD36 expression in six cell lines. KO, knockout; SA, S508A mutant; SD, S508D mutant; WT, wild type.
Figure 6
Figure 6
Nuclear expression of LKB1 in WT, CEACAM1−/−, and S508A and S508D mutants and AMPK expression. LKB1 nuclear expression in WT (A) and in CEACAM1−/− (B) and in S508A (C) and S508D (D) mutants (red = LKB1, blue = DAPI). Percent LKB1 positive nuclei per 50 cells counted for three fields ±SEM shown underneath each panel. Magnification 20×. E, triple staining of S508A mutant for CD36 (green), LKB1 (red) and nuclei (blue). Magnification 40×. F, immunoblots for the detection of activated AMPK (green channel) in WT, CEACAM1 KO, and CEACAM1 mutants (tubulin in red channel). Twenty micrograms of protein lysate loaded per lane.
Figure 7
Figure 7
PCSK9 expression affects CD36 expression in the S508A mutant. PCSK9 expression in WT (A) and in CEACAM1 S508A mutant (B) HepG2 cells. Triple stained for PCSK9 (green), F-actin (red), and nuclei (blue). Effect of control RNAi (C) and PCSK9 RNAi (D) on CD36 expression (green) in CEACAM1 S508A mutant HepG2 cells. Lack of an effect of control RNAi (E) and CD36 RNAi (F) on PCSK9 expression (green). G, effect of PCSK9 RNAi on PCSK9 mRNA expression as measured by qRT-PCR. H, effect of PCSK9 RNAi on CD36 mRNA expression as measured by qRT-PCR in triplicate.
Figure 8
Figure 8
Tyrosine phosphorylation of CEACAM1 by insulin versus Src and coexpression of SRC and CD36 with CEACAM1 in mutant S508A cells.A, lysates (20 μg) from WT cells treated before and after with insulin (15 μg/ml) over time were IPed with anti-CEACAM1 antibody and immunoblotted for phosphotyrosine. B, lysates (20 μg) from cells treated before and after with insulin for 30 min were IPed with anti-CEACAM1 antibody and immunoblotted for phosphotyrosine (normalized for CEACAM1 signal in a parallel immunoblot). C and D, equal amounts of lysates from S508A (C) or S508D (D) mutants treated with insulin or inhibitors of Src (BOS, 10 μM), PI3K (LY294002, 20 μM), or CaMK2 (KN93, 20 μM), IPed with anti-CEACAM1 antibody and run on SDS gels were blotted for phosphotyrosine. Mutant S508A cells were stained for Src (red), CEACAM1 (green), DAPI (blue), and overlayed (E) or for Src (red), CD36 (green), DAPI (blue), and overlayed (F). Arrows indicate examples of prominent BCs with yellow staining indicating overlap of Src with CEACAM1 or CD36. Magnifications were 40× (E) and 20× (F).
Figure 9
Figure 9
Coimmunoprecipitation of CEACAM1, Src, LB1, and Annexin A2 with CD36. CD36 was immunoprecipitated from Ser508A mutant HepG2 cells, pretreated or not with insulin, run on SDS gels, and immunoblotted for CD36, CEACAM1, Src, LKB1, and Annexin A2 (AnxA2). Equal amounts of protein were probed on immunoblots.
Figure 10
Figure 10
Comparative RNAseq analysis of WT versus CEACAM1−/−, and S508A and S508D mutant cells. The ratio (cell line/WT) of the top 50 upregulated genes are shown with the first ten in bold, as well as additional hits discussed in the text.
Figure 11
Figure 11
Model of FA import by CD36 and lipid droplet management in WT, CEACAM1−/−, and CEACAM1 mutants in HepG2 cells.A, lipid droplets (LDs) increase in CEACAM1−/−versus WT cells and are reduced in S508A mutant cells along with an increase in size of bile canaliculi (BCs). B, CD36 is found in a complex with CEACAM1, Src, LKB1, and AMPK. Src can phosphorylate CEACAM1 on Y493 and Y520 located on either side of S508. LKB1 can phosphorylate AMPK; however, phosphorylated LKB1 can translocate to the nucleus, reducing phosphorylation of AMPK. CD36 can be internalized to endosomes after binding long chain fatty acids and shunted to either lysosomes for degradation or to BCs. C, phosphorylation of S512 by PKA followed by phosphorylation of S508 by GSK3β can lead to high lipid accumulation. Src phosphorylation of Y493 leads to high lipid accumulation, while phosphorylation of Y520 leads to low lipid accumulation. Phosphorylation of both tyrosines is influenced by the phosphorylation status of S508. Thus, the null mutants of Y493 and Y520 can abrogate their normal lipid regulation functions.

References

    1. Svenberg T., Hammarstrom S., Zeromski J. Immunofluorescence studies on the occurrence and localization of the CEA-related biliary glycoprotein I (BGP I) in normal human gastrointestinal tissues. Clin. Exp. Immunol. 1979;36:436–441. - PMC - PubMed
    1. Beauchemin N., Draber P., Dveksler G., Gold P., Gray-Owen S., Grunert F., Hammarstrom S., Holmes K.V., Karlsson A., Kuroki M., Lin S.H., Lucka L., Najjar S.M., Neumaier M., Obrink B. Redefined nomenclature for members of the carcinoembryonic antigen family. Exp. Cell Res. 1999;252:243–249. - PubMed
    1. Poy M.N., Yang Y., Rezaei K., Fernstrom M.A., Lee A.D., Kido Y., Erickson S.K., Najjar S.M. CEACAM1 regulates insulin clearance in liver. Nat. Genet. 2002;30:270–276. - PubMed
    1. Jirsa M., Muchova L., Draberova L., Draber P., Smid F., Kuroki M., Marecek Z., Groen A.K. Carcinoembryonic antigen-related cell adhesion molecule 1 is the 85-kilodalton pronase-resistant biliary glycoprotein in the cholesterol crystallization promoting low density protein-lipid complex. Hepatology. 2001;34:1075–1082. - PubMed
    1. Kitamura Y., Murata Y., Park J.H., Kotani T., Imada S., Saito Y., Okazawa H., Azuma T., Matozaki T. Regulation by gut commensal bacteria of carcinoembryonic antigen-related cell adhesion molecule expression in the intestinal epithelium. Genes Cells. 2015;20:578–589. - PubMed

Publication types

LinkOut - more resources