MET overexpression contributes to STAT4-PD-L1 signaling activation associated with tumor-associated, macrophages-mediated immunosuppression in primary glioblastomas
- PMID: 34667077
- PMCID: PMC8527154
- DOI: 10.1136/jitc-2021-002451
MET overexpression contributes to STAT4-PD-L1 signaling activation associated with tumor-associated, macrophages-mediated immunosuppression in primary glioblastomas
Abstract
Background: Dysregulated receptor tyrosine kinases, such as the mesenchymal-epidermal transition factor (MET), have pivotal role in gliomas. MET and its interaction with the tumor microenvironment have been previously implicated in secondary gliomas. However, the contribution of MET gene to tumor cells' ability to escape immunosurveillance checkpoints in primary gliomas, especially in glioblastoma (GBM), which is a WHO grade 4 glioma with the worst overall survival, is still poorly understood.
Methods: We investigated the relationship between MET expression and glioma microenvironment by using multiomics data and aimed to understand the potential implications of MET in clinical practice through survival analysis. RNA expression data from a total of 1243 primary glioma samples (WHO grades 2-4) were assembled, incorporating The Cancer Genome Atlas, Chinese Glioma Genome Atlas, and GSE16011 data sets.
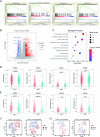
Results: Pearson's correlation test from the three data sets indicated that MET showed a robust correlation with programmed death-ligand 1 (PD-L1) and STAT pathways. Western blot analysis revealed that in GBM cell lines (N33 and LN229), PD-L1 and phosphorylated STAT4 were upregulated by MET activation treatment with hepatocyte growth factor and were downregulated on MET suppression by PLB-1001. Tumor tissue microarray analysis indicated a positive correlation between MET and PD-L1 and macrophage-associated markers. Chromatin immunoprecipitation-PCR assay showed enrichment of STAT4 in the PD-L1 DNA. Transwell co-culture and chemotaxis assays revealed that knockdown of MET in GBM cells inhibited macrophage chemotaxis. Moreover, we performed CIBERSORTx and single-cell RNA sequencing data analysis which revealed an elevated number of macrophages in glioma samples with MET overexpression. Kaplan-Meier survival analysis indicated that activation of the MET/STAT4/PD-L1 pathway and upregulation of macrophages were associated with shorter survival time in patients with primary GBM.
Conclusions: These data indicated that the MET-STAT4-PD-L1 axis and tumor-associated macrophages might enforce glioma immune evasion and were associated with poor prognosis in GBM samples, suggesting potential clinical strategies for targeted therapy combined with immunotherapy in patients with primary GBM.
Keywords: biomarkers; brain neoplasms; gene expression profiling; immunity; tumor.
© Author(s) (or their employer(s)) 2021. Re-use permitted under CC BY-NC. No commercial re-use. See rights and permissions. Published by BMJ.
Conflict of interest statement
Competing interests: None declared.
Figures


Similar articles
-
Orphan nuclear receptor TLX promotes immunosuppression via its transcriptional activation of PD-L1 in glioma.J Immunother Cancer. 2021 Apr;9(4):e001937. doi: 10.1136/jitc-2020-001937. J Immunother Cancer. 2021. PMID: 33858847 Free PMC article.
-
Correlation of immune phenotype with IDH mutation in diffuse glioma.Neuro Oncol. 2017 Oct 19;19(11):1460-1468. doi: 10.1093/neuonc/nox054. Neuro Oncol. 2017. PMID: 28531337 Free PMC article.
-
BRD4 promotes immune escape of glioma cells by upregulating PD-L1 expression.J Neurooncol. 2025 Feb;171(3):669-679. doi: 10.1007/s11060-024-04889-8. Epub 2024 Nov 28. J Neurooncol. 2025. PMID: 39607572
-
A Systematic Review of the Tumor-Infiltrating CD8+ T-Cells/PD-L1 Axis in High-Grade Glial Tumors: Toward Personalized Immuno-Oncology.Front Immunol. 2021 Sep 17;12:734956. doi: 10.3389/fimmu.2021.734956. eCollection 2021. Front Immunol. 2021. PMID: 34603316 Free PMC article.
-
Current advances in PD-1/PD-L1 axis-related tumour-infiltrating immune cells and therapeutic regimens in glioblastoma.Crit Rev Oncol Hematol. 2020 Jul;151:102965. doi: 10.1016/j.critrevonc.2020.102965. Epub 2020 Apr 24. Crit Rev Oncol Hematol. 2020. PMID: 32442903 Review.
Cited by
-
[Latest Research Findings on the Role of Non-Tumor Cells in Glioma Microenvironment].Sichuan Da Xue Xue Bao Yi Xue Ban. 2022 Jul;53(4):573-578. doi: 10.12182/20220760204. Sichuan Da Xue Xue Bao Yi Xue Ban. 2022. PMID: 35871725 Free PMC article. Review. Chinese.
-
A Synopsis of Biomarkers in Glioblastoma: Past and Present.Curr Issues Mol Biol. 2024 Jul 3;46(7):6903-6939. doi: 10.3390/cimb46070412. Curr Issues Mol Biol. 2024. PMID: 39057054 Free PMC article. Review.
-
Multiomics integration reveals the effect of Orexin A on glioblastoma.Front Pharmacol. 2023 Jan 20;14:1096159. doi: 10.3389/fphar.2023.1096159. eCollection 2023. Front Pharmacol. 2023. PMID: 36744263 Free PMC article.
-
Roles and Impacts of Integrative Medical Interventions in Central Nervous System Tumor Treatment: Multi-Technology Convergence and the Paradigm Shift Toward Functional Reconstruction.CNS Neurosci Ther. 2025 Jul;31(7):e70516. doi: 10.1111/cns.70516. CNS Neurosci Ther. 2025. PMID: 40654157 Free PMC article. Review.
-
Treatment of a newly diagnosed glioblastoma harboring MET amplification with vebreltinib in combination with radiotherapy: a case report.Discov Oncol. 2025 Jun 17;16(1):1133. doi: 10.1007/s12672-025-02979-1. Discov Oncol. 2025. PMID: 40526245 Free PMC article.
References
Publication types
MeSH terms
Substances
LinkOut - more resources
Full Text Sources
Medical
Research Materials
Miscellaneous
