. 2022 Feb;28(2):139-161.
doi: 10.1261/rna.078933.121. Epub 2021 Oct 19.

Transcription and splicing dynamics during early Drosophila development

Affiliations

Transcription and splicing dynamics during early Drosophila development

Pedro Prudêncio et al. RNA. 2022 Feb.

Abstract

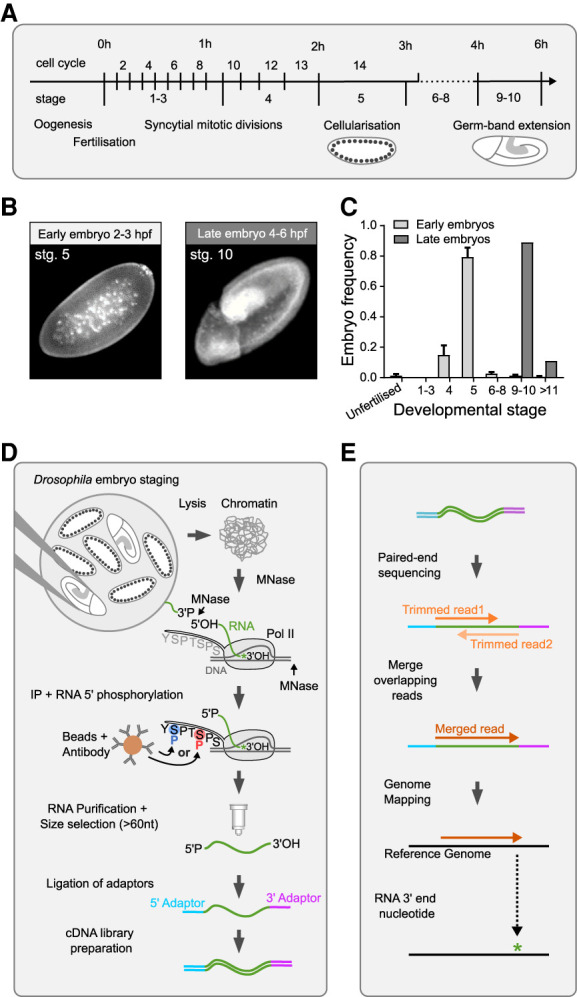
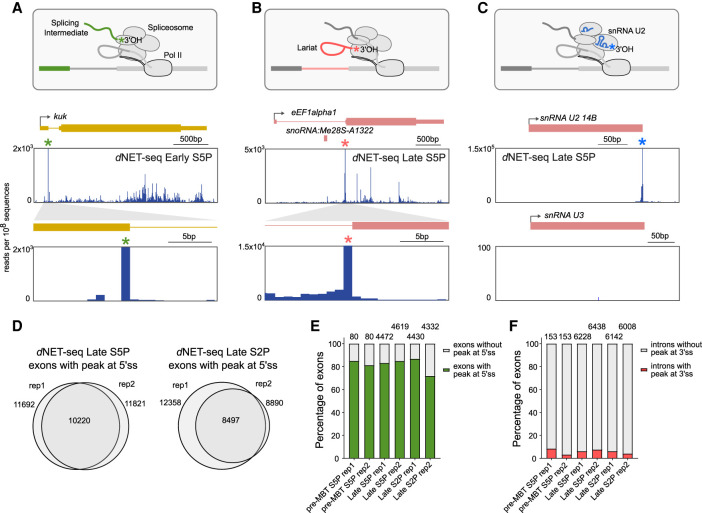
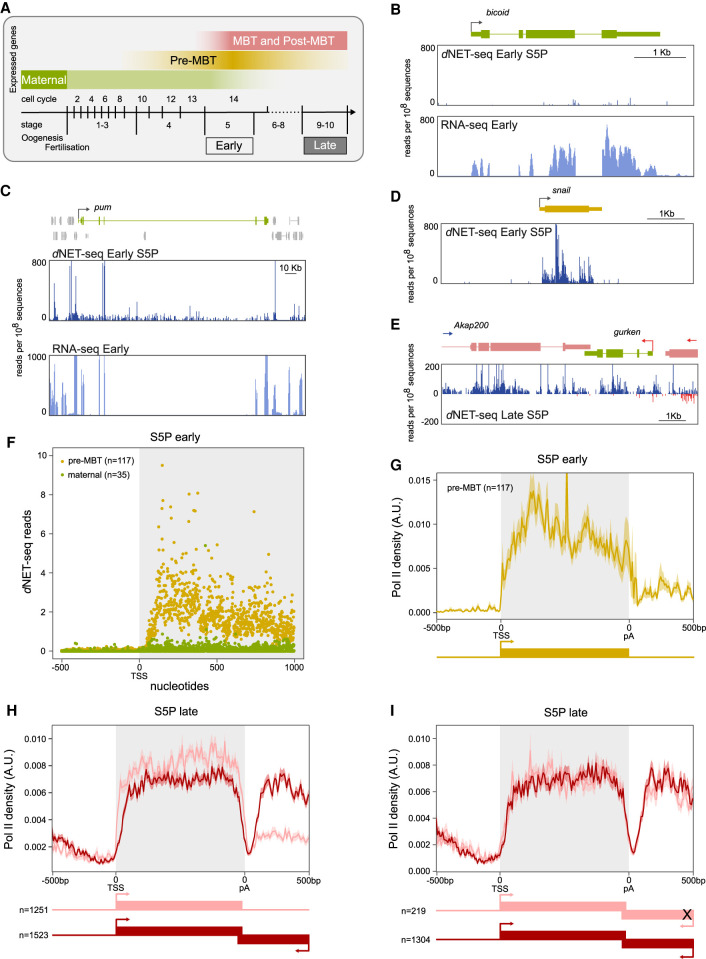
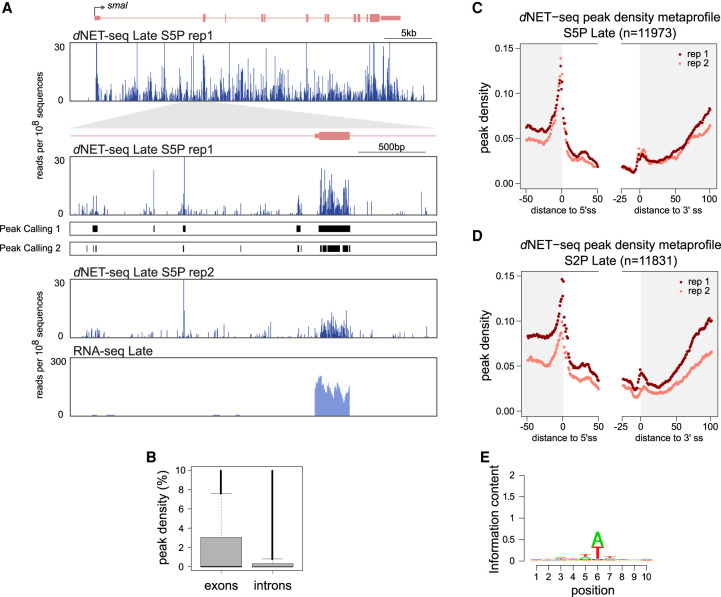
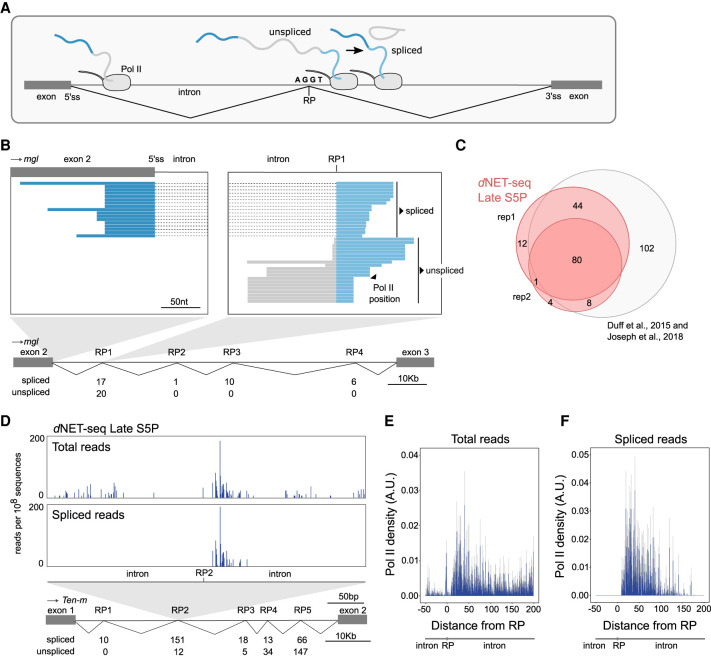
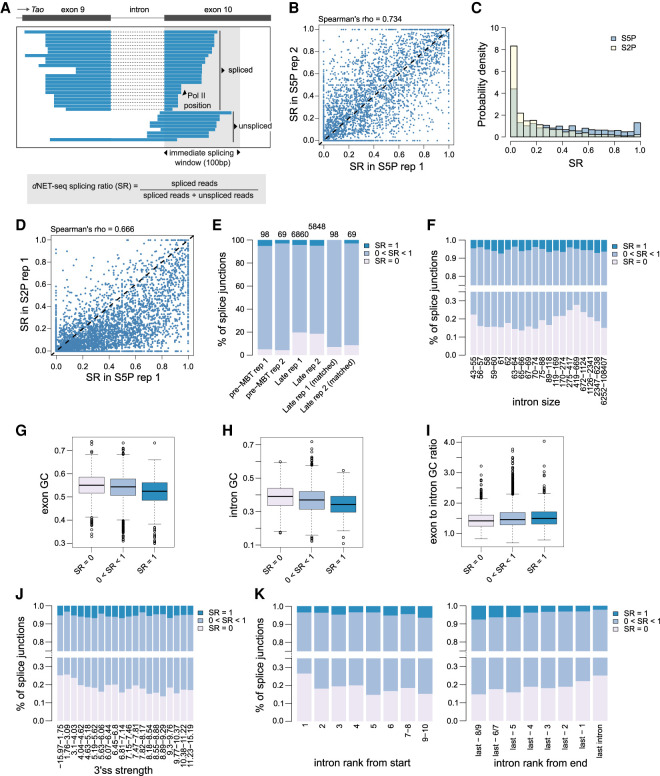
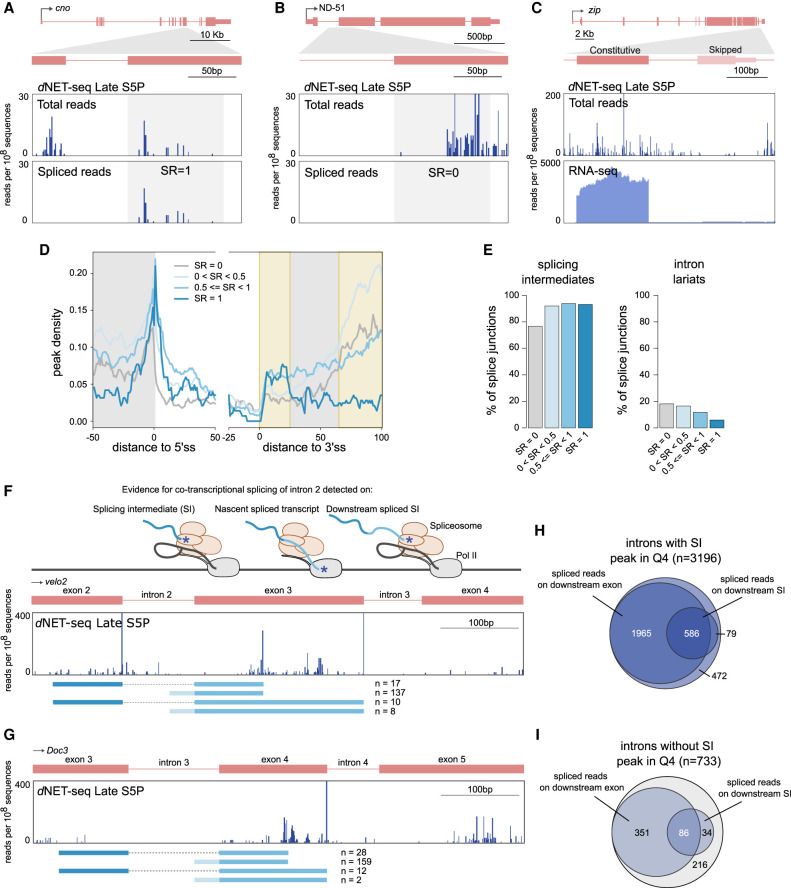
Widespread cotranscriptional splicing has been demonstrated from yeast to human. However, most studies to date addressing the kinetics of splicing relative to transcription used either Saccharomyces cerevisiae or metazoan cultured cell lines. Here, we adapted native elongating transcript sequencing technology (NET-seq) to measure cotranscriptional splicing dynamics during the early developmental stages of Drosophila melanogaster embryos. Our results reveal the position of RNA polymerase II (Pol II) when both canonical and recursive splicing occur. We found heterogeneity in splicing dynamics, with some RNAs spliced immediately after intron transcription, whereas for other transcripts no splicing was observed over the first 100 nt of the downstream exon. Introns that show splicing completion before Pol II has reached the end of the downstream exon are necessarily intron-defined. We studied the splicing dynamics of both nascent pre-mRNAs transcribed in the early embryo, which have few and short introns, as well as pre-mRNAs transcribed later in embryonic development, which contain multiple long introns. As expected, we found a relationship between the proportion of spliced reads and intron size. However, intron definition was observed at all intron sizes. We further observed that genes transcribed in the early embryo tend to be isolated in the genome whereas genes transcribed later are often overlapped by a neighboring convergent gene. In isolated genes, transcription termination occurred soon after the polyadenylation site, while in overlapped genes, Pol II persisted associated with the DNA template after cleavage and polyadenylation of the nascent transcript. Taken together, our data unravel novel dynamic features of Pol II transcription and splicing in the developing Drosophila embryo.

Keywords: Drosophila melanogaster embryo; NET-seq; splicing kinetics; transcription termination.


Figures

FIGURE 1.
FIGURE 1.
Native elongating transcript sequencing in Drosophila embryos. (A) Timeline of Drosophila early embryonic development, which starts with 13 rapid syncytial mitotic cycles. During interphase of cycle 14, membranes form between the nuclei located at the periphery of the embryo (cellularization). The new cells start morphogenetic movements leading to elongation of the embryo trunk (germ-band extension). (B) Representative images (stained for DNA) of embryos in mitotic cycle 14 (stage 5) and late germ-band expansion (stage 10). (C) The graph depicts the developmental stage of embryos sorted into the “early” and “late” groups. Approximately 30,000 early embryos and 15,000 late embryos were analyzed. (D) Outline of the dNET-seq experimental protocol. (E) Outline of dNET-seq data analysis.
FIGURE 2.
FIGURE 2.
dNET-seq captures splicing intermediates and spliceosomal snRNAs. (AC) The diagrams outline the 3′ OH ends generated by cotranscriptional cleavage at the 5′ splice site (A), the 3′ splice site (B), and the free 3′ OH end of spliceosomal snRNAs (C). Below each diagram, dNET-seq/S5P profiles over the indicated genes are depicted (data from late embryos). The green asterisk denotes the peak at the end of the exon (A). The pink asterisk denotes the peak at the end of the intron (B). The blue asterisk denotes the peak at the end of the U2 snRNA gene (C). Arrows indicate the direction of transcription. Exons are represented by boxes. Thinner boxes represent UTRs. Introns are represented by lines connecting the exons. (D) Comparison (Venn diagrams) of exons with a splicing intermediate peak detected in biological replicates of dNET-seq/S5P and dNET-seq/S2P libraries. (E,F) Frequency of peaks corresponding to splicing intermediates (E) and released intron lariats (F) in pre-MBT genes and genes expressed in late embryos. Only genes with the highest read density (fourth quartile) were considered.
FIGURE 3.
FIGURE 3.
dNET-seq profiles in early and late embryos. (A) The diagram illustrates the temporal expression of maternal, pre-MBT, MBT, and post-MBT genes during Drosophila embryonic development. dNET-seq/S5P and RNA-seq profiles over the maternal genes bicoid (B) and pumilio (pum) (C), the pre-MBT gene snail (D), and the post-MBT gene Akap200 (E). Reads that aligned to the positive strand are in blue, and reads that aligned to the negative strand are in red. (F) Meta-analysis of mean dNET-seq/S5P read density around the transcription start site (TSS) in maternal and pre-MBT genes (replicate 1). (GI) Normalized metagene analysis in arbitrary units (A.U.). The dNET-seq/S5P signal is depicted along the normalized gene length (gray background), as well as 500 bp upstream of the transcription start site (TSS) and 500 bp downstream from the polyadenylation (pA) site. (G) Pre-MBT genes in early embryos. (H) Transcriptionally active genes in late embryos; the signal over genes that have the 3′-UTR overlapped by an antisense gene is depicted in dark red, while the signal over genes with no other genes within 500 bp is depicted in light red. (I) Transcriptionally active genes in late embryos; the signal over genes that have the 3′-UTR overlapped by a transcriptionally active antisense gene is depicted in dark red, while the signal over genes with the 3′-UTR overlapped by a transcriptionally inactive antisense gene is depicted in light red.
FIGURE 4.
FIGURE 4.
Analysis of dNET-seq read density profiles. (A) dNET-seq/S5P and RNA-seq profiles over the post-MBT gene smoke alarm (smal). The read number is depicted at two magnification levels in two biological replicates. For replicate 1, the line “Peak Caller 1” shows peaks called using the “large peaks” setting, which is appropriate for detecting larger regions of putative Pol II pausing. The line “Peak Caller 2” shows peaks called using the “small peaks” setting, which provides higher spatial resolution and has been used for subsequent analyses. RNA-seq data for the same regions is also shown. (B) Peak density in the exons and introns of transcriptionally active genes (dNET-seq/S5P, replicate 1). Peak density has been defined as the percentage of nucleotides within a given exon or intron that overlap with a significant peak. (C,D) Metagene analysis of peak density estimated from dNET-seq/S5P (C) and dNET-seq/S2P (D) data from late embryos. To calculate peak density for each position, we divided the number of introns that overlap with a peak at that position by the total number of introns. The last 50 nt of exons, the first 50 nt of introns, the last 25 nt of introns, and the first 100 nt of exons are shown. Only internal and fully coding exons from transcriptionally active genes that are at least 100 nt long are shown. Exons shorter than 150 nt contribute to both the exon end and start. Only introns that were at least 50 nt long were considered. (E) Sequence logo of nucleotide frequencies within a 10-nt window around the 5′ ends of NET-seq reads. The combined height of the bases at each position is proportional to the information content. Position 6 corresponds to the 5′-most nucleotide of the read. Putative internal priming reads, as well as reads mapping to the last nucleotide of exons or introns (possible splice intermediate and intron lariat reads) were ignored.
FIGURE 5.
FIGURE 5.
dNET-seq captures recursive splicing intermediates. (A) Schematic illustrating recursive splicing. A ratchet point (RP) with juxtaposed acceptor and donor splice site motifs is indicated. (B) Visualization of dNET-seq/S5P reads that align to the second intron of the Megalin (mgl) gene. Recursively spliced reads align to exon 2 (dark blue) and the intron after RP1 (light blue). Unspliced reads are depicted in gray. The number of spliced and unspliced reads at each RP in the intron is indicated. (C) Venn diagram comparing RPs identified in two dNET-seq/S5P biological replicates and in previously reported studies (Duff et al. 2015; Joseph et al. 2018). (D) Number of dNET-seq/S5P reads that have the 3′ end mapped around RP2 in the first intron of Tenascin major (Ten-m) gene. The top panel depicts all reads, and the bottom panel depicts only reads that have been spliced to RP1. (E,F) Meta-analysis with single nucleotide resolution of normalized dNET-seq/S5P reads around RPs (n = 137) using all reads (E) or only reads spliced to the previous RP or exon (F).
FIGURE 6.
FIGURE 6.
dNET-seq reveals immediate splicing at all intron sizes. (A) Visualization of dNET-seq/S5P reads that align to exon 10 of the Tao gene. For BJ, unless otherwise specified, only introns from transcriptionally active genes where the downstream exon is a fully coding internal exon at least 100 nt long were included. In addition, enough spliced/unspliced reads had to end within the first 100 exonic nucleotides that obtaining a splicing ratio (SR) of 0 or 1 by chance alone was highly unlikely (see the Materials and Methods section for details). For genes expressed in late embryos, this threshold was 10 reads for both replicates. For pre-MBT genes, it was 14 for replicate 1 and 9 for replicate 2. For S2P data, we used a threshold of 10 to enable better comparison with S5P. (B) SR values estimated in two biological replicates of dNET-seq/S5P data sets from late embryos (Spearman correlation, ρ = ∼0.734, P < 2.2 × 10⁻¹⁶; N = 3708). (C) Histogram of SR values for dNET-seq/S5P (N = 5626) and dNET-seq/S2P (N = 6888). To test the significance of the difference between S5P and S2P, a binomial regression with a logit link was performed without filtering by read number (N = 12,833 for S5P; N = 13,229 for S2P). The number of spliced and unspliced reads was specified as the dependent variable and the status of each data point as S5P or S2P was the sole predictor. The model predicted a splicing ratio of ∼0.369/∼0.394 for S5P replicate 1/2 and of 0.162/0.269 for S2P replicate 1/2. (D) SR values estimated in replicate 1 of dNET-seq/S5P and dNET-seq/S2P data sets from late embryos (Spearman correlation, ρ = ∼0.666, P < 2.2 × 10⁻¹⁶; N = 4773). (E) Proportion of splice junctions in pre-MBT genes and genes expressed in late embryos classified according to their SR values. As many pre-MBT genes are single-intron, last introns were exceptionally included in this analysis. To make the two columns on the right, we used a subset of the genes expressed in late embryos (post-MBT genes) that was as similar as possible to the pre-MBT set in read number. Concretely, to match each pre-MBT gene, we picked the post-MBT gene that had the most similar total count of spliced and unspliced reads, making sure that every post-MBT gene only appeared in the subset once. (FK) Several parameters of gene architecture show a relationship with SR. For the sample sizes and statistical tests used, see Supplemental Table 1. Note that in F, JK, the bin ranges have been set so that intron numbers would be as equal as possible between bins.
FIGURE 7.
FIGURE 7.
Immediate splicing associates with higher density of dNET-seq signal. (AC) dNET-seq/S5P profiles surrounding the indicated exons in the post-MBT genes cno (A), ND-51 (B), and zip (C). The top panels depict all reads. The bottom panels depict either the 3′ end coordinate of reads that span the splice junction (A,B), or the RNA-seq profile (C). (D) Metagene analysis of peak density estimated from dNET-seq/S5P data sets from late embryos (replicate 1) for different ranges of SR values. To calculate peak density for each position, we divided the number of introns that overlap with a peak at that position by the total number of introns. The last 50 nt of exons, the first 50 nt of introns, the last 25 nt of introns, and the first 100 nt of exons are shown. Only internal and fully coding exons from transcriptionally active genes that are at least 100 nt long are shown (N = 4783). In addition, at least 10 spliced/unspliced reads had to end within the first 100 nt of the exon. (E) The proportion of introns with at least one read whose 3′ end maps to the final position of the upstream exon (putative splicing intermediates) or to the final position of the intron (putative intron lariats) in dNET-seq/S5P late replicate 1. (F,G) dNET-seq/S5P profiles on the indicated regions of the velo2 and Doc3 genes. Below, spliced reads are depicted. Asterisks denote 3′ OH ends. (H,I) Venn diagrams showing how many junctions with or without a splicing intermediate peak are covered by spliced reads or have a downstream splicing intermediate covered by spliced reads.
Pedro Prudêncio
Pedro Prudêncio
Rosina Savisaar
Rosina Savisaar
Kenny Rebelo
Kenny Rebelo

Similar articles

Cited by

References

    1. Akhtar J, Kreim N, Marini F, Mohana G, Brüne D, Binder H, Roignant J-Y. 2019. Promoter-proximal pausing mediated by the exon junction complex regulates splicing. Nat Commun 10: 521. 10.1038/s41467-019-08381-0 - DOI - PMC - PubMed
    1. Alexander RD, Innocente SA, Barrass JD, Beggs JD. 2010. Splicing-dependent RNA polymerase pausing in yeast. Mol Cell 40: 582–593. 10.1016/j.molcel.2010.11.005 - DOI - PMC - PubMed
    1. Alpert T, Herzel L, Neugebauer KM. 2017. Perfect timing: splicing and transcription rates in living cells. WIREs RNA 8: e1401. 10.1002/wrna.1401 - DOI - PMC - PubMed
    1. Ameur A, Zaghlool A, Halvardson J, Wetterbom A, Gyllensten U, Cavelier L, Feuk L. 2011. Total RNA sequencing reveals nascent transcription and widespread co-transcriptional splicing in the human brain. Nat Struct Mol Biol 18: 1435–1440. 10.1038/nsmb.2143 - DOI - PubMed
    1. Artieri CG, Fraser HB. 2014. Transcript length mediates developmental timing of gene expression across Drosophila. Mol Biol Evol 31: 2879–2889. 10.1093/molbev/msu226 - DOI - PMC - PubMed

Publication types