. 2021 Oct 20;6(1):357.
doi: 10.1038/s41392-021-00761-7.

XBP1 regulates the protumoral function of tumor-associated macrophages in human colorectal cancer

Affiliations

XBP1 regulates the protumoral function of tumor-associated macrophages in human colorectal cancer

Yahui Zhao et al. Signal Transduct Target Ther. .

Abstract

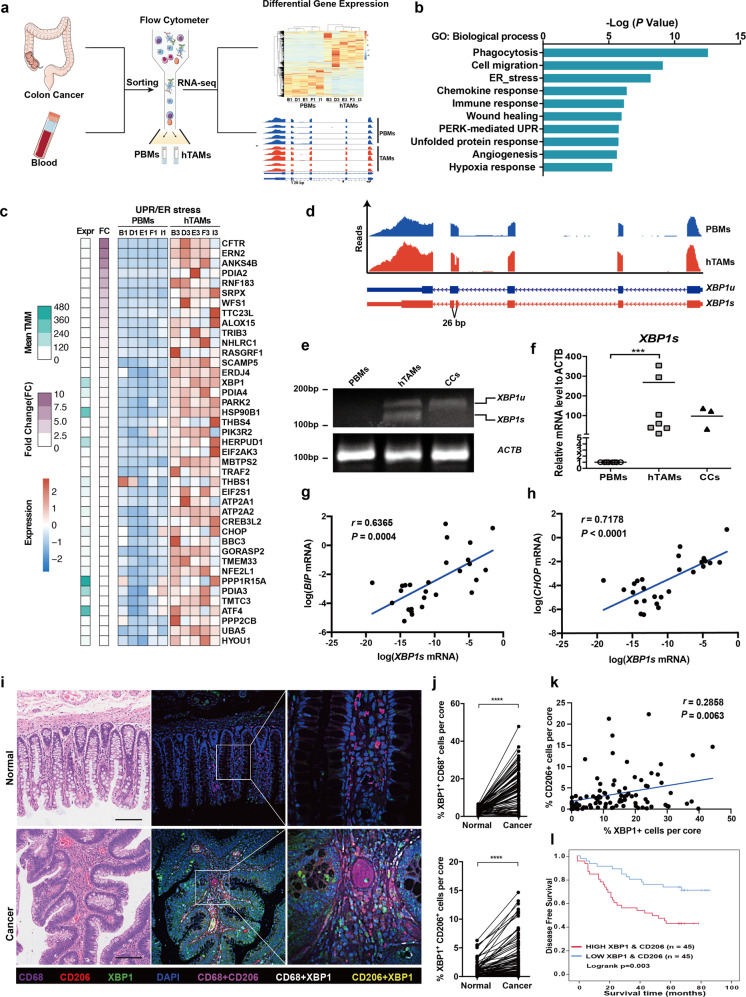
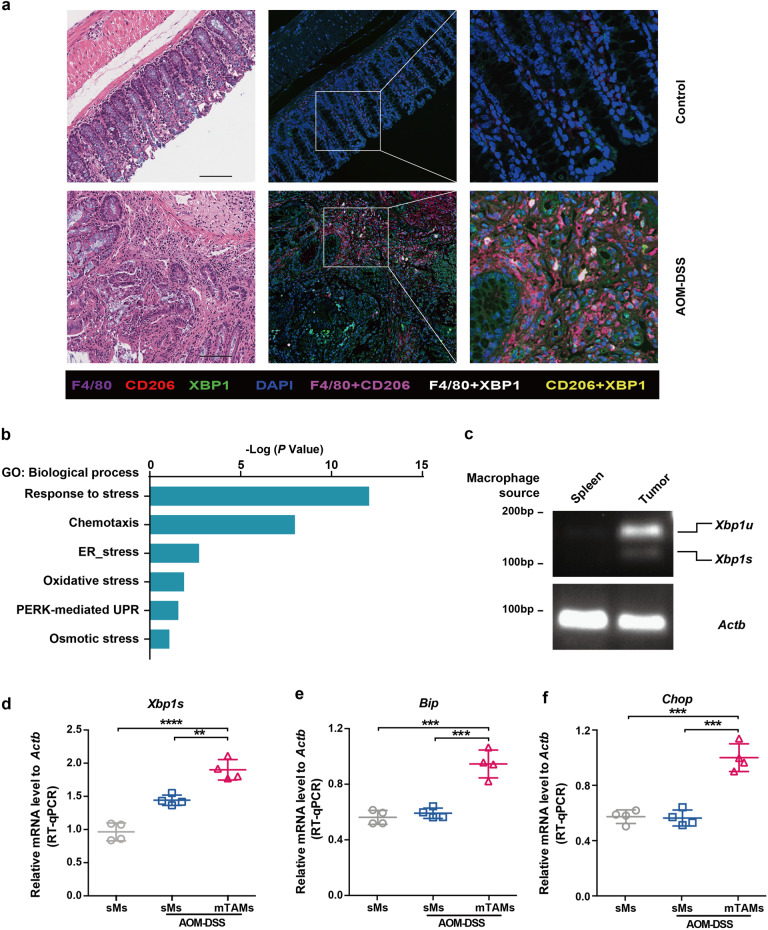
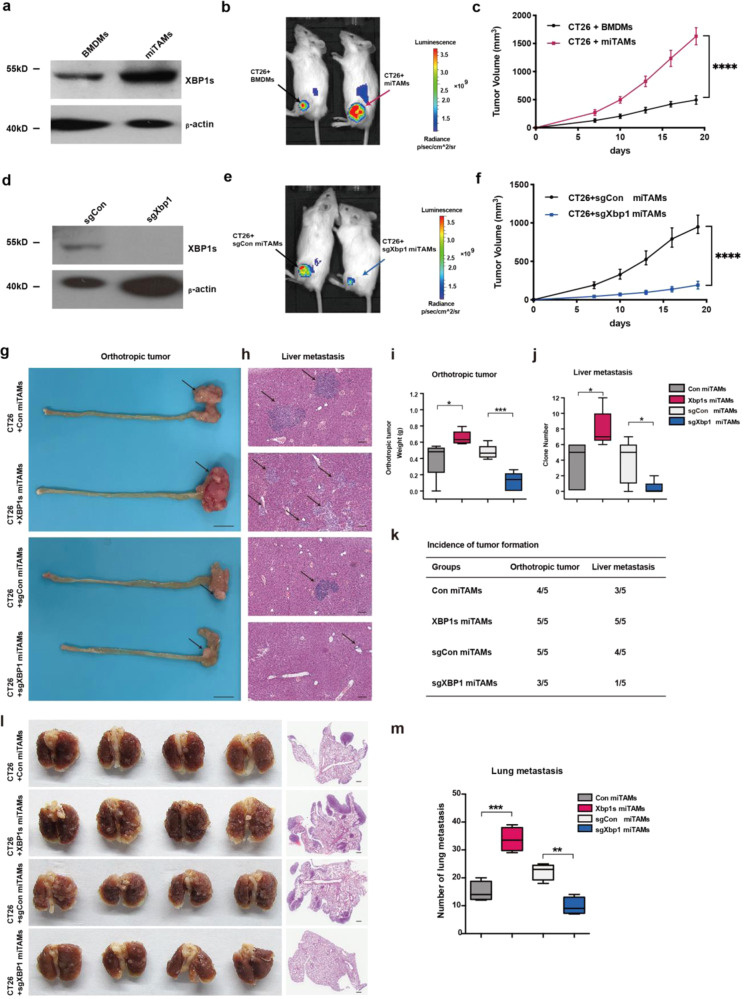
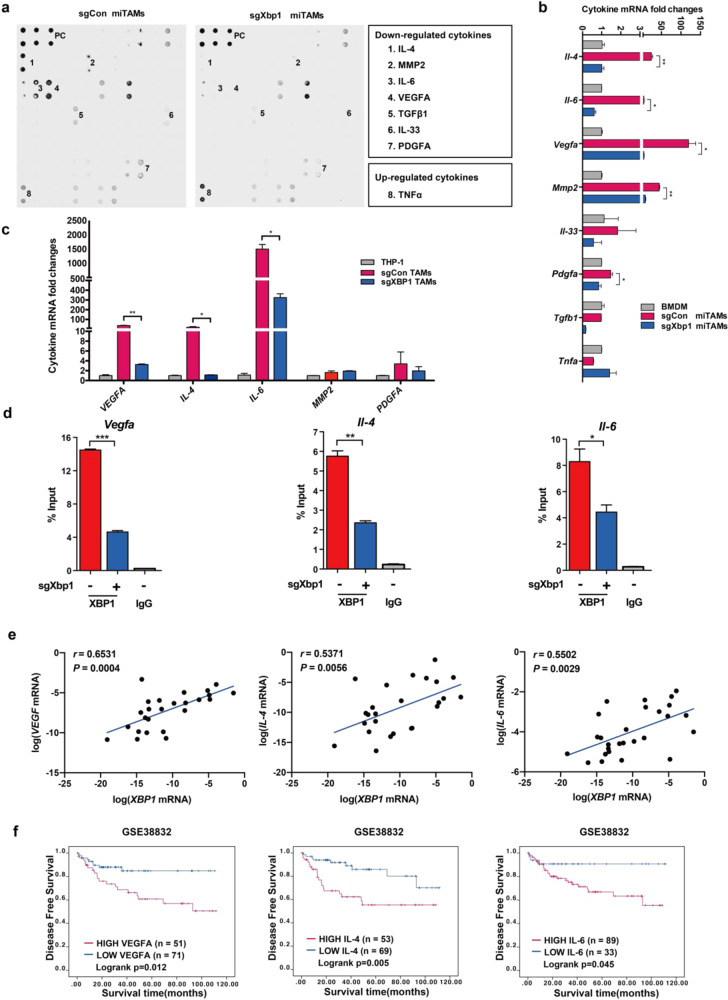
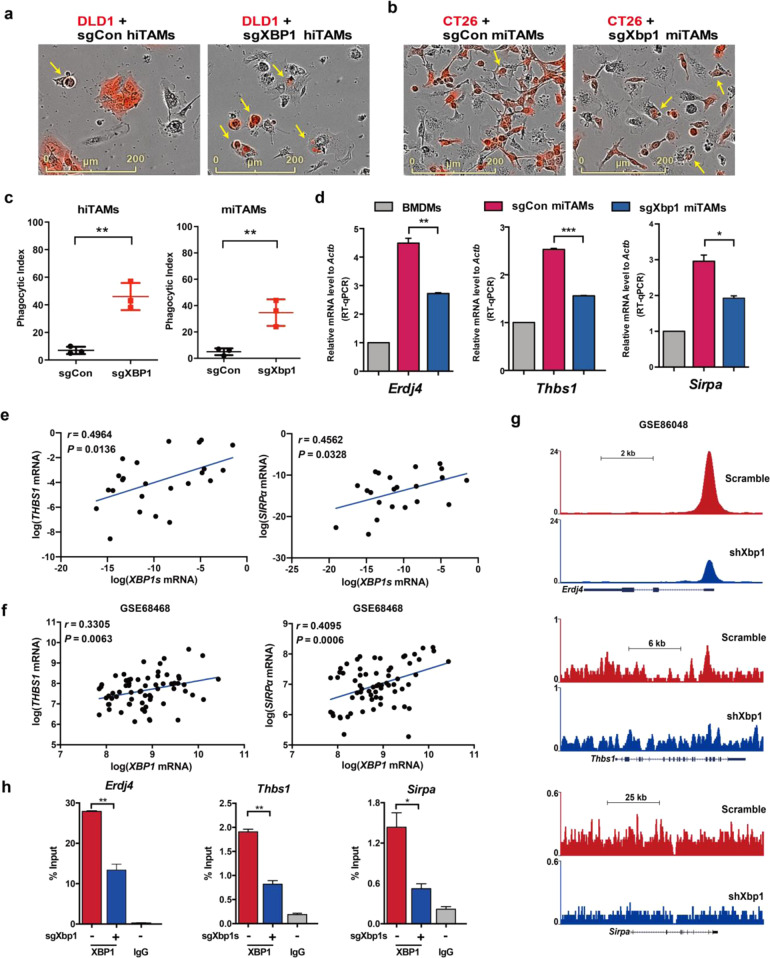
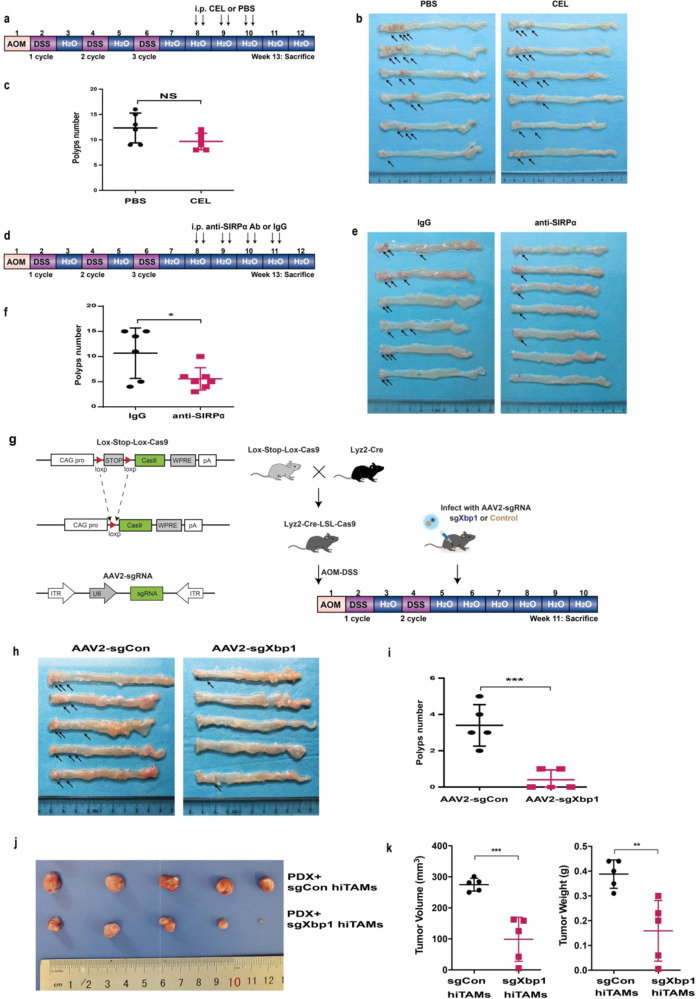
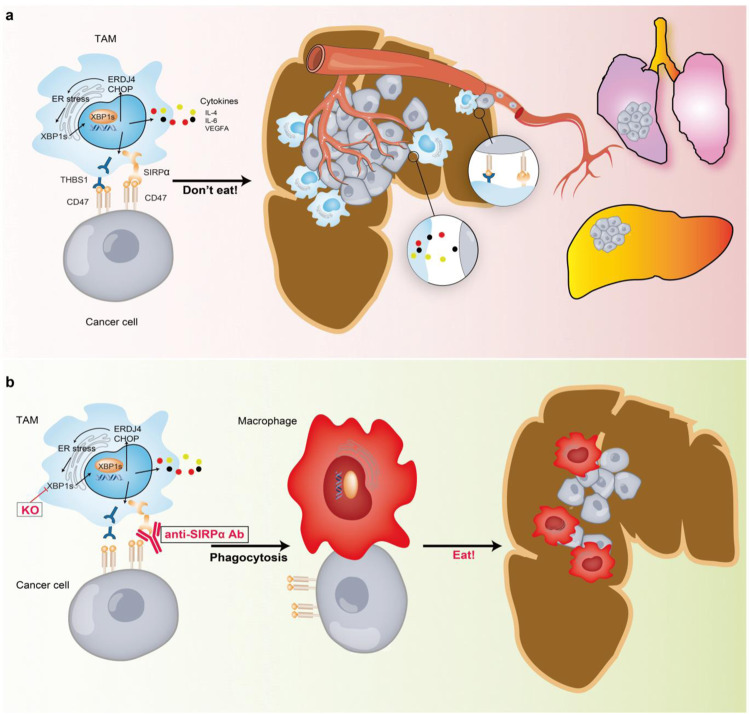
Macrophages are among the most abundant immune cells in colorectal cancer (CRC). Re-educating tumor-associated macrophages (TAMs) to switch from protumoral to anti-tumoral activity is an attractive treatment strategy that warrants further investigation. However, little is known about the key pathway that is activated in TAMs. In this study, infitrating CD206+ TAMs in CRC were sorted and subjected to RNA-seq analysis. Differentially expressed genes were found to be enriched in unfolded protein response/endoplasmic reticulum stress response processes, and XBP1 splicing/activation was specifically observed in TAMs. XBP1 activation in TAMs promoted the growth and metastasis of CRC. Ablation of XBP1 inhibited the expression of the pro-tumor cytokine signature of TAMs, including IL-6, VEGFA, and IL-4. Simultaneously, XBP1 depletion could directly inhibit the expression of SIRPα and THBS1, thereby blocking "don't eat me" recognition signals and enhancing phagocytosis. Therapeutic XBP1 gene editing using AAV2-sgXBP1 enhanced the anti-tumor activity. Together, XBP1 activation in TAMs drives CRC progression by elevating pro-tumor cytokine expression and secretion, as well as inhibiting macrophage phagocytosis. Targeting XBP1 signaling in TAMs may be a potential strategy for CRC therapy.


Conflict of interest statement

The authors declare no competing interests.

Figures

Fig. 1
Fig. 1
UPR/ER-XBP1 activation in human TAMs infiltrate into CRC. a Schematic overview of the strategy for identification of UPR/ER-XBP1 signaling pathways in hTAMs of CRC. b Gene Ontology (GO) term analysis of differentially regulated genes, as revealed using RNA-seq, in five paired hTAMs/PBMs samples. c Upregulation of genes involved in the UPR/ER stress response process. d XBP1 splicing in hTAMs confirmed by RNA-seq alternative mRNA splicing analysis. XBP1u, unspliced form; XBP1s, spliced form. e Detection of XBP1 splicing using conventional RT-PCR and agarose gel electrophoresis. f Expression of XBP1s in PBMs, hTAMs and cancer cells evaluated by RT-qPCR. Data were normalized to endogenous levels of ACTB. ***P < 0.001; ANOVA test. g, h Expression of BIP and CHOP versus XBP1s in all hTAM samples from CRC patients (n = 27). r Spearman’s rank correlation test. i CD206, CD68, and XBP1 immunofluorescence stains in human CRCs and adjacent normal tissues. Scale bar: 100 μm. j XBP1+ CD68+ cells (upper panel), and XBP1+ CD206+ cells (lower panel) among the total number of cells in each individual core from human CRCs and adjacent normal tissues, as determined by PerkingElmer inFormTM system. ****P < 0.0001; paired t-test. k Correlation of percentage of XBP1+ cells with CD206+ in CRC patients. r, Spearman’s rank correlation test. l Kaplan–Meier survival curves for 90 CRC patients with or without high XBP1+CD206+ cells
Fig. 2
Fig. 2
XBP1 activation in AOM-DSS-induced colorectal cancer-associated macrophages. a F4/80, CD206, and XBP1 immunofluorescence in colon sections from healthy and AOM-DSS mice. Scale bar: 100 μm. b Gene Ontology (GO) term analysis of differentially regulated genes, as revealed using RNA-seq, in four paired mTAMs and spleen macrophages (sMs). c Xbp1 splicing was evaluated using conventional RT-PCR and agarose gel electrophoresis. d Expression of XBP1s in spleen macrophages (sMs) and mTAMs evaluated via RT-qPCR. Data were normalized to endogenous levels of ACTB. e, f Expression of the UPR/ER stress response transcripts Bip and Chop determined by RT-qPCR. Data normalized to endogenous levels of ACTB. (n = 4 mice per group); **P < 0.01, ***P < 0.001, ****P < 0.0001; ANOVA test
Fig. 3
Fig. 3
Effect of XBP1 activation on the pro-tumor function of TAMs. a Western blot analysis of XBP1s expression in indicated macrophages. b Representative micrograph showing tumor formation in NOD/SCID mice injected subcutaneously (s.c.) with luciferase tumor cells (CT26-luciferase) and two groups of macrophages: CT26 + BMDMs (black arrows) and CT26 + miTAMs (magenta arrows). c Growth curves of the two groups in b. d Western blot analysis of XBP1 expression in sgCon or sgXbp1 TAMs. e Representative photograph showing tumor formation in NOD/SCID mice injected s.c. with luciferase tumor cells (CT26-luciferase) and two groups of miTAMs: CT26 + sgCon miTAMs (black arrows); and CT26 + sgXbp1 miTAMs (blue arrows). f Growth curves of the two groups in e. ****P < 0.0001; Repeated measurement and analysis. g CT26 cells, mixed with: Con TAMs; Xbp1s TAMs; sgCon TAMs; and sgXbp1 TAMs, were orthotopically injected into the wall of the cecum (n = 5 mice per group). Macroscopic appearance of the CRC orthotopic tumors with each indicated treatment. Black arrows indicate macroscopic polyps. Scale bar, 1 cm. h Representative HE staining of liver metastasis in mice xenografted of the four groups in g. Scale bar, 100 μm. i, j Statistical analysis of the orthotopic CRC tumor weight (i) and the clone number of liver metastasis (j). *P < 0.05, ***P < 0.001; t-test. k Incidence of orthotopic CRC tumor formation and liver metastasis analysis. l Representative images of CT26 pulmonary metastases induced by tail vein injection in NOD/SCID. CT26 cells were mixed with: Con miTAMs; Xbp1s miTAMs; sgCon miTAMs; and sgXbp1 miTAMs. HE staining demonstrating the histology of tumors formed in the lungs; scale bar, 500 μm. m Pulmonary metastatic nodule numbers in i. (n = 4 mice per group); **P < 0.01, ***P < 0.001; t-test
Fig. 4
Fig. 4
Cytokines production induced by XBP1 activation in TAMs. a Representative cytokine arrays for sgCon miTAMs and paired sgXbp1 miTAMs supernatants. b Relative mRNA levels of cytokines in BMDMs, sgCon miTAMs, and paired sgXbp1 miTAMs validated by RT-qPCR. c Expression of cytokines in human TAMs. Human macrophages from THP-1 cells were induced to TAMs via incubation in condition medium of HCT116 cells, and relative mRNA levels of cytokines in THP-1, sgCon or sgXBP1 TAMs were validated by RT-qPCR. d ChIP-qPCR experiments measuring XBP1 binding on Vegfa, Il-4, and Il-6 segments. Bars represent mean ± SD of three experimental replicates. *P < 0.05, **P < 0.01, ***P < 0.001; t-test. e Expression of VEGFA, IL-4, and IL-6 versus XBP1s in all hTAM samples from CRC patients (n = 27). r, Spearman’s rank correlation test. f Kaplan–Meier survival curves for CRC patients with or without high expression levels of VEGFA, IL-4 and IL-6 in the GEO online database (GSE38832). The optimal survival cut point was determined via X-Tile statistical software
Fig. 5
Fig. 5
Effect of XBP1 on macrophages phagocytosis. a Representative images of phagocytosis assays using RFP-labeled human CRC cell, DLD1cells (DLD1-RFP) and sgCon or sgXBP1 hiTAMs (n = 3). Yellow arrows denote phagocytic events. Scale bar = 200 μm. b Representative images of phagocytosis assays using RFP-labeled mouse CT26 cells (CT26-RFP) and sgCon or sgXbp1 miTAMs (n = 3). Yellow arrows denote phagocytic events. Scale bar = 200 μm. c Results of phagocytosis assays of the two groups in a, b. **P < 0.01; t-test. d Relative mRNA levels of XBP1 and phagocytosis-associated genes in BMDM, sgCon miTAMs and sgXbp1 miTAMs, validated by RT-qPCR. Bars represent mean ± SD of three experimental replicates. *P < 0.05, **P < 0.01, ***P < 0.001; t-test. e Expression of THBS1 and SIRPα versus XBP1 in TAMs sorted from CRC patients (n = 27 total). r, Spearman’s rank correlation test. f Correlation of XBP1 with THBS1 and SIRPα in CRC patients. The association was analyzed using coefficient measures of the linear relationships in the public GEO database (GSE68468). g Track view of Erdj4, Thbs1, and Sipra ChIP-seq density upon silencing of Xbp1 in the ChIP-seq online database (GSE86048). h ChIP-qPCR experiments measuring XBP1 binding on Erdj4, Thbs1, and Sipra segments. Bars represent mean ± SD of three experimental replicates. *P < 0.05, **P < 0.01. P-values were determined using t-test
Fig. 6
Fig. 6
Therapeutic effects of targeting UPR/ER-XBP1 signaling in TAMs. a Schematic overview of macrophage depletion in an AOM-DSS model. b Pictures of the whole colons. The arrowhead indicates macroscopic polyps. c Mean macroscopic polyp number in whole colons. d Schematic overview of the administering of anti-SIRPα antibodies during late stages of the AOM-DSS model. Mice were treated with anti-SIRPα antibodies (8 mg/kg) vs. control IgG twice/week after the third DSS cycle for 4 weeks. Colons were removed at week 13 following AOM injection. e Pictures of the whole colon. The arrowhead indicates macroscopic polyps. f Mean macroscopic polyp numbers in whole colons (n = 6 for IgG and n = 7 for anti-SIRPα Ab). g Schematic representing the generation of mice with genetically targeted and deficient XBP1 in TAMs. Mice were treated with AAV2-sgXbp1 (5 × 1011/mouse, i.p.) vs. control AAV2-sgCon twice/week after the second DSS cycle for 4 weeks. Colons were removed at week 11 after AOM injection. h Pictures of the whole colon. The arrowhead indicates macroscopic polyps. i Mean macroscopic polyp number in whole colons (n = 5 for sgCon and n = 5 for sgXbp1). NS = P > 0.05, *P < 0.05, ***P < 0.001. P-values were determined using t-test. j Representative photograph showing tumor formation in NOD/SCID mice injected s.c. with CRC PDX and two groups of TAMs: PDX + sgCon hiTAMs; and PDX + sgXBP1 hiTAMs. k Tumor volumes and tumor weights were resected and measured 3 weeks later. **P < 0.01, ***P < 0.001; Mann–Whitney U-test
Fig. 7
Fig. 7
Scheme depicting the contribution of XBP1 in TAMs to colon cancer progression. a In the tumor microenvironment, activation of UPR/ER-XBP1 signaling in TAMs induced the production of cytokines, which inhibited macrophage phagocytosis of tumor cells via the disruption of self-recognition. Therefore, TAMs promote the metastasis of colorectal cancer. b Disabling UPR/ER-XBP1 signaling or treatment with anti-SIRPα antibodies may enhance anti-cancer capacity in a harsh tumor microenvironment

Similar articles

Cited by

References

    1. Lasry A, Zinger A, Ben-Neriah Y. Inflammatory networks underlying colorectal cancer. Nat. Immunol. 2016;17:230–240. doi: 10.1038/ni.3384. - DOI - PubMed
    1. Fridman WH, Pages F, Sautes-Fridman C, Galon J. The immune contexture in human tumours: impact on clinical outcome. Nat. Rev. Cancer. 2012;12:298–306. doi: 10.1038/nrc3245. - DOI - PubMed
    1. Boland PM, Ma WW. Immunotherapy for colorectal cancer. Cancers (Basel) 2017;9:50. doi: 10.3390/cancers9050050. - DOI - PMC - PubMed
    1. Gentles AJ, et al. The prognostic landscape of genes and infiltrating immune cells across human cancers. Nat. Med. 2015;21:938–945. doi: 10.1038/nm.3909. - DOI - PMC - PubMed
    1. Forssell J, et al. High macrophage infiltration along the tumor front correlates with improved survival in colon cancer. Clin. Cancer Res. 2007;13:1472–1479. doi: 10.1158/1078-0432.CCR-06-2073. - DOI - PubMed

Publication types

MeSH terms