. 2021 Oct 19;12(1):6093.
doi: 10.1038/s41467-021-26337-1.

A dual-reporter system for investigating and optimizing protein translation and folding in E. coli

Affiliations

A dual-reporter system for investigating and optimizing protein translation and folding in E. coli

Ariane Zutz et al. Nat Commun. .

Abstract

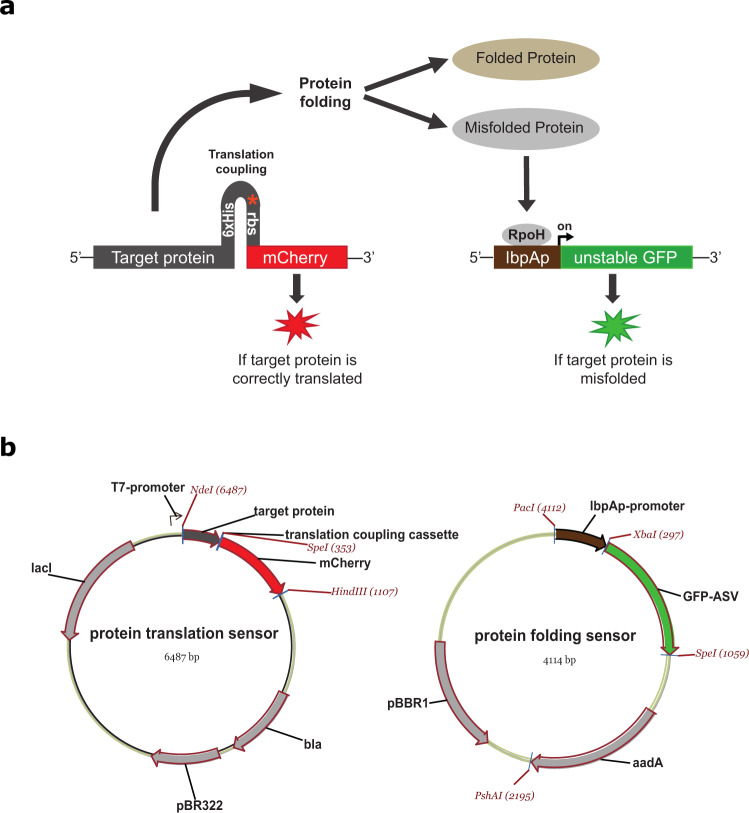
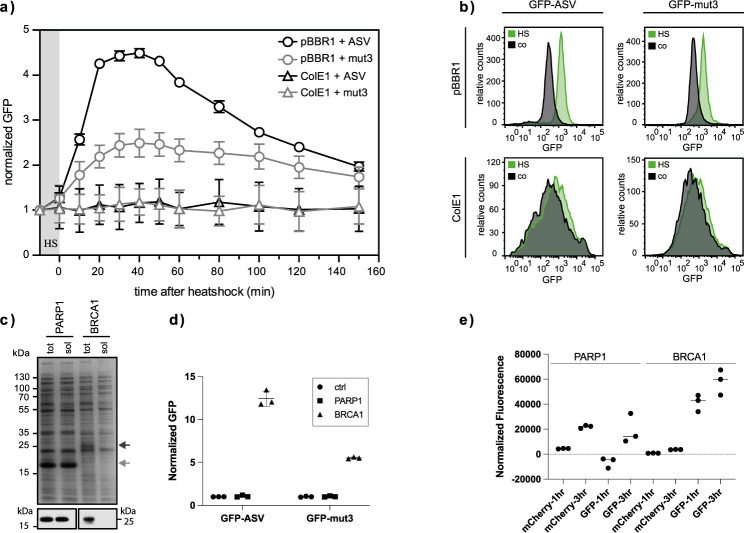
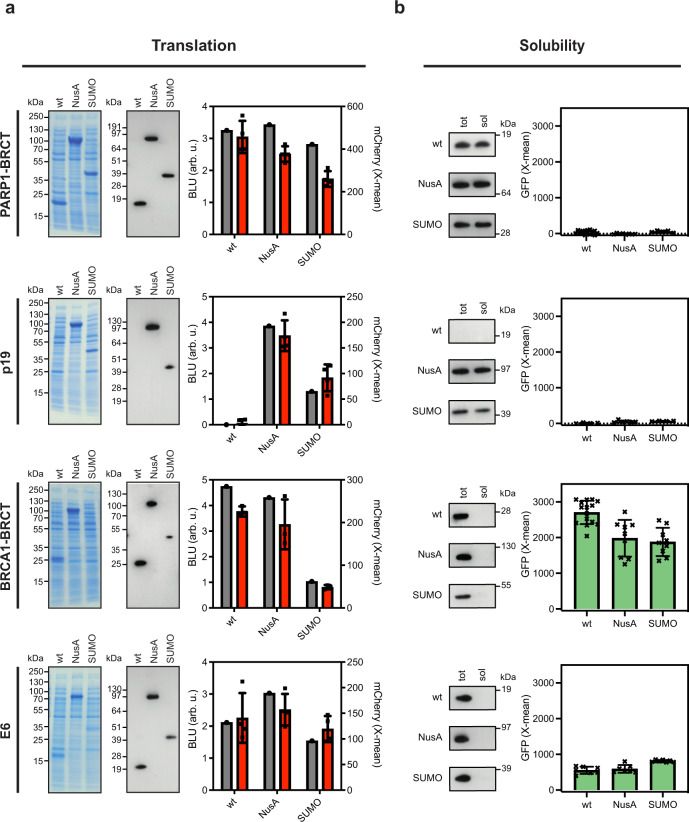
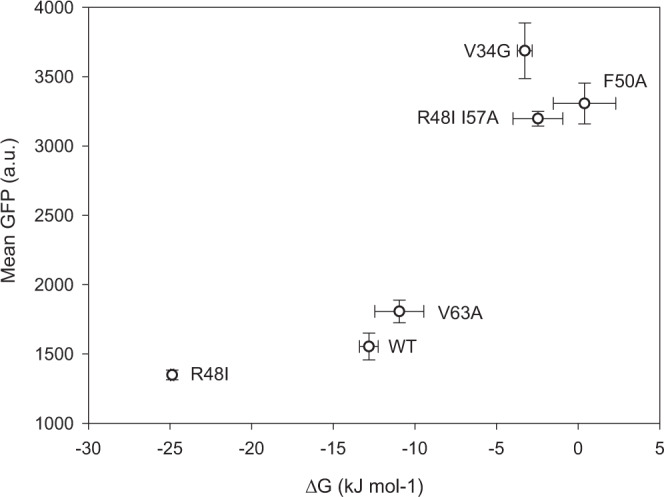
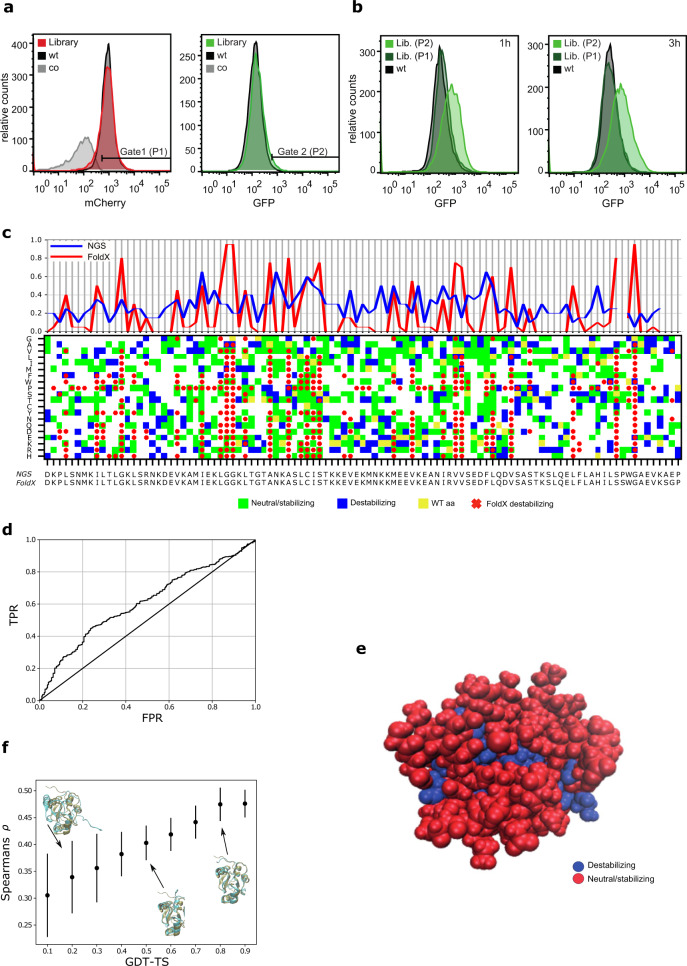
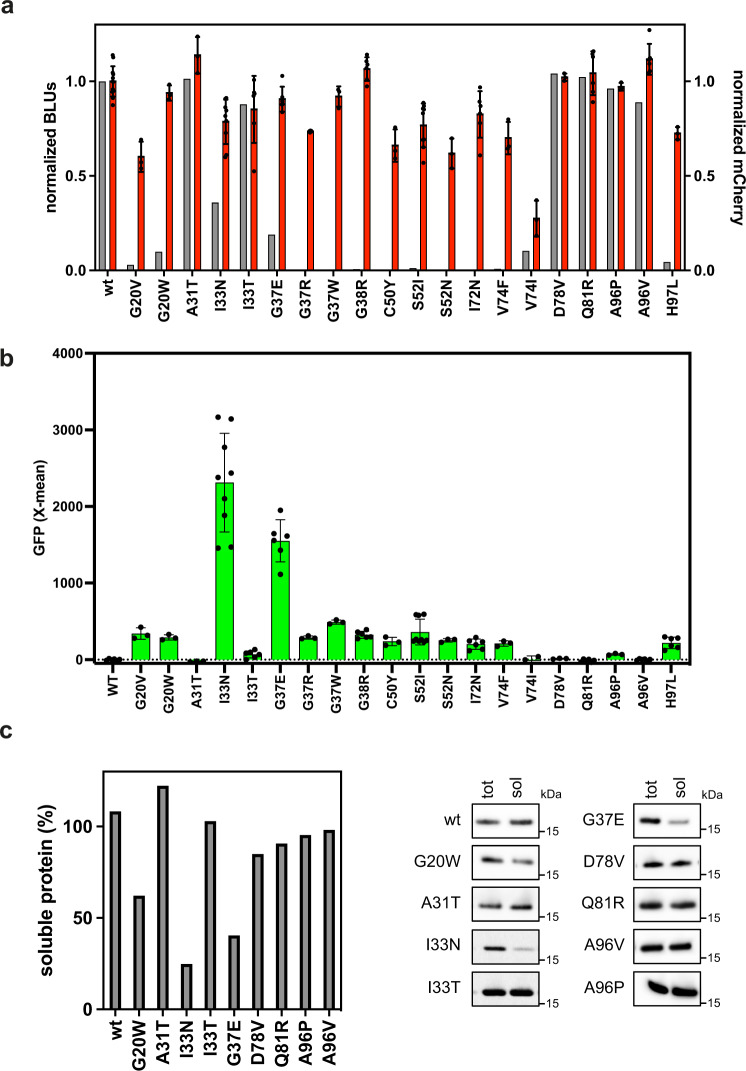
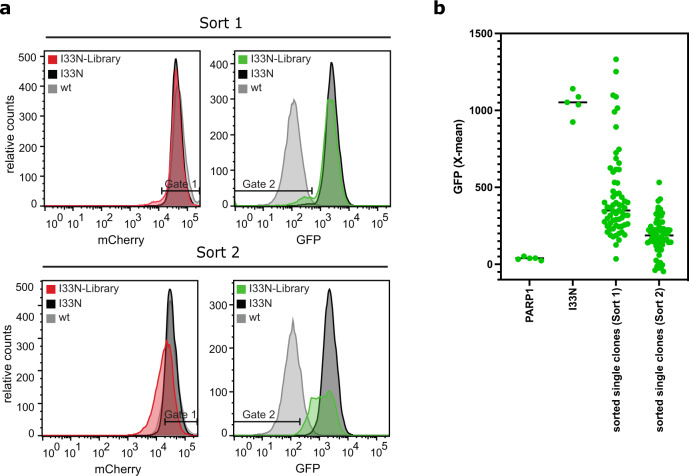
Strategies for investigating and optimizing the expression and folding of proteins for biotechnological and pharmaceutical purposes are in high demand. Here, we describe a dual-reporter biosensor system that simultaneously assesses in vivo protein translation and protein folding, thereby enabling rapid screening of mutant libraries. We have validated the dual-reporter system on five different proteins and find an excellent correlation between reporter signals and the levels of protein expression and solubility of the proteins. We further demonstrate the applicability of the dual-reporter system as a screening assay for deep mutational scanning experiments. The system enables high throughput selection of protein variants with high expression levels and altered protein stability. Next generation sequencing analysis of the resulting libraries of protein variants show a good correlation between computationally predicted and experimentally determined protein stabilities. We furthermore show that the mutational experimental data obtained using this system may be useful for protein structure calculations.


Conflict of interest statement

A.T.N., A.Z. and R.L. have filed a provisional application on this work (EP3209795B1, US10544414B2). The application covers the use of the two-cassette reporter system for assessing gene target translation and folding. All other authors declare no competing interests.

Figures

Fig. 1
Fig. 1. Schematic overview of a dual-reporter system with simultaneous monitoring of protein translation and protein folding at the single cell level.
a The translation sensor is comprised of the gene of interest translationally coupled to the reporter protein mCherry. When the target gene is correctly translated, the RNA polymerase unfolds the secondary structure and the mCherry gene is transcribed resulting in a red fluorescent signal. The synthesized polypeptide chain then either folds into a soluble protein conformation or it fails to fold, thereby typically forming protein aggregates that accumulate as inclusion bodies. Formation of inclusion bodies increases the cellular level of free RpoH (heat shock sigma-factor σ). RpoH binds to the lbpA promoter in the protein folding sensor, initiating the expression of an unstable GFP variant, GFP-ASV, yielding a green fluorescent signal. b Overview of the plasmids used for the protein translation and protein folding sensors.
Fig. 2
Fig. 2. Optimization and test of the protein folding sensor plasmid to improve differentiation of heat shock response signals.
a Monitoring of the heat shock response signals of protein folding sensors (pSEVA441-IbpAp and pSEVA631(Sp)-lbpAp) with different origin of replications (ColE1 and pBBR1, respectively) and GFP variants (GFP-mut3 and GFP-ASV) after induction of the lbpA promoter. Changes in the GFP signal after induced heat shock (HS) are monitored using flow cytometry and the GFP signals in triplicates (average ± SD) are normalized to the respective background signal at each time-point. b FACS profiles for the GFP signals 60 min after induced heat shock for GFP-mut3 and GFP-ASV in plasmids with different origin of replications. Relative counts of GFP fluorescence intensities are shown from the analysis of 10,000 single cells. The heat shock induced (HS) GFP variants expressed from pBBR1 (pSEVA631(Sp)-lbpAp) shows well-defined and distinct peaks, which are easy to distinguish from the un-induced control plasmids (co). The GFP variants expressed from ColE1 (pSEVA441-IbpAp) resulted in very broad and not well-defined peaks making it difficult to distinguish between the heat shock induced plasmids and the control. c SDS-PAGE and immunoblot analysis of total (tot) protein yield and soluble protein (sol) after fractionated cell disruption of two human proteins, PARP1-BRCT and a truncated version of BRCA1-BRCT, shows high expression of a soluble PARP1-BRCT protein, and an insoluble BRCA1-BRCT protein. The shown data is representative of at least three repetitions. d Flow cytometry analysis 60 min after protein induction of the co-expression of PARP1-BRCT and BRCA1-BRCT with the pSEVA631(Sp)-lbpAp-GFP-ASV and pSEVA631(Sp)-lbpAp-GFP-mut3 plasmids. The soluble PARP1-BRCT does not initiate a heat shock response and results in a low green fluorescent signal, whereas the insoluble BRCA1-BRCT protein triggers the heat shock response causing a high green fluorescent signal. The pSEVA631(Sp)-lbpAp-GFP-ASV plasmid has an improved signal-to-noise ratio and is preferred over the pSEVA631(Sp)-lbpAp-GFP-mut3 plasmid. Data are presented as mean values ± standard deviation determined from three biologically independent experiments. e Plate reader analysis 1 h and 3 h after protein induction of the co-expression of PARP1-BRCT and BRCA1-BRCT with the pSEVA631(sp)-lbpAp-GFP-ASV plasmid in E. coli K-12 MG1655 (DE3). The soluble PARP1-BRCT initiates mCherry co-expression, but does not trigger the folding reporter signal, whereas the insoluble BRCA1-BRCT protein has less mCherry signal, but trigger the folding reporter response. Data are presented as mean values ± standard deviation based on three biologically independent experiments. Source data are provided as a Source Data file.
Fig. 3
Fig. 3. Validation of the dual protein translation and misfolding biosensor.
The solubility tags NusA and SUMO were fused to four proteins; PARP1-BRCT, p19, a truncated BRCA1-BRCT, and E6, with known propensities for misfolding. a The proteins were translationally coupled to the fluorescent protein mCherry to monitor the translation using FACS. Data are presented as mean values ± standard deviation for biologically independent samples analyzed for each plasmid combination (n = 4 for PARP1-BRCT, p19 and E6, and n = 3 for BRCA1-BRCT). Protein expression was analyzed by SDS-PAGE analysis and quantified from a single Western blot for each cell line (gray) (BLU = biochemical luminescence unit) and correlated to the mean mCherry fluorescence signal from the analysis of 10,000 cells (red). b Western blot analysis of total protein yield (tot) and soluble protein (sol) after fractionated cell disruption shown together with the quantified GFP response signal for insoluble protein. Data are presented as mean values ± standard deviation based on 4 biologically independent samples. Source data are provided as a Source Data file.
Fig. 4
Fig. 4. Correlation between GFP fluorescence and protein stability.
Six CI2 variants were co-expressed with the protein folding sensor (pSEVA631(Sp)-lbpAp-GFP-ASV), and the GFP fluorescence was analyzed by FACS. The average mean GFP fluorescence was compared to the Gibbs free energy of unfolding (∆Gunf) determined from global fits of thermal and chemical unfolding of each protein. All measurements were determined in triplicates and the data are presented as mean values ± standard deviation. Source data are provided as a Source Data file.
Fig. 5
Fig. 5. FACS sorting and deep mutational scanning to identify variants of PARP1-BRTC with decreased protein folding.
a FACS sorting of PARP1-BRCT mutant library (red and green), PARP1-BRCT WT (black), and the translation sensor plasmid without a gene inserted (gray). Cells were sorted for high translation levels (Gate 1) and degree of protein misfolding (Gate 2). b The sorted cells were grown overnight and analyzed by flow cytometry 1 and 3 h after protein expression was induced. c Top: Ratio between the number of destabilizing mutations and the number of total mutations for each amino acid residue for both FoldX (red) and experimental data (blue). Bottom: Matrix plot indicating if an amino acid change (y-axis) of the sequence (x-axis) was destabilizing according to the high-throughput sequencing data as well as for FoldX calculations. For the experimental data, green and blue squares indicate neutral/stabilizing and destabilizing mutations, respectively. Yellow marks the wildtype to wildtype mutants, and white marks mutations with no experimental readout. Red x’s indicate destabilizing mutations according to FoldX, with a cut-off of 3 kcal/mol. All squares without red x’s are predicted to be neutral or stable mutants. d Receiver Operating Characteristic analysis of sequencing data and predicted FoldX ΔΔGs. The sequencing data provides the mutation specific labels (blue vs green in Fig. 5C) and the ΔΔGs predicted from FoldX are the mutation specific scores. e Structural visualization of stable vs destablilizing sequence positions of the PARP1-BRCT structure based on the experimental data. Blue residues that destabilize the protein have a Ndestabl./Ntotal ≥ 0.2, while the remaining are colored red. f Scoring of 20.000 structural decoys based on the experimental data. The plot shows the Spearman’s correlation coefficient, ρ, that quantifies the correlation between residue depth and mutational tolerance based on the experimental data, as well as a structural quality measure defined by the structural Global Distance Test – Total Score (GDT-TS) score, where one corresponds to a native or near native structure. Here, the mean ρ is plotted for structures binned to the closest 0.1 GDT-TS bins. The error bars represent standard deviations for the individual bins. Source data are provided as a Source Data file.
Fig. 6
Fig. 6. PARP1-BRCT mutants with changed folding properties identified from a randomly generated mutant library using the dual-reporter system.
a Correlation between translation levels of 20 PARP1-BRCT mutants quantified from Western blots (gray, n = 1) and flow cytometry analysis of mean mCherry fluorescence values ± standard deviation (red), each normalized to the WT signal (n ≥ 3, biologically independent samples). b GFP levels analyzed using flow cytometry as a measure for protein solubility and folding properties. Data are presented as mean values ± standard deviation for n ≥ 3 biologically independent samples. c Percentage of soluble protein determined by Western blot for the 9 PARP1-BRCT mutants with a detectable GFP response signal. Western blot analysis of total protein yield (tot) and soluble protein (sol) after fractionated cell disruption (n = 1). Source data are provided as a Source Data file.
Fig. 7
Fig. 7. Identification of protein variants with improved folding properties from a PARP1-BRCT-I33N mutant library using the dual-reporter system.
A random PARP1-BRCT-I33N mutant library was co-expressed with the protein folding sensor. The cell populations were analyzed using FACS 1 h after IPTG induced protein expression. a FACS analysis of PARP1-BRCT WT, PARP1-BRCT-I33N, and the PARP1-BRCT-I33N mutant library, where the mCherry signal correlates with the translation level of PARP1-BRCT, while the GFP fluorescence is a measure of folding properties. Two gates were defined for sorting populations with high translation (Gate 1) and low GFP fluorescence (Gate 2), thus with improved folding properties compared to PARP1-BRCT-I33N. A shift is observed in GFP signal distribution and intensities between the two rounds of sorting, showing that it is possible to enrich the population with low GFP clones after multiple rounds of sorting. b Single clones analyzed after each round of sorting, resulted in 1.5% or 12.5% of the clones overlapping with the PARP1-BRCT WT GFP signal (n = 5 biologically independent samples for PARP1-BRCT WT, PARP1-BRCT-I33N and n = 1 for each of the 75 individual clones isolated from the library). Data are presented as individual data points with the mean value indicated. Source data are provided as a Source Data file.

References

    1. Costa S, Almeida A, Castro A, Domingues L. Fusion tags for protein solubility, purification, and immunogenicity in Escherichia coli: the novel Fh8 system. Front. Microbiol. 2014;5:1–20. - PMC - PubMed
    1. Marblestone JG, et al. Comparison of SUMO fusion technology with traditional gene fusion systems: enhanced expression and solubility with SUMO. Protein Sci. 2006;15:182–189. doi: 10.1110/ps.051812706. - DOI - PMC - PubMed
    1. Carson M, Johnson DH, McDonald H, Brouillette C, DeLucas LJ. His-tag impact on structure. Acta Crystallogr. Sect. D. Biol. Crystallogr. 2007;63:295–301. doi: 10.1107/S0907444906052024. - DOI - PubMed
    1. Yu CH, et al. Codon Usage Influences the Local Rate of Translation Elongation to Regulate Co-translational Protein Folding. Mol. Cell. 2015;59:744–754. doi: 10.1016/j.molcel.2015.07.018. - DOI - PMC - PubMed
    1. Zhang G, Hubalewska M, Ignatova Z. Transient ribosomal attenuation coordinates protein synthesis and co-translational folding. Nat. Struct. Mol. Biol. 2009;16:274–280. doi: 10.1038/nsmb.1554. - DOI - PubMed

Publication types

MeSH terms

Substances